Int. J. Mechatronics and Manufacturing Systems, Vol. 2, Nos. 1/2, 2009
Coding, evaluation, comparison, ranking and optimum selection of Micro-Electro-Mechanical System (MEMS) products A. Amalin Prince* and V.P. Agrawal Birla Institute of Technology and Science-Pilani Goa Campus, Goa, 403726, India E-mail:
[email protected] E-mail:
[email protected] *Corresponding author Abstract: To address the issues involved in the optimum selection of high performance Micro-Electro-Mechanical Systems (MEMS) products for typical applications, different subsystems of MEMS products are defined. An n-digit alphanumeric coding scheme is proposed. The coding scheme is a nomenclature and characterises the MEMS products on the basis of n-attributes. A typical Multiple Attribute decision Making (MADM) approach is used for evaluation, comparison, ranking and optimum selection. A 3-stage selection procedure is proposed to make the methodology commercially feasible and vibrant. Graphical procedures consisting of line diagram and spider diagram are also proposed. Methodology has been demonstrated by illustrative examples. A step-by-step procedure is proposed for implementation of the methodology by the industry. Keywords: MEMS; micro-electro-mechanical systems; MADM; multiple attribute decision-making; optimum selection; ranking; TOPSIS; technique for order preference by similarity to ideal solution. Reference to this paper should be made as follows: Amalin Prince, A. and Agrawal, V.P. (2009) ‘Coding, evaluation, comparison, ranking and optimum selection of Micro-Electro-Mechanical System (MEMS) products’, Int. J. Mechatronics and Manufacturing Systems, Vol. 2, Nos. 1/2, pp.97–119. Biographical notes: A. Amalin Prince is a Faculty and Doctoral candidate in the Electrical and Electronics Engineering Group at the Birla Institute of Technology and Science, Pilani, Goa campus, Goa, India. He received the BE in Electronics and Communication Engineering from The Indian Engineering College, Vadakankulam, Tamil Nadu, India, in 2002, and ME in Applied Electronics from Sathyabama Institute of Science and Technology, Chennai, India, in 2005. He teaches undergraduate courses in Electrical and Electronics Engineering. His major research interests are Micro-Electro-Mechanical Systems (MEMS), microelectronics, embedded systems and concurrent engineering. V.P. Agrawal is working as a Visiting Professor of Mechanical Engineering at the Birla Institute of Technology and Science, Pilani, Goa campus, Goa, India, after his retirement from IIT Delhi, India. He had been at IIT Delhi for the last 28 years and scaled from Lecturer to Professor in the Mechanical Engineering Department. He completed his graduation in 1966, Post-Graduation in 1969
Copyright © 2009 Inderscience Enterprises Ltd.
97
98
A.A. Prince and V.P. Agrawal and PhD in 1983 from Jiwaji University Gwalior, University of Roorkee, and IIT Delhi, respectively. He has published around 140 papers in international journals and conferences. He has guided successfully a large number of BTech, MTech projects and supervised a number of PhD Theses. He has worked extensively in the areas of mechanisms, systems approach, and machine design.
1
Introduction
In recent years, the micro-scale devices based on semiconductor processing technology called Micro-Electro-Mechanical System (MEMS) have attracted attention. Using a combination of electrical and mechanical functions, it is possible to sense, control and actuate precisely on the micro-scale (Miki et al., 2004). Development of MEMS devices, however, still relies on knowledge and experience of MEMS experts owing to the design and fabrication complexity. It is difficult to understand the trade-offs inherent in the system and achieve an optimal structure without any MEMS-related insight. Therefore, development speed of MEMS products is typically slow because iterative structural analysis, layout and testing are necessary to achieve complete structures. Furthermore, MEMS engineers typically need to design structures under some MEMS fabrication limitations. Thus, MEMS engineers tend to pursue just a few primary characteristics without consideration of the total system performance. This is another reason that time-consuming product developing process is unable to bring right MEMS products to market at right time (Mamiya et al., 2004). This paper describes a new methodology to the MEMS industry, designer and manufacturer in deciding the subsystems as well as MEMS product system selection. It helps in achieving the expected quality and properties of final MEMS product with the help of integrated systems approach and also a decision-making approach based on the attributes identification. MEMS are the ultimate enabling technology for integration of almost any phenomena – motion, light, sound, chemical detection, radio waves and computation, but on a single chip (Wang, 2004). A thorough literature survey reveals that there have been a number of studies associated with MEMS fabrication like surface micromachining (Bustillo et al., 1998), bulk micromachining (Kovacs et al., 1998), wafer-to-wafer bonding (Schmidt, 1998) and LIGA process (Ren et al., 2005). Many environmental factors may impact an MEMS device, as they need to interact with the environment. The challenge to the MEMS sensor manufacturer is to develop packaging technologies that meet all the necessary performance and reliability criteria while keeping assembly costs to a minimum (Ramesham and Ghaffarian, 2000). Each MEMS application usually requires a new package design to optimise its performance or to meet the needs of the system. It is possible to loosely group packages into several categories including all metal packages, ceramic packages, plastic packages and thin-film multilayer packages. A few papers give detailed information about challenges, characteristics, types and application of MEMS packaging (Wang, 2004; Ramesham and Ghaffarian, 2000; Yufeng et al., 2005).
Coding, evaluation, comparison, ranking and optimum selection
99
This paper addresses a number of issues like coding, evaluation, comparison, ranking and optimum selection of MEMS products. Coding/Characterisation/Specification of MEMS is proposed to carry out using an exhaustive set of attributes related to design, manufacturing, etc. The issues related to evaluation, comparison, ranking and optimum selection fall under three categories, e.g., Multiple Attribute Decision-Making (MADM), Multiple Criteria Decision-Making (MCDM) and Multiple Objective Decision-Making (MODM). In each of these categories, a number of techniques in original forms and their modifications are available. Optimum selection of a particular technique is carried out on the basis of •
type of information available
•
application, e.g., designing a product, manufacturing a product, decision-making in social sciences, management, operation research, etc.
The selection of a suitable technique for given application (decision-making in social sciences, operations research and management, etc.) is given in a hierarchical form by Hwang and Yoon (1982). Analytical Hierarchical Process (AHP) – an MCDM approach is recommended for decision-making in social sciences, management, etc., while Technique for Order Preference by Similarity to Ideal Solution (TOPSIS) – an MADM approach is recommended for attribute-based design evaluation, generation of design alternatives, sensitivity analysis, etc. The main advantages of TOPSIS are •
a sound logic that represents the rational of human choice
•
a scalar value that accounts for both the best and worst alternatives simultaneously
•
a simple computation process that can be easily programmed into a spreadsheet
•
the performance measures of all alternatives can be visualised on a polyhedron, at least for any two dimensions.
These advantages make TOPSIS a major MADM technique when compared with other related techniques such as AHP and ELECTRE (Shih et al., 2007). TOPSIS has been applied successfully in variety of other disciplines (Agrawal et al., 1992; Bhangale et al., 2004; Jee and Kang, 2000; Prabhakaran et al., 2006; Satapathy and Bijwe, 2004; Tong et al., 2003; Venkatasamy and Agrawal, 1994; Wang et al., 2000). On the basis of its suitability to address design and manufacturing issues, TOPSIS in original form has been selected in this paper for design evaluation of MEMS products. Though AHP enables the decision-maker to represent interaction of many factors in a complex unstructured situation, judgements based on observations are fed into AHP for each attribute and sub-attribute for all levels of hierarchy. As this type of information and situation does not arise in MEMS design evaluation based on a given set of attributes, TOPSIS is preferred over AHP. From the above literature review, in spite of lots of concern and efforts, methodologies are scarce to deal with by considering a system approach that can take all the attributes that are mainly responsible for producing an MEMS product system using optimum selection procedure. No mathematical procedure is available for optimum selection and no coding scheme is available for better understanding, storage and retrieval for MEMS product. Till now, no one applied the proposed methodology in MEMS field that too by considering the attributes that are mainly related to subsystems
100
A.A. Prince and V.P. Agrawal
say Design, Fabrication, Environment, Packaging and Transduction (Input and Output) of MEMS product system. This is why it is proposed to carry out this study. In this paper, a TOPSIS – an MADM approach and graphical methods (line graph and spider diagram methods) are used successfully to MEMS product system by considering its pertinent attributes in totality. The graphical method is not only the original contribution for design evaluation, comparison and optimum selection of MEMS product, but also very useful when milestones are set to improve the MEMS product design and ultimately to achieve the benchmark product. It is useful for visual analysis of design process at different stages of product development along with comparison with TOPSIS. Graphical procedure has been applied successfully in other disciplines also (Prabhakaran et al., 2006; Bhangale et al., 2004). The proposed methodology is explained with the help of an illustrative example for the optimum selection of a micromirror for an optical scanner. Ranking and selection procedure is explained for one subsystem selection, i.e., design system for MEMS system. The step-by-step procedure to apply this methodology in MEMS industry and usefulness to MEMS industry is also addressed. Deng et al. (2000) have used modified TOPSIS for inter-company comparison using entropy measure for weight evaluation. Also, a number of modifications in original TOPSIS have been suggested and published (Rao, 2007; Shih et al., 2007; Ren et al., 2007). Detailed comparison of results based on different modifications with original TOPSIS is under preparation and will be reported in future publication.
2
Identification of attributes
Proper identification of relevant attributes is critically important to compare and select a particular MEMS product. A long list of attributes related to total MEMS product system has been developed on the basis of published literature in the form of research papers, books, manufacturers’ catalogues, website, etc. It cannot be claimed that this is a complete list of attributes or all these attributes are useful and should be considered by all users of this methodology. The attributes are found out on its broad area of subsystems say Design, Fabrication, Environment, Packaging and Transduction (Input and Output) of MEMS by considering MEMS product as a system in totality. These attributes play a significant role in selection of suitable Design system, Fabrication system, Environment system, Packaging system and Transduction system. The attributes are of two types: quantitative/deterministic and qualitative/fuzzy/ subjective. Quantitative attributes can be determined or calculated using mathematical models or experimentally. Qualitative attributes are subjective in nature and imprecise information is available. It is desirable to evaluate the inheritance/presence of qualitative attributes on one of the several interval scales, e.g., 0–5, 0–7, etc., for uniformity. Alphabets are used to represent those attributes that cannot be represented by numbers. As different quantitative attributes are measured in different units having different magnitudes, it is difficult to carry out sensitivity analysis to identify critical attributes. So, it is recommended to transform quantitative attributes, again on common interval scale (e.g., 0–5 or 0–7) as used in the case of qualitative attributes. The attributes may be fuzzy in nature where imprecise information is available. Different types of fuzzy functions, e.g., triangular, trapezoidal, etc., are available in the literature (Yang and Hung, 2007; Yang et al., 2007). Detailed study is being carried out
Coding, evaluation, comparison, ranking and optimum selection
101
by the authors based on fuzzy information using TOPSIS and its comparison with original deterministic TOPSIS and the results will be communicated in future publication. Quantification procedure of many of these attributes is not readily available from the manufacturers. A team of experts from relevant disciplines can codify all the attributes related to a particular MEMS product. Examples shown in Table 1 illustrate the proposed coding for quantitative and qualitative attributes. For example, 0–5 interval scale is used for fill factor (in percent) as unspecified assigned to 0, between 0 and 80 as 1, between 81 and 85 as 2, between 86 and 90 as 3, between 91 and 95 as 4, and the last greater than 95 assigned as 5. The qualitative attribute shape is coded as unknown is assigned to 0, circular as CR, rectangular as RR, square as SR, polygon as PN and oval as OL. Table 1
Illustration of coding Quantitative attributes
Coding of actuation voltage Actuation voltage (V)
Qualitative attributes
Coding of fill factor
Fill factor Code (%)
Coding of micromirror shape
Code Shape
Coding of type of energy conversion
Code Type 0
Unknown
Code
Un-specified
0
Un-specified
0
Unknown
0
Up to 60
1
Up to 80
1
Circular
CR Mechanical to other domain MO
61–90
2
81–85
2
Rectangular
RR Electrical to other domain
EO
91–120
3
86–90
3
Square
SR Chemical to other domain
CO
121–150
4
91–95
4
Polygon
PN Thermal to other domain
TO
Above 150
5
Above 95
5
Oval
OL Radiative to other domain
RO
Some attributes are common to more than one subsystem they are grouped in to the most relevant subsystem. The design parameters are generally associated with the customer requirements to an optimum product. Design subsystem attributes (i.e., Shell No. 1–48 in Table 2) are very important in determining the performance and specification of an MEMS product (Sasaki et al., 2006; Shin et al., 1997; Seo et al., 1996; Chiou and Lin, 2003; Yee et al., 2000; Lee and Lin, 2004; Ji et al., 2006; Singh et al., 2006; Jain and Xie, 2006; Michalicek and Bright, 2001; Yu and Chen, 2006; Niklaus and Stemme, 2003; Cheng et al., 2005). Attributes related to fabrication subsystem (i.e., Shell No. 49–68 in Table 2) play an important role in product manufacturing (Jain and Xie, 2006; Michalicek and Bright, 2001; Yu and Chen, 2006; Niklaus and Stemme, 2003; Kouma et al., 2005; Hao et al., 2003; Lim and Kim, 1999; Tung and Kurabayashi, 2005). Attributes in environment subsystem listed in Table 2 (i.e., Shell No. 69–82) are to be considered seriously because the MEMS product is interacting with the environment (Cheng et al., 2005; Tung and Kurabayashi, 2005; Boustedt et al., 2002; Bhushan, 2007; Pearsson et al., 2002). Packaging is an integral part of the MEMS product and the attributes related are listed under packaging subsystem (i.e., Shell No. 83–91 in Table 2) (Wang, 2004; O’Neal et al., 1999). Selection of Transduction subsystem is another important aspect in MEMS industry. Selection of the appropriate sensors and actuators based on attributes like linearity, sensitivity, bandwidth, etc., contributes to significantly improve the MEMS products. The attributes related to transduction subsystem are defined in Table 2 (i.e., Shell No. 92–101) (Liu, 2006; Velten et al., 2005; Grayson et al., 2004).
102 Table 2
A.A. Prince and V.P. Agrawal Alphanumeric coding for the design of micromirror for optical scanner applications
Shell no.
Attribute
Information
Code
1
Pull-in voltage
3V
2
2
Maximum rotation angle
7.3
3
3
Resonant frequency
670 Hz
3
4
Actuation voltage
5V
1
5
Area of the mirror
100 × 100 µm2
3
6
Resolution
–
0
7
Threshold deflection
26.5 µm
2
8
Settling time
–
0
9
Surface reflectivity
85%
4
10
Cross axis coupling
–
0
11
Actuation accuracy
–
0
12
Mirror flatness
–
0
13
Light coupling efficiency
–
0
14
Radius of curvature
200 cm
3
15
Power consumption
–
0
16
Active area
91%
4
17
Response time
10 µs
2
18
DC bias voltage
50
2
19
Scale factor
–
0
20
Output noise
–
0
21
Insertion loss
–
0
22
Noise factor
–
0
23
Turning range
–
0
24
Phase shift
–
0
25
Power loss
–
0
26
Switching energy
–
0
27
Switching speed
0.1 ms
3
28
Pull in angle
2.96°
2
29
Damping coefficient
–
0
30
Form factor
–
0
31
Electrostatic torque
–
0
32
Gap between electrodes and mirror
–
0
33
Frame length
–
0
34
Inter electrode gap
79.5 µm
3
35
Width of electrodes
–
0
36
Sample size
–
0
37
Detection limit
–
0
Coding, evaluation, comparison, ranking and optimum selection Table 2 Shell no.
103
Alphanumeric coding for the design of micromirror for optical scanner applications (continued) Attribute
Information
Code
38
Rotation angle tolerance
±0.1°
4
39
Operating range
–
0
40
Channel pass band shape
Low pass
41
Gain
–
42
Frequency of oscillation
100 kHz
5
43
Data rate
–
0
44
Phase noise
–
0
45
Q-factor
–
0
LPF 0
46
Shape
Oval
OL
47
Array pitch
2 mm
2
48
Width of electrodes
–
49
Fabrication process type
Bulk-micromachining
0
50
Fill factor
80%
1
51
Aspect ratio
10
4
52
Thickness of the poly silicon
–
0
53
Fabrication tolerance
±0.2 µm
2
54
Positional error
–
0
55
Alignment accuracy
–
0
56
RMS roughness
–
0
BM
57
Coefficient of microscale friction
–
0
58
Adhesion
–
0
59
Surface to volume ratio
–
0
60
Deposition rate
–
0
61
Etching selectivity
–
0
62
Processing temperature
400°K
3
63
Etch uniformity
–
0
64
Sensitivity to over-time etch
–
0
65
Surface finish
Good
66
Surface defects
–
67
Safety of etchants
High
HI
68
Coast of etchants
Medium
ME
69
Crosstalk
Very less
VL
70
Temperature
100°K
2
71
Moisture
–
0
72
Vibration
–
0
73
Shock
–
0
GD 0
104
A.A. Prince and V.P. Agrawal
Table 2 Shell no.
Alphanumeric coding for the design of micromirror for optical scanner applications (continued) Attribute
Information
Code
74
Electromagnetic interference
–
0
75
Velocity
–
0
76
Viscosity
–
0
77
Acceleration
–
0
78
Pressure
–
0
79
Mechanical stress
–
0
80
Gas
–
0
81
Corrosion
–
0
82
Particles
Non-radiative
83
Life time
200 month
NR
84
Product volume
1000
2
85
Release
–
0
86
Stiction
–
0
87
Dicing
–
0
88
Out gassing
–
0
89
Thermal expansion
0.01%
3
90
Extrinsic parasitic effect
–
0
91
Thermal conductivity
–
0
92
Type of energy conversion
Electrical to other
93
Displacement rate
–
3
EO 0
94
Biocompatibility
Bio-compatible
95
Sensitivity
0.01 µm/V
2
96
Linearity
–
0
97
Responsivity
–
0
98
SNR
100 dB
3
99
Dynamic range
–
0
100
Reliability
–
0
101
Bandwidth
100 kHz
4
3
BC
Coding scheme
It is proposed to characterise an MEMS product system with the help of these 101 attributes. Each attribute is allotted a serial numbered box (Shell No.) in the coding scheme for identification by the computer. Each box is filled by a code/value/number, which represents the presence or inheritance of that particular attribute in a particular MEMS product system. To facilitate the selection of pertinent attributes for the application, the attributes are required to be evaluated and coded for range of values. This coding is alphanumeric.
Coding, evaluation, comparison, ranking and optimum selection
105
The overall performance of outcoming product of MEMS industry directly depends on the proper choice of all these subsystems. The MEMS product should be specified, characterised, processed and evaluated with the help of identified attributes. The attributes are identified based on the selection of five subsystems for an MEMS product system. They are listed in Table 2. Table 2 consists of four columns. The first column contains Shell No., while second, third and fourth columns contain name of attributes, information and codes, respectively, for 101-attribute alphanumeric coding scheme as given in Table 3. Table 3
An alphanumeric attribute identification coding scheme of a typical MEMS product system-micromirror for optical scanner
Design subsystem (Shell No. 1–48)
2
3
3
1
3
0
2
0
4
0
0
0
0
3
0
4
2
2
0
0
0
0
0
0
0
0
3
2
0
0
0
0
0
3
0
0
0
4
0
LPF
0
5
0
0
0
OL
2
0
Fabrication subsystem (Shell No. 49–68)
BM
1
4
0
2
0
0
0
0
0
0
0
0
3
0
0
GD
0
HI
ME
Environment subsystem (Shell No. 69–82)
VL
2
0
0
0
0
0
0
0
0
0
0
0
NR
3
2
0
0
0
0
3
0
0
EO
0
BC
2
0
0
3
0
0
Packaging subsystem (Shell No. 83–91) Transduction subsystem (Shell No. 92–101)
4
4
A three-stage selection procedure
Though 101 attributes have been identified, all of them would not be highly important while selecting the MEMS product for a particular application. A three-stage selection procedure for optimum selection of candidate from the available large database of alternative candidates is designed for the MEMS industry. TOPSIS method (Hwang and Yoon, 1982) is suggested in the second stage for attribute-based evaluation of candidates. A large list of candidate is reduced to a small list of eligible candidates using a set of pertinent attributes for given application by the method provided in first stage. Third stage provides full flexibility to the industry to take concrete decision with the help of preference list developed at the second stage.
4.1 Algorithm of selection process 4.1.1 Stage 1: Elimination search This may be achieved by scanning the database for the set of the pertinent attributes, one at a time, to eliminate the MEMS alternatives, which have one or more pertinent attribute values that fall short of the minimum required (Threshold) values. Pertinent attributes along with their threshold values are selected based on application and performance
106
A.A. Prince and V.P. Agrawal
requirements of intermediate subsystems and final system. At the end of this stage, all candidates are feasible. To facilitate this search procedure, an identification system has been made for all the MEMS products in the database. This stage reduces the unmanageable list of alternatives into a manageable mini-database.
4.1.2 Stage 2: Evaluation and ranking procedure Step 1: The mini-database comprises satisfying solutions, i.e., alternatives that have all attributes satisfying the acceptable levels of aspiration. Represent all the information available from the database about these satisfying solutions in the matrix form. Such a matrix is called as decision matrix, D = (dij), where row ‘i’ corresponds to the ith option (i.e., ith MEMS product) and column ‘j’ corresponds to the jth attribute of the ith MEMS product. Step 2: TOPSIS permits to consider the effect of real-life application of MEMS product during evaluation, comparison and ranking of different alternatives. With the change in the application and the requirements, the relative importance of different attributes also changes. To fulfil this need, a relative importance matrix A = (aij) for given application is proposed. Where aij =
importance of ith attribute wi = importance of jth attribute w j
where wi and wj are the importance weight of ith and jth attributes, respectively. This matrix is prepared by a cross-functional team of relevant/subject experts involved from the conceptual stage of this product. The method permits to consider at a time the relative importance of a pair of attributes for given application only. Only the upper triangular matrix is filled by the experts considering all the needs of the application. Lower triangular matrix terms (aji) are taken as reciprocal of upper triangular matrix terms (aij). All the diagonal elements are unity, as ith attribute is compared with ith attribute only. Team of experts to the best of their knowledge and experience in application domain decides the relative importance for each pair of attributes independently. Step 3: Some discrepancy/inconsistency in the relative importance matrix data creeps in, as only two attributes are compared at a time. To overcome this discrepancy, Eigen value formulation (A – λI)W = 0 is proposed to find out the weight vector W = (w1, w2, w3, …, wn) subject to ∑ wi = 1. Obtain maximum Eigen value ‘λ’ from the Eigen vector λ = (λ1, λ2, …, λmax, …, λn), using this value of ‘λmax’ find vector W (Olson, 2004), where W represents the weights of each attribute as (A – λI)W = 0
(1)
where W = (w1, w2, w3, …, wn). Step 4: Construct normalised specification matrix, N = (nij) from the decision matrix, D = (dij). An element nij of the normalised matrix N can be calculated as nij =
dij
(∑
m i =1
d
1 2 2 ij
)
(2)
Coding, evaluation, comparison, ranking and optimum selection
107
where i = 1, 2, …, m and j = 1, 2, …, n. nij is an element of the normalised decision matrix. It is necessary, as different attributes have different units and magnitudes. This puts all the attributes in the range 0–1. Step 5: Determine weighted normalised decision matrix V = (vij). It will give the true comparable values of the attributes based on normalisation and application. V = W∗ N
or vij = wij nij .
(3)
Step 6: It is desirable to compare different alternative MEMS products with some benchmarked solutions. On the basis of benefit/quality criteria and cost/error criteria, positive ideal and negative ideal values of different attributes are identified from available normalised and weighted database of feasible solutions. These solutions are taken as benchmarked solutions. Determine positive ideal V+ and negative ideal V– solution using the relation. max vij j V + = j ∈ J
min vij , j , i = 1, 2, …, m j ∈ J ′
V + = v1+ , v2+ , …, vn+
(4)
T
where J = ( j = 1, 2, 3, …, n) J′ is associated with benefit/quality criteria, J is associated with cost/error criteria. min vij j V − = j ∈ J
max vij , j , i = 1, 2, …, m j∈ J′
(5)
T
V − = v1− , v2− , …, vn− .
Step 7: In an attempt to develop an index for ranking, different candidates are represented in an n-dimensional attribute space. Their distances from positive and negative ideal solutions are used to calculate the desired index for ranking. Calculate separation measure Si+ and Si− , where a separation from positive-ideal is given by 1
2 2 n S = ∑ ( vij − v +j ) j =1
+ i
(i = 1, 2, …, m)
(6)
and separation from negative-ideal is given by 1
2 2 n Si− = ∑ ( vij − v −j ) j =1
(i = 1, 2, …, m).
(7)
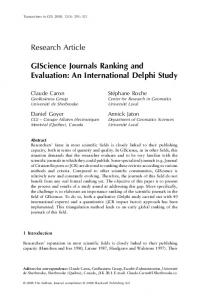
This procedure has shown 2D attribute space in Figure 1. Step 8: Relative closeness to the positive ideal solution is defined in equation (8). Then, the relative closeness to the positive benchmark MEMS, C+, which is a measure of suitability of the MEMS product for the chosen application on the basis of attributes considered, is calculated. MEMS product with the largest C+ is preferable.
108
A.A. Prince and V.P. Agrawal Ci+ =
(S
Si− + i
+ Si− )
where i = 1, 2, …, m.
(8)
Step 9: It can be seen that Ci+ varies between 0 and 1. Ci+ = 1 means that the candidate coincides with positive ideal solution and Ci+ = 0 means that the candidate coincides with negative ideal solution. So, candidate with largest Ci+ is most preferable for given application. Rank the alternative in accordance with the decreasing order of suitability/goodness index C+, indicating the most preferred and the least preferred feasible optimal solutions. The above procedure is illustrated in Figure 1 where candidates vij are represented by two attributes in two-attribute space. Figure 1
A two-attribute (normalised and weighted normalised) representation of a candidate Ci
4.1.3 Stage 3: Optimum selection Final decision is taken by the decision-makers for a given application of an MEMS product system after considering other factors that have not been taken into account earlier during evaluation by TOPSIS, such as cost, human factors, and know how. This is necessary, as a computer cannot altogether replace human brain, i.e., age-old practice of using experience in selecting subsystems for developing MEMS product system in an industrial environment.
5
Graphical methods
TOPSIS method is suitable to carry out attribute-based evaluation using computer, as it is a mathematical procedure. To develop basic understanding of MADM approach, graphical methods (Prabhakaran et al., 2006; Bhangale et al., 2004) are also proposed for evaluation of candidates. Graphical representations help in enhancing the insight and better understanding of the available subsystems and systems. The graphical representation methods used for this purpose are line graph and spider diagram.
Coding, evaluation, comparison, ranking and optimum selection
109
5.1 Line graph representation We have database matrix, D, normalised and weighted normalised data matrices, N and V, respectively, containing information of various pertinent attributes of various types of candidates chosen for study. These candidates can be represented graphically using line graph by plotting the magnitude of their attributes on the vertical axis and the attribute number on the horizontal axis. It is required to note that the attributes of which minimum values are preferred such as accuracy, repeatability, and cost, we use the reciprocals of the magnitudes to plot so that it will bring consistency where all the attributes are to be maximised to reach the best-possible solution. If we plot the values for different candidates, we can obtain the line graph for them. These graphs will be distinct for all types of candidates and can be used as comparison basis. The area under the line graph can be used for quantification purpose and compare the different kinds of subsystems with each other and benchmark the best selection of candidates for the given application, to be defined later. These line graphs can be plotted for original, normalised and weighted data of all the candidates as well as the benchmark candidates. The area under the curve is a measure of suitability/goodness of the MEMS product. Larger the area under the curve, the better the product is. The area under the curve can be obtained as follows. Let the width between the two parameters on horizontal axis be unity and dij, ni,j and vij are the elements of D, N and V matrices on the vertical axis. Area ADiL under the line graph of decision matrix for ith system can be found out as summation of all trapezium areas Ai, under line graph. n
ADiL = ∑ i ⋅ Ai Ai +1 ⋅ (i + 1)
(9)
i =1
ADiL = (di ,1 + 2(di ,2 +
+ di .n −1 ) + di , n ).
(10)
Similarly, area under the graph of normalised and weighted normalised specifications of the ith system, i.e., AN iL and AVi L using their respective elements. Figure 2 shows line graph diagram for seven attributes of four candidate design system as given in illustrative example. Figure 2
Line graph for seven-attribute database matrix (see online version for colours)
110
A.A. Prince and V.P. Agrawal
5.2 Spider diagram representation In this method, the attributes have been considered to be forming the spider diagram. So, the angle θ between the attribute axes passing through a common point Ο can be calculated as θ = 2π/n, where n is the number of attributes under consideration. The original attributes data dij, normalised nij data and weighted normalised vij data are plotted along the attribute axes θi to obtain the spider diagram, also known as polar diagram. Area enclosed by the polygon formed by joining attribute points on corresponding attribute axes on the spider diagram is the indication of the candidate capabilities/suitability. All the attributes of candidates are reduced to this single index. The area enclosed by the polygon of the ith candidate can be calculated as follows. In the spider diagram, θ = 2π/n, where n is the number of attributes, Xi, i = 1, 2, …, n. Let dij represents the original data value of jth attribute in the ith candidate along θi Let nij represents the normalised value of the jth attribute in the ith candidate along θi Let vij represents the weighted normalised value of the jth attribute in the ith candidate along θi. Area of spider diagram ADiS is calculated as ADiS =
sin θ 2
n
∑d j =1
ij
di , j +1 ; where di , n +1 = di ,1 .
(11)
Similarly, for normalised and weighted normalised specification areas enclosed by polygons, i.e., AN iS and AVi S , respectively, are calculated. Figure 3 shows spider diagram for seven attributes Xi, i = 1, 2, …, 7 based on database matrix for four candidate design system as given in illustrative example. Figure 3
Spider diagram polygon for seven-attribute database matrix (see online version for colours)
Coding, evaluation, comparison, ranking and optimum selection
111
5.3 Identification and graphical representation of the benchmark design system The same positive benchmark design system, defined earlier, is used here for the comparison of the candidate design system for the ranking purpose. Calculate the areas under the line graph for positive benchmark design system, i.e., ADBL , AN BL , and AVBL . Also, calculate the areas enclosed by the polygon of spider diagram for benchmark design system, i.e., ADBS , AN BS , and AVBS . All the candidate design systems are compared with the positive benchmark design system for the evaluation purpose. It will show the suitability of the system for the particular task. Let Ai, i = 1, 2, …, m be the enclosed areas of m candidates. The larger the enclosed area, the better the candidate is in comparison.
6
Coefficient of Similarity
The evaluation and ranking of the MEMS design system using the novel graphical methods is done by their similarity to positive benchmark design system. Let the Coefficient of Similarity (COS) be the ratio of area under the curve or enclosed by the polygon for the candidate to that of the benchmark MEMS design system. The value of COS is a positive fraction (0 ≤ COS ≤ 1 and is a measure of the closeness of candidate MEMS design system with the benchmark one. The candidates with COS magnitude closer to unity are preferable, since it indicates the closeness to the positive benchmark MEMS system. COS based on the decision matrix. COSDj =
AD j ADI
(12)
where ADj is the area for jth design system and ADI for the benchmark design system. COS based on the normalised data matrix. COSNj =
AN j AN I
(13)
where ANj is the area for jth design system and ANI for the benchmark design system. COS based on the weighted normalised data matrix. COSVj =
AV j AVI
(14)
where AVj is the area for jth design system and AVI for the benchmark design system. Thus, the COS calculations are made for all the n number of candidate MEMS design system and for both graphical methods, viz., line graph and spider diagram methods using the weighted normalised data matrices also give basic understanding and insight from the selection point of view. They indicate how the preferences changed during the normalisation and weight application process. It can be used for monitoring the process.
112
7
A.A. Prince and V.P. Agrawal
Illustrative example
To illustrate the proposed methodology briefly, let us consider the optimum selection of a micromirror for an MEMS optical scanner. Design system based attributes that are considered for the selection of micromirror are •
mirror area in µm2 (X1)
•
resonant frequency in Hz for Y axis (X2)
•
max rotation angle in degrees for Y axis (X3)
•
actuation voltage in Volt (X4)
•
radius of curvature in cm (X5)
•
surface reflectivity in percent (X6)
•
rotation angle tolerance in percent (X7).
Four mirrors are considered for this example, DuraScan mirror developed for low-speed beam scanning application (Mirror1) (Colibrys, 2003), Digital-8 mirror for optical telecommunication applications (Mirror2) (Colibrys, 2003), Micromirror for an optical scanner in a laser scanning microscope (Mirror3) (Miyajima et al., 2002) and an electrostatically actuated bi-axial micromirror (Mirror4) (Parrain et al., 2005). From the database generated, after ‘elimination search’, we can find out manageable number of candidates and their pertinent attributes. They are listed in Table 4. Table 4
Attributes for shortlisted candidate design system
Mirror/Attribute Mirror1
X1
X2 6
X3
X4
X5
X6
X7
50
12
330
800
96
0.08*
Mirror2
6
2.25 × 10
318
1.8
11
150
96
0.01
Mirror3
12.6 × 10⁶
4100
16
200*
244
85
0.1
Mirror4
6
500
2
200
200
95
0.05*
9 × 10
3.15 × 10
*Assumed value.
The procedure for the best selection of the mirror is as follows: Step 1: Formation of decision matrix or also called as database matrix, ‘D’, from Table 4. 9 × 10⁶ 2.25 × 10⁶ D= 12.6 × 10⁶ 6 3.15 × 10
50
12
318
1.8
4100 16 500
2
330 800 96 0.08 11 150 96 0.01 . 200 244 85 0.1 200 200 95 0.05
(16)
Step 2: Construct a relative importance matrix A. A group of subject experts will determine the relative importance of the attributes with respect to each other for given application. The symmetric terms will be reciprocal to each other.
Coding, evaluation, comparison, ranking and optimum selection 1 2 0.5 1 2 0.5 1 1 1 2 1 0.5 2 1 0.5 0.5 1 2 1 0.5 1 A= 2 1 0.5 1 2 1 0.5 . 1 2 1 0.5 1 0.5 1 1 2 1 1 0.5 0.5 2 2 1 1 2 1 1 1
113
(17)
Step 3: Carry out Eigen value formulation. Obtain Eigen spectrum (λ1, λ2, …, λn). Obtain λmax and calculate weight vector W from (A – λmax I)W = 0. The weight vector obtained using the largest Eigen value is W = (w1, w2, w3, …, wn), i.e., satisfying ∑ wi = 1 . w1 0.14250 w 0.154196 2 w3 0.119404 W = w4 = 0.145659 w5 0.130239 w6 0.141957 w 0.166044 7
(18)
where the largest Eigen Value is 7.757943. Step 4: Calculating the normalised data matrix (N) using equation (3), 0.5639 0.1409 N = 0.7894 0.1974
0.0121 0.5946 0.75903 0.9164 0.5155 0.5804 0.0768 0.0892 0.0253 0.1718 0.5155 0.0725 . 0.9896 0.7928 0.46002 0.2795 0.4564 0.7255 0.1207 0.0991 0.46002 0.2291 0.5101 0.3627
(19)
Step 5: Determine weighted normalised decision matrix (V) using equation (4), 0.08035 0.02009 V = 0.11249 0.02812
0.001861 0.071003 0.11056 0.119356 0.073177 0.096369 0.011836 0.010650 0.003685 0.022379 0.073177 0.012046 . 0.152599 0.094671 0.067006 0.036403 0.064792 0.120461 0.018609 0.011834 0.067006 0.029839 0.072415 0.060230
(20)
Step 6: Determine positive and negative ideal solution using equations (5) and (6), 0.112495 0.152599 0.094671 0.11056 V+ = 0.119356 0.073178 0.120461
(21)
0.020089 0.001861 0.010651 0.003685 V− = . 0.022379 0.064792 0.0120461
(22)
114
A.A. Prince and V.P. Agrawal
Step 7: Calculate separation measure Si+ and Si− using equations (7) and (8), 0.157784 0.260755 Si+ = 0.094066 0.213242
(23)
0.187834 0.013031 Si− = 0.232983 0.080329
(24)
Step 8: Calculate relative closeness to the ideal solution. Then, the relative closeness to the positive benchmark subsystem C+, which is a measure of the suitability of the subsystem for the chosen application on the basis of attributes considered, is calculated using equation (9), C1* =
S1− = 0.543473 S + S1−
C2+ =
S 2− = 0.047595 S 2+ + S 2−
* 1
(25)
S− C = + 3 − = 0.712379 S3 + S3 + 3
C4+ =
S 4− = 0.278741. S 4+ + S 4−
Step 9: Rank the alternative in accordance with the decreasing values of indices Ci+ , indicating the most preferred and least preferred feasible optional solutions. In this case, third candidate having highest relative closeness value 0.712379 is most preferred and second candidate with lowest relative closeness value 0.047595 is least preferred. The ranking is also obtained through graphical methods, and comparison of ranking is given in Table 5. Table 5
Evaluation and ranking of the candidate design system using various methods
Rank TOPSIS – Closeness to the +ve benchmark Based on C+ design C+
COS Rank Based on line Based on graph COSVL COSVL
COS Based on spider diagram COSVS
Rank Based on COSVS
M1
0.5435
2
0.6963
2
0.5193
2
M2
0.0476
4
0.2066
4
0.0376
4
M3
0.7124
1
0.7977
1
0.7422
1
M4
0.2736
3
0.3657
3
0.1361
3
Coding, evaluation, comparison, ranking and optimum selection
115
All the three methods give optimum solution as M3 design system. It is the best suitable mirror for an MEMS optical scanner (Miyajima et al., 2002) for given application.
8
Usefulness to MEMS industry
•
Attribute-based characterisation of MEMS products is useful for better understanding of its Strength, Weakness, Opportunities and Threats (SWOT) to designers, manufacturers, and end-users in general.
•
Industry can prepare a large database of alternative design solutions of different MEMS products and can reduce development cost and time to market.
•
SWOT analysis of the existing product helps in improving the product as per market and manufacturing strategies.
•
Design for different environment and applications differ in terms of attributes only. Fine refinement of these attributes can be done as per the policy of top management.
•
MEMS product system consists of all the subsystems and their related variables, which dictate overall performance, cost, etc. This knowledge helps designers and manufacturers to take right decision at right time.
•
Attribute-based evaluation helps to develop highly customised MEMS product for highly specialised applications with highest quality standards.
9
Step-by-step procedure
A typical MEMS industry can apply this methodology either for design of new product, analysis of existing product for improvement or to carry out root case analysis of failed product as 1
Identify aims and objectives, vision, mission and immediate business and manufacturing strategies and purpose of this application.
2
Identify subsystems, sub-sub systems up to component level suitable for the MEMS product under consideration.
3
Identify attributes-structural, performance, cost, reliability, etc., necessary to satisfy the goal.
4
Develop the desired n-digit alphanumeric code.
5
Develop decision matrix, Relative importance matrix, Eigen value formulation for weight vector, hypothetical positive and negative ideal solution, etc., as per TOPSIS.
6
Find out suitability/goodness index and arrange the candidate MEMS products/solutions in order of performance.
116
A.A. Prince and V.P. Agrawal
7
Decision about the solution of optimum product or improvement of existing product or root cause of failed product or minor adjustment/refinement in attributes of the existing product to improve competitiveness can be taken.
8
Sensitivity analysis to identify critical parameters for unique selling proposition can be carried out by the industry to satisfy Step 1 above.
10 Conclusions To assist MEMS products industry, this paper has brought out the following contributions •
Different subsystems, sub-sub systems up to element levels of MEMS product clearly identify all the parameters, which control its design, performance, reliability, cost, etc. The adjustment in the critical parameters can make the product highly competitive and reliable.
•
Proposed n-digit alphanumeric code is a comprehensive nomenclature of the MEMS products and is very useful for better understanding of the system.
•
Coding scheme is very useful for comparison, sensitivity analysis and minor adjustment of parameters for improving its competitiveness.
•
TOPSIS – an MADM approach carries out attribute-based evaluation of MEMS product. Industry can select a typical set of attributes depending on their performance and business strategy.
•
The identified hypothetically best and worst solutions help industry to set their target and bottom line. In steps, resources can be pooled up to improve certain features in the set time.
•
The methodology is useful not only for attribute-based characterisation and evaluation but also for comparison, ranking and optimum selection.
•
The three-stage selection procedure is designed to achieve the desired results in shortest possible time, keeping the business requirements in mind.
•
Graphical procedures – Line diagram and Spider diagram – are not only good for visual analysis and evaluation but also used for validating TOPSIS procedure. These diagrams represent original data matrix, normalised data matrix and weighted normalised data matrix to consider subjectivity as well as application. Also, positive and negative ideal solutions can be represented by Line and Spider diagrams.
•
Research is in progress and results will be reported on sensitivity analysis and design for X-abilities.
•
Application of the procedure for improvement of the existing MEMS products, identifying root cause of failed products, etc., will be reported in future publications.
Coding, evaluation, comparison, ranking and optimum selection
117
Acknowledgement The authors gratefully acknowledge Durai Prabhakaran, for his fine contributions, support and encouragement during the preparation of this manuscript.
References Agrawal, V.P., Verma, A. and Agrawal, S. (1992) ‘Computer aided evaluation and selection of optimum grippers’, International Journal of Production Research, Vol. 30, pp.2713–2732. Bhangale, P.P., Agrawal, V.P. and Saha, S.K. (2004) ‘Attribute based specification comparison and selection of a robot’, Mechanism and Machine Theory, Vol. 39, pp.1345–1366. Bhushan, B. (2007) ‘Nanotribology and nanomechanics of MEMS/NEMS and BioMEMS/BioNEMS materials and devices’, Journal of Microelectronic Engineering, Vol. 84, pp.387–412. Boustedt, K., Persson, K. and Stranneby, D. (2002) ‘Flip chip as an enabler for MEMS packaging’, 52nd Electronic Components and Technology Conference, San Diego, CA, 28–31 May, pp.124–128. Bustillo, J.M., Howe, R.T. and Muller, R.S. (1998) ‘Surface micromachining for microelectromechanical systems’, Proceedings of the IEEE, Vol. 86, pp.1552–1574. Cheng, Y.C., Dai, C.L., Lee, C.Y., Chen, P.H. and Chang, P.Z. (2005) ‘A MEMS micromirror fabricated using CMOS post-processor’, Journal of Sensors and Actuators A, Vol. 120, pp.573–581. Chiou, J.C. and Lin, Y.C. (2003) ‘A multiple electrostatic electrodes torsion micromirror device with linear stepping angle effect’, Journal of Microelectromechanical Systems, Vol. 12, pp.913–920. Colibrys, S.A. (2003) Products: Micro Mirrors-Applied MEMS, online available at: http://www.appliedmems.cc/htmlmems/p_mm.html [accessed 30 May 2008]. Deng, H., Yeh, C.H. and Willis, R.J. (2000) ‘Inter-company comparison using modified TOPSIS with objective weights’, Computers and Operations Research, Vol. 27, pp.963–973. Grayson, A.C.R., Shawgo, R.S., Johnson, A.M., Flynn, N.T., Li, Y., Cima, M.J. and Langer, R. (2004) ‘A Bio-MEMS review: MAMS technology for physically integrated devises’, Proceedings of the IEEE, Vol. 92, pp.6–19. Hao, Z., Wingfield, B., Whitley, M. and Hammer, J.A. (2003) ‘A design methodology for a bulk-micromachined two-dimensional electrostatic torsion micromirror’, Journal of Microelectromechanical Systems, Vol. 12, pp.692–701. Hwang, C.L. and Yoon, K. (1982) Multiple Attribute Decision Making–Methods and Applications-A State of the Art Survey, Notes in Economics and Mathematical Systems, Springer-Verlag, Berlin. Jain, A. and Xie, H. (2006) ‘A single-crystal silicon micromirror for large bi-directional 2D scanning applications’, Journal of Sensors and Actuators A, Vols. 130, 131, pp.454–460. Jee, D.H. and Kang, K.J. (2000) ‘A method for optimal material selection aided with decision-making theory’, Materials and Design, Vol. 21, pp.199–206. Ji, C.H., Choi, M., Kim, S.C., Lee, S.H. and Bu, J.U. (2006) ‘Performance of a raster scanning laser display system using diamond shaped frame supported micromirror’, IEEE Photonics Technology Letters, Vol. 18, pp.1702–1704. Kouma, N., Tsuboi, O., Soneda, H., Ueda, S. and Sawaki, I. (2005) ‘Fishbone-shaped vertical comb actuator for dual-axis 1-D analog micromirror array’, Proceedings of the 13th International Conference on Solid-State Sensors, Actuators and Microsystems, Seoul, Korea, 5–9 June, pp.980–983.
118
A.A. Prince and V.P. Agrawal
Kovacs, G.T.A., Maluf, N.I. and Petersen, K.E. (1998) ‘Bulk micromachining for silicon’, Proceedings of the IEEE, Vol. 86, pp.1536–1551. Lee, K.B. and Lin, L. (2004) ‘A vertically-supported two-axial torsion micromirror’, Proceedings of the 17th IEEE Micro Electro Mechanical Systems Conference, Maastricht, Netherlands, January, pp.41–44. Lim, T.S. and Kim, Y.K. (1999) ‘Fabrication and experimentation of vertical spring-type micromirror using shielding screen structure’, IEEE Journal of Selected Topics in Quantum Electronics, Vol. 5, pp.102–105. Liu, C. (2006) Foundations of MEMS, US River Edition, Pearson Prentice-Hall, New Jersey. Mamiya, H., Ishikawa, K. and Yu, Q. (2004) ‘A new MEMS optimal design method using CASE’, Proceedings of the IEEE, pp.529–534. Michalicek, M.A. and Bright, V.M. (2001) ‘Flip-chip fabrication of advanced micromirror arrays’, Proceedings of the 14th IEEE International Conference on Micro Electro Mechanical Systems, Interlaken, Switzerland, 21–25 January, pp.313–316. Miki, T., Ishikawa, K., Mamiya, H. and Yu, Q. (2004) ‘Large displacement electrostatic micromirror fabricated using solder flip chip bonding’, Proceedings of the IEEE, pp.535–540. Miyajima, H., Asaoka, N., Isokawa, T., Ogata, M., Aoki, Y., Imai, M., Fujimori, O., Katashiro, M. and Matsumoto, K. (2002) ‘Product development of a MEMS optical scanner for laser scanning microscope’, Proceedings of the 15th IEEE International Conference on Micro Electro Mechanical Systems, Las Vegas, NV, USA, 20–24 January, pp.552–555. Niklaus, F. and Stemme, G. (2003) ‘Arrays of monocrystalline silicon micromirrors fabricated using CMOS compatible transfer bonding’, Journal of Microelectromechanical Systems, Vol. 12, pp.465–469. O’Neal, C.B., Malshe, A.P., Singh, S.B. and Brown, W.D. (1999) ‘Challenges in the packaging of MEMS’, Proceedings of the International Symposium on Advanced Packaging Materials: Processes, Properties and Interfaces, Braselton, GA, USA, 14–17 March, pp.41–47. Olson, D.L. (2004) ‘Comparison of weights in TOPSIS models’, Mathematical and Computer Modeling, Vol. 40, pp.721–727. Parrain, F., Megherbi, S., Raynaud, G., Mathias, H., Gilles, J.P., Bosseboeuf, A., Schropfer, G., Faure, N. and Cusin, P. (2005) Experimental Measurements and Behavioral Modeling of an Electrostatically Actuated Bi-Axial Micromirror, Springer-Verlag, Vol. 12, pp.8–14. Persson, K., Hedvalls, A. and Boustedt, K. (2002) ‘Fundamental requirements on MEMS packaging and reliability’, Proceedings of the Eighth International Symposium on Advanced Packaging Materials, Atlanta, GA, 3–6 March, pp.1–7. Prabhakaran, R.T.D., Babu, B.J.C. and Agrawal, V.P. (2006) ‘Optimum selection of a composite product system using MADM approach’, Materials and Manufacturing Process, Vol. 21, pp.883–891. Ramesham, R. and Ghaffarian, R. (2000) ‘Challenges in interconnection and packaging of Microelectromechanical Systems (MEMS)’, Proceedings of the IEEE, pp.666–675. Rao, R.V. (2007) Decision Making in the Manufacturing Environment Using Graph Theory and Fuzzy Multiple Attribute Decision Making Methods, Springer-Verlag, London. Ren, L., Zhang, Y., Wang, Y. and Sun, Z. (2007) ‘Comparative analysis of a novel M-TOPSIS and TOPSIS’, Applied Mathematics Research eXpress, Vol. 2007, pp.1–10. Ren, Y., Jing, J., Wanjun, W. and Jin, M.W. (2005) ‘UV-LIGA fabrication of microscale two-level mold inserts for MEMS applications’, Proceedings of the SPIE, Vol. 5717, pp.175–184. Sasaki, M., Yuki, S. and Hane, K. (2006) ‘Large-rotation and low-voltage driving of micromirror realized by tense thin-film torsion bar’, IEEE Photonics Technology Letters, Vol. 18, pp.1573–1575. Satapathy, B.K. and Bijwe, J. (2004) ‘Wear data analysis of friction materials to investigate the simultaneous influence of operating parameters and compositions’, Wear, Vol. 256, pp.797–804.
Coding, evaluation, comparison, ranking and optimum selection
119
Schmidt, M.N. (1998) ‘Wafer-to-wafer bonding for microstructure formation’, Proceedings of the IEEE, Vol. 86, pp.1575–1585. Seo, K.S., Cho, Y.H. and Youn, S.K. (1996) ‘A bulk-micromachined micromirror for tunable optical switch applications’, Proceedings of the IEEE, Vol. 2, pp.404–407. Shih, H.S., Shyur, H.J. and Lee, E.S. (2007) ‘An extension of TOPSIS for group decision making’, Mathematical and Computer Modelling, Vol. 45, pp.801–813. Shin, J.W., Chung, S.W., Kim, Y.K. and Choi, B.K. (1997) ‘Design and fabrication of micromirror array supported by vertical springs’, Proceedings of the International Conference on Solid-State Sensors and Actuators, Chicago, 16–19 June, pp.201–204. Singh, J., Agrawal, A. and Soundarapandian, M. (2006) ‘A novel electrostatic micromirror for large deflection in MEMS applications’, Journal of Thin Solid Films, Vol. 504, pp.64–68. Tong, K.W., Kwong, C.K. and Ip, K.W. (2003) ‘Optimization of process conditions for the transfer molding of electronic packages’, Journal of Materials Processing Technology, Vol. 138, pp.361–365. Tung, Y.C. and Kurabayashi, K. (2005) ‘A metal-coated polymer micromirror for strain-driven high-speed multiaxis optical scanning’, IEEE Photonics Technology Letters, Vol. 17, pp.1193–1195. Velten, T., Ruf, H.H., Barrow, D., Aspragathos, N., Lazarou, P., Jung, E., Malek, C.K., Richter, M., Kruckow, J. and Wackerle, M. (2005) ‘Packaging of Bio-MEMS: strategies, technologies, and applications’, IEEE Trans. on Advanced Packaging, Vol. 28, pp.533–546. Venkatasamy, R. and Agrawal, V.P. (1994) ‘Coding, evaluation and selection of motor vehicles – a MADM approach’, Mobility and Vehicle Mechanics, Vol. 20, pp.22–41. Wang, B. (2004) ‘Considerations for MEMS packaging’, Proceedings of the Sixth IEEE Conference on High Density Microsystem Design and Packaging and Failure Analysis, pp.160–163. Wang, T.Y., Shaw, C.F. and Chen, Y.L. (2000) ‘Machine selection in flexible manufacturing cell: a fuzzy multiple attribute decision-making approach’, International Journal of Production Research, Vol. 38, pp.2079–2097. Yang, T. and Hung, C.C. (2007a) ‘Multiple-attribute decision making methods for plant layout design problem’, Robotics and Computer-Integrated Manufacturing, Vol. 23, pp.126–137. Yang, T., Chen, M.C. and Hung, C.C. (2007b) ‘Multiple attribute decision-making methods for the dynamic operator allocation problem’, Mathematics and Computers in Simulation, Vol. 73, pp.285–299. Yee, Y., Nam, H.J., Lee, S.H., Bu, J.U., Jeon, Y.S. and Cho, S.M. (2000) ‘PZT actuated micromirror for nano-tracking of laser beam for high-density optical data storage’, Proceedings of the 13th Annual International Conference on Micro Electro Mechanical Systems, Miyazaki, Japan, 23–27 January, pp.435–440. Yu, H. and Chen, H. (2006) ‘Development of a novel micromirror based on surface micromachining technology’, Journal of Sensors and Actuators A, Vol. 125, pp.458–462. Yufeng, Z., Xiaoyun, T., Weiping, C., Guowei, Z. and Xiaowei, L. (2005) ‘Study of MEMS packaging technology’, Proceedings of the Sixth Int. Conference on Electronic Packaging Technology, Shenzhen, China, 30 August–2 September, pp.1–4.