such as the New York Stock Exchange (Dow Jones Industrial Average, DJIA), the. Australian Stock Exchange (ASX) and the Tokyo Stock Exchange (Nikkei 225 ...
Asian Academy of Management Journal, Vol. 7, No. 2, 17–25, July 2002
COGNITIVE LEARNING OF INTELLIGENCE SYSTEMS USING NEURAL NETWORKS: EVIDENCE FROM THE AUSTRALIAN CAPITAL MARKETS Joachim Tan Edward Sek Wong Curtin University Australia
ABSTRACT Artificial neural networks (ANNs) allow users to improve forecasts through pattern recognition. The purpose of this paper is to validate ANNs as a detection tool in four financial markets. This study investigates whether market inefficiencies exist using ANN as a model. It also investigates whether additional publicly available information can provide investors with a trading advantage. In finance, any forecasting advantage obtained through the use of publicly available information albeit internal or/and external market factors suggest inefficiencies in the financial markets. In this paper, we explore the efficiency of the United States, Japan, Hong Kong and Australia. In Australia, using the ASX 200 index, we demonstrate how the inclusion of external information to our ANN improves our forecasting. Our results show accounting for external market signals significantly improves forecasts of the ASX200 index by an additional 10 percent. This suggests the inclusion of publicly available information from other markets, can improve predictions and returns for investors.
INTRODUCTION In finance, the essential issue is market efficiency. Any ability by investors to improve their returns by exploiting already publicly available information constitutes as market inefficiency (Walczak 1999). In an efficient market, when new information is released to the markets, the markets are expected to react to this information and reprice securities with this new information immediately. Hence, markets are always expected to reflect the 'true' values of securities. This implies there is no trading advantage, when publicly available information is used.1 It is therefore reasonable to expect global capital markets, such as the New York Stock Exchange (Dow Jones Industrial Average, DJIA), the Australian Stock Exchange (ASX) and the Tokyo Stock Exchange (Nikkei 225 average) to be efficient. The ability to forecast these markets using publicly available information would be inconsistent with market efficiency.
17
Joachim Tan and Edward Sek Wong
RESEARCH OBJECTIVES The purpose of this paper is to test whether market inefficiencies exist in the Australian market using artificial neural networks (ANNs) as a tool. Since ANNs are capable of predicting future values, ANNs can both simultaneously test whether market efficiency exists and if it doesn't, whether there are any trading rules that can be developed to exploit these inefficiencies. As many different rules exist, this study only focuses on whether the inclusion of additional external market indicators such as information from other markets can improve the forecast of the ASX 200 index.
LITERATURE REVIEW The Australian Stock Exchange The ASX is one of the largest exchanges with the largest volumes of daily trades in the southern hemisphere. Despite its relative size, several factors have been suggested to influence movements on the Australian stock exchange. Yoda (1994), in his study finds the Australian markets influenced by changes in anticipated production levels and interest rates of other markets such as the United States (US), Europe and Japan, which are more established. He finds that the U.S. market has the highest influence on the Australian market, as it is one of Australia's largest trading partners. Besides the influence of anticipated production levels from other countries, other studies have found additional influences on the Australian market. Kwok (1995), in his study finds index returns from larger financial markets such as the US, Hong Kong, London and Japan influence the returns generated on the Australia market. McGee (1997) finds this strong correlation holds even in extreme economic circumstances, when the global economy world faced the Asian Crisis in 1997. This suggests that the effects from other financial markets that might be co-integrated with Australia cannot be ignored. Yadav (1996) has also suggested that there could be some nonlinear dependence of daily stock returns for periods lasting one to five days. This suggests using ANNs with 1-day and 5-day lags as inputs may be appropriate for predicting market performance of periods lasting one to five days. It is well-established that the presence of inefficient behaviour do exist in financial markets by past studies.2 Other studies include Lo and MacKinlay (1988) using a variance ratio test.3 Artificial Neural Networks (ANNs) in Forecasting ANNs generally mimics the human brain's ability to classify patterns and make predictions or decisions based upon past experience using data sets (Specht and Shapiro 1991). This enables ANNs to be built into sophisticated problem solving applications without 18
Cognitive learning of intelligence systems
programming that are customizable (Burrascano 1991). Past studies have found ANNs to be very effective in forecasting individual stock and market indices, where there is a plethora of studies using ANNs in financial market research. Most studies have focused their attention on predicting the movements of more established markets such as the US, London, Hong Kong and Japan markets (Bosarge, 1993; Yoda, 1994; Tsibouris and Zeidenberg, 1995). However, there is hardly any work done on the Australian market. In addition, most studies focus solely on using internal market information for predicting future values. Internal market information is information that is only peculiar to a particular market. For example, if we focus on the US market, internal market information would be US trading volumes and 5-day averages of US index, data and statistics that are produced within its own borders. The internal market information list includes simple moving averages, trading volume and interest rates of markets of interest. According to Bosarge (1993) and Yoda (1994), solely focusing on these types of information studies yields only a predictive accuracy of 50 to 53 percent, or able to predict only half the time. In this study, we show that by accounting for additional external information produced by markets 'outside' of Australia, which has some influence on the Australian market, our predictive capability of the ASX 200 index can improve significantly. For the purpose of this study, the 50 percent prediction accuracy observed by other studies to be typical ANN forecasting accuracy is assumed to be an indication of efficient markets or random behaviour. Hence, any ability of our model to deviate from 50 percent would constitute market inefficiency and imply that certain trading rules which profit from the market, exists. According to Levich (1981), the 50 percent prediction accuracy is a reasonable measure of efficiency, when compared with human trading performance in the capital markets.
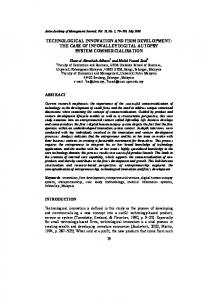
DATA AND METHODOLOGY In this study, the data is sourced from DataStream International where the daily closing values of the market indexes of four different markets; the ASX200, DJIA (Dow Jones Industrial Average), Nikkei 225 and Hang Seng index are sourced. The period chosen spans from January 3, 1999 through October 16, 2000. One-day, two-day and five-day simple returns for each index are calculated. This produced 206 one-day returns for each index. Figure 1 shows the ASX200 index value for the entire period. Other data sourced from DataStream include trade volume for the four markets. The simple averages are calculated from the closing index data obtained. These variables have been used by past studies as input variables for the ANN.
19
Joachim Tan and Edward Sek Wong
ASX200 3600 3400 3200 3000 2800 2600 1
13 25 37 49 61 73 85 97 109 121 133 145 157 169 181 193 205 217 Days since Jan.1, 2000
Figure 1. ASX200 Market Index Values, January 3, 2000–October 16, 2000
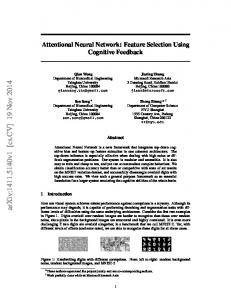
Our ANN Model In this study, we use a three-layered neural network with one hidden layer and a backpropagative feedback network for each input variable set. For this type of neural network, the decision nodes for each market are developed in three main stages. The first stage involves feeding inputs into the model to develop its predictive capability through the pattern recognition by its nodes (January 3, 1999 to December 30, 1999). The second stage, often known as the training stage (January 3, 2000 to June 30,, 2000) involves creating a back-propagative or feedback function into the neural network algorithm. In this stage, the ability data of the model is tested via predicting future values. In this stage, the predicted values are not produced as output to the user, instead it allows the algorithm to adjust for predictive errors encountered, increasing its accuracy in predicting future market index values. In the backward-propagation stage, the training data is vital as it improves the predictive capability by accounting for errors in the network's predictive process. The final stage (July 3, 2000 to October 15, 2000) on which our results are based predicts future five day values that were not done in the earlier two stages. For each financial market the inputs of one-day, two-day, and five-day lags of closing index values, along with the corresponding one-day, two-day, and five-day average trading volumes are calculated for each respective market. In this study, the focus is on the performance of our neural network in predicting the index values of the four financial markets; (1) ASX200, (2) DJIA, (3) Nikkei 225 and (4) Hang Seng.
20
Cognitive learning of intelligence systems
Input layer
ASX200, 1 day lag
Hidden Layer Output layer
ASX200, 2 day lag ASX200, 5 day lag
ASX200 5-day Future
ASX200, 1 day vol ASX200, 2 day avg.vol ASX200, 5 day avg.vol
Figure 2. Our neural network for forecasting ASX200 five-day future values Jan 3, 1999 to Dec 30 1999
Jan 3, 2000 to Jun 30 2000
July 3, 2000 to Oct 15 2000
Input
Training Data
Predictions
Figure 3. Timeline of data used for each market for forecasting five-day future values Our results are conducted in two different stages using the nonparametric runs test. This test compares the frequency of a run (two consecutive periods of financial data moving in the same direction) with the frequency of instances, when periods do not move in the same direction. This test basically suggests that the data tested should be random and hence half (50%) of the observations should occur in runs and the other half shouldn't (Urrutia 1995). To evaluate the ANN's performance we report the average forecast of the predictor across the 206 observations, its p-values for each of the four markets. This statistic is calculated by multiplying the value of 1-MAE (Mean Absolute Error) by 100, where the error is 0 if the correct direction of change is predicted and 1 if not predicted. For each market, the null hypothesis of 50 percent prediction accuracy is assumed based on the review of past studies. The p-value indicates the confidence of rejecting the hypothesis of a 50 percent predictive capability.
RESULTS In the first stage, our neural network model's ability is evaluated using only internal data for each financial market. The second stage focuses on investigating whether adding external data from other markets as input can improve our model's predictive capability.
21
Joachim Tan and Edward Sek Wong
Stage One TABLE 1 SINGLE INTRAMARKET INDEX SET NEURAL NETWORK MODEL Market Index ASX200 DJIA Nikkei Hang Seng
Nonparametric runs prediction accuracy 49.81 56.87 47.29 54.97
p-value (confidence level) 0.082** 0.069 0.956 0.102*
* indicates significant at the 0.10 level ** indicates significant at the 0.05 level
From Table 1, we can see that at a 0.10 confidence level, it is sufficient to reject our hypothesis for both the ASX200 and Hang Seng market index. At the higher 0.05 confidence level, the null hypothesis can only be rejected for the ASX200 market index. This suggests that there may be the presence of a non-random market behaviour and can provide a significant trading advantage to investors. Having identified the potential for the Australian market to be inefficient, we next focus on evaluating whether the use of information from different markets effects can improve our forecasts. Stage Two Focusing only on the Australian market, six different sets of variables are implemented in our neural network model to investigate the inclusion of external signals in the potentially inefficient market of Australia. The various combinations of external impacts are used to determine the effects of specific signals to the Australian markets. Prediction accuracy results for the single hidden layer networks are displayed in Table 2. TABLE 2 NEURAL NETWORKS TO PREDICT ASX200 FIVE-DAY FUTURES Indexes ASX200 ASX200 and Hang Seng ASX200 and Nikkei ASX200 and DJIA ASX200, Hang Seng, Nikkei and DJIA
Prediction accuracy 49.81 51.79 52.59 54.27 59.57
p-value 0.082 0.366** 0.219** 0.1841** 0.003**
** indicates significant at the 0.05 level
From our results in Table 2, we find that when additional external signals, which are publicly available information, are taken into account, our nonlinear neural network model 22
Cognitive learning of intelligence systems
predictive performance improves from 49.71% to 59.57%. Our results suggest that external publicly available signals when used as inputs can be used to predict the market more reliably; this indicates some inefficiency in the Australian market.
CONCLUSION Neural networks provide a tool for evaluating the presence of an inefficient market and exploiting that inefficiency. In this study, it is shown that neural networks can evaluate inefficiencies in the Australian capital market. It is also able to predict future values of the market quite reliably. Our results show that the Australian capital market might appear to be as efficient as the Hang Seng, Nikkei 225 and DJIA when using only internal market information. It is inefficient when external market information is used. This suggests there may be hidden investment rules that apply to the Australian market that allow traders to 'circumvent the market' and make positive abnormal profits in the process. In our study, we have shown that external market information could be the key to developing these strategies. Although our results indicate inefficiencies in the ASX 200 index, it must be noted that our results are limited to using a simple neural network as a predictive tool. The neural network used here was simple tri-layered with one hidden layer back-propagative network for each input variable. The use of this single hidden layer back-propagative network was assumed to be sufficient to validate the nonlinear function. Although our approach is geared towards showing ANNs as intelligent decision aids for determining the efficiency of the ASX 200 index, it is noted that ANNs can be used for other purposes. Further work may be conducted by re-investigating our results using a more complex layer or identifying the optimal neural network architecture for use in forecasting. If trading advantages do exist in other equity markets, ANNs are certainly the tools that can aid investors in identifying investment strategies to capitalise on any potential market inefficiencies.
REFERENCES Bosarge, W. E. (1993). Adaptive Processes to Exploit the Nonlinear Structure of Financial Market. In: R. R. Trippi and E. Turban (eds.). Neural Networks in Finance and Investing. Probus Publishing: 371–402.
23
Joachim Tan and Edward Sek Wong
Burrascano, P. (1991). Learning Vector Quantization for the Probabilistic Neural Network. Proceedings of the IEEE International Conference on Neural Networks, 2 (July): 458–461. Kwok, R. H. F. (1995). Market Integration in the Four Newly Industrialised Economies of Asia. Advances in Pacific Basin Financial Markets 1: 199–209. Levich, R. and L. R. Thomas (1993). The Significance of Technical Trading-Rule Profits in the Foreign Exchange Market: A Bootstrap Approach. Journal of International Money and Finance 12: 451–474. Lo, A. W. and MacKinlay, A. C. (1988). Stock Market Prices Do Not Follow Random Walks: Evidence from a Simple Specification Test. Review of Financial Studies 1: 41–66. Specht, D. and Shapiro, P. (1991). Generalization Accuracy of Probabilistic Neural Networks Compared with Back-Propagation Networks. Proceedings of the International Joint Conference on Neural Networks 1 (July 8–1): 887–892. Steven Walczak (1999). Quality of Neural Network Financial Models as a Function of Time. Decision Sciences Institute 5th International Conference Proceedings: 537–539. Steven Walczak (2001). An Empirical Analysis of Data Requirements for Financial Forecasting with Neural Networks. Journal of Management Information Systems 17 (4): 203–222. Tsibouris, G. and Zeidenberg, M. (1995). Testing the Efficent Markets Hypothesis with Gradient Descent Algorithms. In: A. P. Refenes (ed.), Neural Networks in the Capital Markets. Chapter 8: 127–136. Chichester, England: John Wiley & Sons. Urrutia, J. L. (1995). Tests of Random Walk and Market Efficiency for Latin American Emerging Equity Markets. Journal of Financial Research 18 (3) (Fall 1995): 299– 309. Yadav, P. K., Paudyal, K. and Pope, P. F. (1996). Non-linear Dependence in Daily Stock Returns: Evidence from Pacific Basin Markets. Advances in Pacific Basin Financial Markets 2 (Part B): 349–377. Yoda, M. (1994). Predicting the Tokyo Stock Market. In: G. J. Deboeck (ed.). Trading on the Edge: Neural, Genetic, and Fuzzy Systems for Chaotic Financial Markets. New York: Wiley: 66–79.
24
Cognitive learning of intelligence systems
ENDNOTES 1
2
3
In finance, this is known as the semi-strong form efficiency of financial markets. See Bosarge 1993, Yoda 1994 and Tsibouris and Zeidenberg 1995 for some evidence. The variance ratio test is also performed in the markets by the authors, but not reported. For these results please contact the authors.
25