In computer vision, the object recognition area has experi- enced significant progress .... The ith true positive region TPi and the ith false positive region FPi are ...
The 2009 IEEE/RSJ International Conference on Intelligent Robots and Systems October 11-15, 2009 St. Louis, USA
Cognitive Vision for Efficient Scene Processing and Object Categorization in Highly Cluttered Environments Changhyun Choi and Henrik I. Christensen Robotics & Intelligent Machines, College of Computing Georgia Institute of Technology Atlanta, GA 30332, USA {cchoi,hic}@cc.gatech.edu
Abstract— One of the key competencies required in modern robots is finding objects in complex environments. For the last decade, significant progress in computer vision and machine learning literatures has increased the recognition performance of well localized objects. However, the performance of these techniques is still far from human performance, especially in cluttered environments. We believe that the performance gap between robots and humans is due in part to humans’ use of an attention system. According to cognitive psychology, the human visual system uses two stages of visual processing to interpret visual input. The first stage is a pre-attentive process perceiving scenes fast and coarsely to select potentially interesting regions. The second stage is a more complex process analyzing the regions hypothesized in the previous stage. These two stages play an important role in enabling efficient use of the limited cognitive resources available. Inspired by this biological fact, we propose a visual attentional object categorization approach for robots that enables object recognition in real environments under a critical time limitation. We quantitatively evaluate the performance for recognition of objects in highly cluttered scenes without significant loss of detection rates across several experimental settings.
I. I NTRODUCTION In computer vision, the object recognition area has experienced significant progress over the last decade. But most of the object recognition systems still require uncluttered scenes or enough resolution of images. It is still hard to recognize objects in extreme situations, such as highly cluttered scenes or too small objects in images. In this paper, we propose an object recognition approach that can handle some of these situations efficiently and robustly. As a first step to understand scenes in a complex world, we need a mechanism to hypothesize important regions. Treisman [1] proposed a theory for object recognition composed of two stages inspired by human visual search strategies. According to the theory, when humans do visual search, in the first stage they select highly salient regions by integrating multiple features, such as shapes, colors, lines, and curves. In the second stage they carefully identify objects within the salient regions. Unfortunately, within the vision community these two stages have been developed separately, and there have been few attempts to combine them. A. Visual Attention Itti and Koch [2] proposed a model of saliency-based visual attention based on Treisman’s feature-integration the-
978-1-4244-3804-4/09/$25.00 ©2009 IEEE
(a) Bottle
(b) Can
(c) Mug
(d) Paper cup
Fig. 1: Example images from four target object classes obtained from the LabelMe dataset [5]. The labels are depicted on the images. Each object is in a complex environment and the size of each object is very small.
ory [1]. The bottom-up visual attention model automatically identifies highly salient regions based on color, intensity, and orientation stimuli. Recently, Hou and Zhang [3] proposed a Spectral Residual (SR) approach for fast saliency detection. In this approach, salient regions are selected from spectral residual, which is the difference between the log spectrum and the smoothed log spectrum of an image. Since the approach relies on the Fourier Transform and the Inverse Fourier Transform, it can detect salient regions efficiently, and demonstrates better detection performance than the Itti’s model. Wang and Li [4] enhanced the SR approach by using a two-stage approach, but this approach is still limited to the bottom-up saliency detection. B. Object Categorization Recent work in cognitive science [6] and neuroscience [7] suggest that if salient regions are determined by attention, more detailed visual information of the regions is processed through eye movements, so-called “saccades”. The fovea
4267
4268
4269
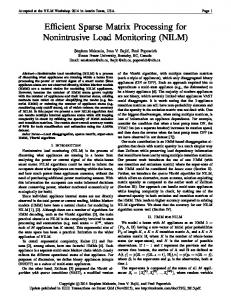
Fig. 5: Visual memory is composed of local stumps (image patch on the left) and spatial masks (on the right). Only five features are depicted per target object classes. (from top to bottom) bottle, can, mug, and paper cup.
saliency map, SI , SRG , and SBY , and we get a bottom-up saliency map Sbu : 1 (N (SI ) + N (SRG ) + N (SBY )) (11) 3 To obtain pop-out image regions that are more likely to contain the objects we seek, the bottom-up saliency Sbu is combined with an object likelihood model L: Sbu =
S = Sbu ⊗ L
(12)
where ⊗ is the element-wise multiplication. The reason why we use the object likelihood is that the position of objects has some spatial constraints. For instance, mug – one of our target object classes – is likely to be placed in the middle of images because it is usually located on the table or next to a sink. Of course, this likelihood can be adjusted with respect to robots’ viewpoint (tilt), although we leave this enhancement to future work. The generation of an object likelihood model is explained in Fig. 3. Fig. 4 shows the object likelihood models used in this paper. Note that although each likelihood is slightly different, the overall shapes are very close because these objects share similar possible locations, such as tables and desks. A simple way to obtain pop-out images from the saliency map S is through thresholding. Threshold values were determined experimentally. In addition, we also explored the empirical number of pop-out images through experiments. The experiments will be discussed further in section IV-A. III. T HE S ECOND S TAGE : O BJECT C ATEGORIZATION WITH BOOSTING
Once pop-out images are obtained from a saliency map, our approach then executes a recognition algorithm on these images. For this, we use a gentle-boost classifier with local stumps and their spatial masks [14].
object classes: bottle, can, mug, and paper cup. Note that the objects are in highly cluttered scenes and the proportion of each object in the images is relatively small. In some images it is even hard for a human to find the target objects. During the training phase, local patches and their spatial information are saved into visual memory which will be used during the detection phase (Fig. 5). B. Boosting on pop-out images The usual way to detect objects with a boosting classifier is through sliding of different sized windows across an image. Such a brute-force strategy is not very efficient. Since in real scenes there are many uniform regions, applying boosting only to highly salient regions, which are probable regions having target objects, is a better strategy, and it is computationally efficient. The overall procedure including the first stage is systematically represented in Fig. 2. In section IV-B, we show that our approach scanning only popout images can significantly save computing time. IV. E XPERIMENTS AND EVALUATIONS In this section we document the performance of our approach. In section IV-A, we compare the detection rates of SR, SRC, and SRC+LH (SRC with object likelihood), and we show that our SRC+LH method has better performance. Similarly, we quantify the performance of boosting with and without visual attention by comparing both the recognition result and the computation times in section IV-B. As we mentioned in section III-A, we gathered a dataset by searching for the four target objects in the LabelMe [5] dataset. A. Evaluating Saliency Detection Initially ith pop-out images P Oi are acquired by thresholding of the ith saliency map Si by (13): � 1 if Si > τpu P Oi = (13) 0 otherwise Similarly, the ith positive region Pi can be determined by referring to the label data (14), and the ith negative region Ni is simply the positive region’s complement (15): � 1 if it is labeled area Pi = (14) 0 otherwise Ni = Pi
The ith true positive region T Pi and the ith false positive region F Pi are obtained by (16) and (17):
A. Training data and target object classes For tuning of the boosting classifier there is a need to have a training set. Data with four different object classes were selected. The images used contain objects that are frequently encountered in our daily lives. The objects were partly selected to be difficult to detect with standard descriptor based methods. Finally, it was desirable to have data that can be obtained from the LabelMe dataset [5]. Fig. 1 represents some selected images among the dataset of the four target
(15)
T Pi = P Oi ∩ Pi
(16)
F Pi = P Oi ∩ Ni
(17)
Finally, the total true positive rate T P R and the total false positive rate F P R over a set of a target object class are calculated as follows:
4270
TPR =
K X T Pi i=1
Pi
(18)
0.20.1 0.3
1
0.4
0.6 0.20.7 0.8 0.9
SR SRC SRC+LH 0.2
0.4 0.6 0.8 False Positive Rate
0.8 0.4
0.60.5 0.6 0.4 0.7
0.9 01 0
SR SRC SRC+LH 0.2
(a) Bottle
0
1
0.1
0.20.8
1
0
1
0.8
0.40.5
01 0
0
True Positive Rate
0.6
True Positive Rate
True Positive Rate
0.1 0.2 0.8 0.3
0.4 0.6 0.8 False Positive Rate
0.6 0.3 0.4 0.4 0.5 0.20.6 0.7 0.8 0.9 01 0
1
0.1
0.8 0.2
True Positive Rate
0
1
(b) Can
0.4 0.6 0.8 False Positive Rate
0.4
0.4
0.5 0.20.6 0.7
SR SRC SRC+LH 0.2
0.2
0.6 0.3
0.8 1 00.9 0
1
(c) Mug
SR SRC SRC+LH 0.2
0.4 0.6 0.8 False Positive Rate
1
(d) Paper cup
1
1
0.8
0.8
0.8
0.8
0.6
0.4
1 3 5
0.2
0
0
0.2
0.4 0.6 0.8 False Positive Rate
0.6
0.4
1 3 5
0.2
0
1
0
0.2
(a) Bottle
0.4 0.6 0.8 False Positive Rate
True Positive Rate
1
True Positive Rate
1
True Positive Rate
True Positive Rate
Fig. 6: ROC curves of SR, SRC, and SRC+LH by varying the threshold, τpu , from 0 to 1. The values of τpu are depicted on SRC+LH curves. SRC+LH outperforms the other two methods. This ROC curves shows that best threshold value τpu is between 0.1 and 0.3.
0.6
0.4
1 3 5
0.2
0
1
0
0.2
(b) Can
0.4 0.6 0.8 False Positive Rate
0.6
0.4
1 3 5
0.2
0
1
0
(c) Mug
0.2
0.4 0.6 0.8 False Positive Rate
1
(d) Paper cup
Fig. 7: ROC curves of SRC+LH by varying the number of pop-out image regions, τn , from 1 to 5. Note that 3 and 5 are nearly the same and 1 shows good performance as well. This implies that the first pop-out image is highly likely to contain target objects, and fourth or fifth pop-out images are less likely to have the target objects.
0.6
Precision
Precision
0.8
0.4
0.2
0
1
0.8
0.8
0.6
0.6
0.4 Whole SRC+LH 0.1 SRC+LH 0.2 SRC+LH 0.3
0.2
0
0.2
0.4 0.6 Recall
0.8
1
(a) Bottle
0
0
0.2
0.4 0.6 Recall
1 Whole SRC+LH 0.1 SRC+LH 0.2 SRC+LH 0.3
0.8
Precision
1 Whole SRC+LH 0.1 SRC+LH 0.2 SRC+LH 0.3
Precision
1
0.4
0.2
0.8
0
1
(b) Can
0.6
0.4 Whole SRC+LH 0.1 SRC+LH 0.2 SRC+LH 0.3
0.2
0
0.2
0.4 0.6 Recall
(c) Mug
0.8
1
0
0
0.2
0.4 0.6 Recall
0.8
1
(d) Paper cup
Fig. 8: Precision-recall graphs for the four tests. The brute force search strategy (Whole) represents very low precision because of many more false positives. Our approaches (SRC+LH where τpu = 0.1, 0.2, and 0.3) show much better precision without significant loss of recall.
FPR =
K X F Pi i=1
Ni
(19)
where K is the number of images of the target object’s dataset. With these criteria, the ROC curves of the four target object classes are obtained by varying τpu from 0 to 1 as shown in Fig. 6. According to the ROC curves the SRC+LH method is superior to the SR or SRC applied on their own. The threshold value τpu shows the best performance around 0.2, but varies slightly depending on target objects. In addition to varying τpu , we also investigated the effect of the number of pop-out images, τn . The ROC curves of SRC+LH with respect to the τn are depicted in Fig. 7 by varying τn from 1 to 5. Following winner-take-all and
inhibition of return [2], we selected pop-out images in order of peak values. In Fig. 7 the detection rates generally converge when τn = 3. Considering that the detection rates in τn = 1 are high enough, we can guess that the first popout image is highly likely to have the target object. B. Evaluating Object Categorization with and without Visual Attention In this section, for verifying the advantages of using visual attention, we present an experiment with boosting applied to the original images and pop-out images generated by our visual attention model. Since the size of each image varies, we first resize every image to 1024 × 768 pixels, and for scale invariance we build up pyramidal images across
4271
4272
Execution Times (sec)
Execution Times per Image 200 150 100
Whole SRC+LH 0.1 SRC+LH 0.2 SRC+LH 0.3
50 0
Bottle
Can
Mug Paper Cup Target Object Classes
Fig. 10: Average execution times of each strategy. Our SRC+LH strategies outperform the whole detection strategy in computing times. The error bars represent the standard deviation of execution times. TABLE I: F1 -measure for objects detected. Our SRC+LH strategies show higher scores than the whole detection strategy. Whole SRC+LH 0.1 SRC+LH 0.2 SRC+LH 0.3
Bottle 0.3556 0.4828 0.4000 0.4444
Can 0.3404 0.6400 0.6087 0.4762
Mug 0.1507 0.3014 0.4255 0.4118
Paper cup 0.4348 0.5806 0.6087 0.6000
five scales in which the scale step is 0.7. Fig. 9 shows representative boosting results of bottle, can, mug, and paper cup. To count the detection across five scales of an image, we merge the detection regions into one image. We compare results through merging of regions. In the image, when there are more than two areas in a merged region, a comparison is performed. If the merged area is the label area which contains the target object region, it is regarded as a true positive, and if the merged area has less than 50% overlap with the target region, it is regarded as a false positive. In the false positive case, if the merged area is composed of two or more areas across scales, we count the maximum number of false positive areas for each scale. By following these criteria, we plot precision-recall graphs in Fig. 8. According to the plots, the precision increases as τpu increases, while the recall varies significantly less. The F1 -measure for the detection results is shown in Table I. These results show that our visual attention model SRC+LH performs better than the complete detection strategy. The advantages from visual attention are not only in terms of fewer false positives, but also in terms of computational benefit. The application of a saliency detector reduces the need for search which in turn reduces complexity. Fig. 10 shows the execution times for our approach. In SRC+LH strategies, the computation times of saliency detection with object likelihood are included in the average execution times, but since our attentional model is efficient enough, the additional cost is negligible. As τpu increases, the size and the number of pop-out images decrease, hence the execution times decrease significantly.
V. C ONCLUSIONS AND D ISCUSSIONS Inspired by the two-stage framework from cognitive psychology, we proposed an object class recognition approach using bottom-up visual priming, top-down object likelihood, and a boosting object classifier. Our SRC+LH approach detects more accurate pop-out images than the original SR approach. We also showed that a gentle boosting classifier with visual attention promises better precision as well as more efficient computations. We believe that our combined approach will be an alternative to previous descriptor-based recognition schemes to detect objects in extreme situations. We anticipate that our approach will be useful in robotic applications, especially, in the service robotics area which requires robust object categorization in highly cluttered environments under some time constraints. Here our approach can provide an efficient and accurate object class recognition solution. When our approach is applied in robotic applications, we expect that the recently proposed spatio-temporal saliency detection [25] will help robots perceive an additional saliency channel, motion saliency, which has been ignored for a long time even though it is very important in human perception [26], [27], [28]. Although we tried to minimize false positives by only focusing on pop-out regions, we think that there is more room to enhance the recognition rates. As Torralba et al. [15] indicated, the global scene based context will play an important role as a top-down guidance for adjusting the object likelihood. With the place context we should also consider the camera tilt information of robots in order to obtain a more accurate saliency map. In addition, if we use additional prior knowledge of target objects, such as maps and objects’ positions in them obtained from SLAM (Simultaneous Localization And Mapping) which is a major robotics area, we could expect more robust recognition through probabilistic inference. Last but not least, even though we do not currently adopt the joint boosting proposed by Torralba et al. [14], if we try to share local stumps across object classes, we could anticipate not only better recognition performance, but also attain a solution for scalable issue as object’s classes increase.
4273
VI. ACKNOWLEDGMENTS The authors would like to thank Dr. James M. Rehg for fruitful discussions, and acknowledge anonymous reviewers’ helpful comments. R EFERENCES [1] A. M. Treisman and G. Gelade, “A feature-integration theory of attention.” Cognit Psychol, vol. 12, no. 1, pp. 97–136, January 1980. [2] L. Itti, C. Koch, and E. Niebur, “A model of saliency-based visual attention for rapid scene analysis,” IEEE Transactions on Pattern Analysis and Machine Intelligence, vol. 20, no. 11, pp. 1254–1259, 1998. [3] X. Hou and L. Zhang, “Saliency detection: A spectral residual approach,” Proc. CVPR, 2007, pp. 1–8, June 2007. [4] Z. Wang and B. Li, “A two-stage approach to saliency detection in images,” Acoustics, Speech and Signal Processing, 2008. ICASSP 2008. IEEE International Conference on, pp. 965–968, 31 2008-April 4 2008. [5] B. C. Russell, A. Torralba, K. P. Murphy, and W. T. Freeman, “Labelme: a database and web-based tool for image annotation,” International Journal of Computer Vision, vol. 77, no. 1-3, pp. 157– 173, 2008. [6] D. Melcher, “Selective attention and the active remapping of object features in trans-saccadic perception,” Vision Research, vol. In Press, Corrected Proof, pp. –, 2008. [7] E. I. Knudsen, “Fundamental components of attention.” Annu Rev Neurosci, April 2007. [8] P. Viola and M. J. Jones, “Robust real-time face detection,” International Journal of Computer Vision, vol. 57, no. 2, pp. 137–154, 2004. [9] C. Papageorgiou and T. Poggio, “A trainable system for object detection,” Int. J. Comput. Vision, vol. 38, no. 1, pp. 15–33, 2000. [10] L. Fei-Fei and P. Perona, “A bayesian hierarchical model for learning natural scene categories,” Proc. CVPR, 2005, vol. 2, 2005. [11] J. Sivic, B. C. Russell, A. A. Efros, A. Zisserman, and W. T. Freeman, “Discovering object categories in image collections,” Proceedings of the IEEE International Conference on Computer Vision (ICCV), 2005. [12] P. F. Felzenszwalb and D. P. Huttenlocher, “Pictorial structures for object recognition,” Int. J. Comput. Vision, vol. 61, no. 1, pp. 55–79, 2005. [13] J. Friedman, T. Hastie, and R. Tibshirani, “Additive logistic regression: a statistical view of boosting,” Annals of Statistics, vol. 28, p. 2000, 2000. [14] A. Torralba, K. P. Murphy, and W. T. Freeman, “Sharing features: efficient boosting procedures for multiclass object detection,” Proc. CVPR, 2004, vol. 2, pp. II–762–II–769 Vol.2, June-2 July 2004. [15] A. Torralba, A. Oliva, M. S. Castelhano, and J. M. Henderson, “Contextual guidance of eye movements and attention in real-world scenes: the role of global features in object search.” Psychological Review, vol. 113, no. 4, pp. 766–786, October 2006. [16] S. Frintrop, A. Nuchter, H. Surmann, and J. Hertzberg, “Saliencybased object recognition in 3D data,” in Intelligent Robots and Systems, 2004. (IROS 2004). Proceedings. 2004 IEEE/RSJ International Conference on, vol. 3, 2004, pp. 2167–2172 vol.3. [17] J. Vogel and N. de Freitas, “Target-directed attention: Sequential decision-making for gaze planning,” in Robotics and Automation, 2008. ICRA 2008. IEEE International Conference on, 2008, pp. 2372– 2379. [18] S. Gould, J. Arfvidsson, A. Kaehler, B. Sapp, M. Meissner, G. Bradski, P. Baumstarck, S. Chung, and A. Y. Ng, “Peripheral-foveal vision for real-time object recognition and tracking in video,” in International Joint Conference on Artificial Intelligence (IJCAI), 2007. [19] D. Meger, P. Forssn, K. Lai, S. Helmer, S. McCann, T. Southey, M. Baumann, J. J. Little, and D. G. Lowe, “Curious george: An attentive semantic robot,” Robotics and Autonomous Systems, vol. 56, no. 6, pp. 503–511, June 2008. [20] P. Forssen, D. Meger, K. Lai, S. Helmer, J. Little, and D. Lowe, “Informed visual search: Combining attention and object recognition,” in Robotics and Automation, 2008. ICRA 2008. IEEE International Conference on, 2008, pp. 935–942. [21] D. Walther, L. Itti, M. Riesenhuber, T. Poggio, and C. Koch, “Attentional selection for object recognition - a gentle way,” Lecture Notes in Computer Science, vol. 2525, no. 1, pp. 472–479, 2002.
[22] D. Walther and C. Koch, “Modeling attention to salient proto-objects,” Neural Networks, vol. 19, no. 9, pp. 1395–1407, 2006. [23] D. Walther, U. Rutishauser, C. Koch, and P. Perona, “On the usefulness of attention for object recognition,” Workshop on Attention and Performance in Computational Vision at ECCV, pp. 96–103, 2004. [24] D. G. Lowe, “Distinctive image features from scale-invariant keypoints,” Int. J. Comput. Vision, vol. 60, no. 2, pp. 91–110, 2004. [25] C. Guo, Q. Ma, and L. Zhang, “Spatio-temporal saliency detection using phase spectrum of quaternion fourier transform,” Proc. CVPR, 2008, pp. 1–8, June 2008. [26] A. Correa, D. Sanabria, C. Spence, P. Tudela, and J. Lupianez, “Selective temporal attention enhances the temporal resolution of visual perception: Evidence from a temporal order judgment task,” Brain Research, vol. 1070, no. 1, pp. 202 – 205, 2006. [27] P. Fraisse, “The psychology of time,” Greenwood Press,Westport, CT, 1963. [28] C. Koch and S. Ullman, “Shifts in selective visual attention: Towards the underlying neural circuitry,” Human Neurobiology, vol. 4, pp. 219– 227, January 1985.
4274