Cohesion and Coupling Metrics for Workflow Process Design Hajo A. Reijers and Irene T.P. Vanderfeesten Department of Technology Management, Eindhoven University of Technology, PO Box 513, NL-5600 MB Eindhoven, The Netherlands
[email protected],
[email protected]
Abstract. Workflow designers experience considerable freedom in designing the smaller steps (or activities) within a process. An operational notion of activity cohesion and coupling may help them to design more well-structured workflow activities. Inspired by resemblances between software programs and workflow processes, this paper gives an overview of software quality metrics and their applicability to workflow process design. New cohesion and coupling metrics – inspired by these software metrics – are introduced, which are integrated in a design heuristic. This heuristic can be used by workflow designers to identify the strongly cohesive and weakly coupled process design among several alternatives. The paper includes an application of this heuristic in a realistic workflow process setting.
1
Introduction
Administrative business processes are considerably more flexible in their lay-out than manufacturing processes, because their focus is on the processing of information instead of physical parts (see e.g. [14]). While this may be exploited to improve the performance of administrative business processes (see e.g. [2]), it may be difficult to cope with this freedom in other respects. One issue is the proper size of the individual activities in a process (the process granularity). Badly chosen boundaries between activities may affect process performance negatively. For example, small activities increase the number of hand-offs between activities, with a corresponding increase of errors ([19]). On the other hand, activities that are too large may cause inflexibility, since their underlying operations must be performed regardless of their merits under specific circumstances ([2]). This paper addresses the issue of activity design in administrative processes, or workflow processes, using cohesion and coupling metrics. By focusing on the content of an activity, i.e. its underlying operations, it can be quantitatively expressed how these operations "belong" to each other within one activity or, in other words, how cohesive such an activity is. In addition, it is also important to what extent the activities are independent from each other or, conversely, how much they are coupled. The inspiration for these metrics comes from software engineering, where an old aphorism is to strive for "strong cohesion, loose coupling". Baresi et al. already J. Desel, B. Pernici, and M. Weske (Eds.): BPM 2004, LNCS 3080, pp. 290–305, 2004. © Springer-Verlag Berlin Heidelberg 2004
Cohesion and Coupling Metrics for Workflow Process Design
291
suggested applying this principle to workflow process design ([6]). Moreover, this application seems justified by the fact that workflow processes are quite similar to software programs in some respects: • They both focus on information processing. Within each step, one or more outputs are produced on the basis of one or more inputs. • They are alike in their structure of components. Workflow processes and software programs have a similar compositional structure. A program – functional or objectoriented – can be split up into respectively modules or classes. Every module consists of a number of statements, and every statement has a number of variables and constants. Likewise, a workflow process has activities. Every activity is built out of a number of elementary operations and each operation uses one or more information elements. • Their dynamic execution follows a static structure. In instantiating either a software program or a workflow process, an execution flow of their elements takes place in accordance with their static representation. This flow may involve consecutive executions, concurrency, conditional routings, etc. Although the metrics in software engineering try to give an indication of the overall quality of a program design, we aim for a more modest goal with respect to workflow process design. Clearly, an overall quality concept of a workflow design must encompass elements such as implementability and its effect on customer satisfaction. We will, however, focus on a particular part, i.e. the execution of a workflow process design. Similar to the advantages of a well-designed software program (see [9]), we think that a workflow process that consists of loosely coupled activities will experience fewer errors during runtime, because less communication and exchange of information is needed. The execution of cohesive activities will result in higher quality, because each of them is a coherent part. From an organizational perspective, it should become clearer what it is that needs to be done and who or which department is responsible for it. Several researchers already indicated that intra-organizational dependencies and shared responsibilities should be avoided in workflow (re)design (see for example [7] and [18]). Besides these high-level advantages, we also expect that employees who work within a well-designed process on well designed activities may like their work more and can work more efficiently. In a previous paper ([17]), we compared the application of a simple workflow quality metric to various design dilemma's with the decisions of 14 experienced workflow designers. The outcomes matched, supporting the validity of the metric and the viability of the underlying idea. This metric, however, lacked facilities to handle conditional alternatives to achieve the same output (XOR-construction), a construct very common in business processes and in administrative processes in particular ([5]). Neither could we balance this quantitative notion of cohesion with a similar notion of coupling, a more or less natural span. Finally, we did not extensively study whether existing metrics in the software engineering domain could be applied in workflow design. These three issues are addressed in this paper, resulting in an extended workflow cohesion metric and the addition of a workflow coupling metric, inspired by thorough research of quality metrics from software engineering literature.
292
H.A. Reijers and I.T.P. Vanderfeesten
The structure of this paper is as follows. First, we will introduce a new way of looking at a workflow process, considering a structure of information processing underneath the workflow model. We will introduce a realistic example and explain the new concepts using this example. Following is a short overview of important literature on software engineering metrics, the formal introduction of our cohesion and coupling metrics and an application within a realistic workflow setting. The paper ends with a discussion of the limitations of the presented approach and directions for further research.
2
An Input-Output Perspective on Workflow Processes
As we stated in the introduction, workflow processes process information. In this paper, we will consider the smallest, meaningfully distinguishable portions of information that are being processed and refer to them as information elements. Examples of information elements are given in Table 1. A number of information elements is needed as input to the process. Subsequently, in the activities of the process these information elements are used to produce new information elements and, in the end, the workflow's output is produced, usually in the form of a single information element. An activity in a workflow process consists of a number of operations on information elements. Each operation has one or more input information elements and one output information element. An operation is a basic processing step and cannot have “half-assembly” products, i.e. intermediate information element values, itself. An activity, on the contrary, is built out of one or more operations. The output of one of the operations can be the input of another operation of that activity. Therefore the activity can have “half-assembly” products. The issue we raised of defining activities can now be reformulated as the proper clustering of information elements and operations into activities. Or from another point of view: the proper distribution of operations across a workflow’s activities. This information input-output perspective on workflow processes we adopt here is similar to that of the methodology of product based workflow design (PBWD) [1, 15, 16]. Also, some contemporary Workflow Management Systems adopt a comparable information-centered modeling and execution approach (see e.g. [3]). As a running example for the application of our cohesion and coupling metrics and as an illustration for the concepts we introduced, we will present here both a workflow process model and a so-called information element structure. The latter model expresses the formal dependencies between the various information elements. Both models deal with the way how requests for governmental student grants are handled in the Netherlands. The presented workflow is a simplified version of the actual procedure as implemented by the Informatie Beheer Groep (IBG) under the authority of the Ministry of Education, Culture and Science. The essential output of the workflow process is the calculation of the scholarship a new student will get from the government. The amount of money is dependent on the student’s background, his parents income, his living situation, the type of health insurance and the kind of study grant he applied for. The total amount of student grant is composed of three parts (the
Cohesion and Coupling Metrics for Workflow Process Design
293
amount of basic scholarship, the amount of supplementary scholarship and the loan amount). 27
24
26 value(19)="no"
25
18
19
value(12) ="yes"
20
value(16) = "yes"
value(16)="no"
21
16
17
15
value(12) ="yes"
9
14
12
10
4
23
22
value(12)= "yes"
8
13
value(19) = "yes"
value(12) ="no"
6
7
5
11
3
1
2
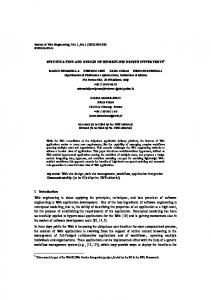
Fig. 1. Information element structure for the process “Request for governmental student grant”.
In Figure 1, the complete information element structure for this calculation can be found. Information elements are represented as circles, operations as one or more arrows between information elements. The individual information elements are described in Table 1. Now, as an example, we will focus on the part which calculates the parents’ income, to understand the concept of information elements, operations and activities. The total income of both parents (information element ‘15’) is composed of the total income of the father (‘13’) plus the total income of the mother (‘14’) of the applicant. Both information elements ‘13’ and ‘14’ are needed to produce the outcome of the calculation (‘15’). Therefore, the two arrows are linked to each other. In our information element structure view, this can be distinguished as one operation, containing two input elements (‘13’ and ‘14’) and one output element (‘15’). To determine the father’s income another operation has to be executed. The
294
H.A. Reijers and I.T.P. Vanderfeesten
amount of income (‘13’) is inquired from the tax authority, requiring the social security number of the father (‘9’) and the reference year (‘10’). The operation to retrieve the mother’s income (‘14’) uses as inputs the same reference year for the tax authority (‘10’), but of course, a different social security number (‘11’). Table 1. Description of information elements of the information element structure in figure 2. Information element number 1 2 3 4 5 6 7 8 9 10 11 12 13 14 15 16 17 18 19 20 21 22 23 24 25 26 27
Description First day of study Date from which applicant wants to receive a scholarship Period or year for which the applicant requests a student grant Date of request Birth date of applicant Nationality of applicant The kind of student grant the applicant requests Age of applicant Social Security Number father of applicant Reference year for tax authorities Social Security Number mother of applicant Applicant has a right to receive a student grant Income of father of applicant Income of mother of applicant Income of applicant’s parents Applicant has a right to receive a supplementary scholarship Kind of health insurance of applicant Living situation of applicant Applicant has a right to receive a loan from the student grant institute Maximum amount that can be received for supplementary scholarship Parental contribution The amount of loan the applicant requests Maximum amount of loan The amount of supplementary scholarship that is assigned to applicant The amount of basic scholarship that is assigned to applicant The amount of loan that is assigned to applicant The total amount of student grant that is assigned to applicant
Now, the determination of the parent’s income can be seen as one activity in the workflow process, containing exactly the three operations as described above. Information elements ‘13’ and ‘14’ can be distinguished as “half-assembly” products, because they are output elements of two different operations and input elements of another operation. An information element structure as we presented here, is rather similar to a Bill Of Material (BOM), (see [305]). Note that the presented information element structure incorporates an interesting characteristic, namely a conditional alternative. In general, this means that depending on a specific condition, i.e. the value of an information element, different routes have
Cohesion and Coupling Metrics for Workflow Process Design
295
to be followed to produce the end product. The notion of the conditional alternative is represented in the information element structure by using different notations. In Figure 2 this is clarified. The structure on the left-hand side is an AND-construction. All three input elements are needed to determine the value of the output element of this operation. On the contrary, the structure on the right-hand side is a so-called eXclusive OR-construction (XOR). The output information element can be produced either out of “a” or out of “b” and “c” together. Having explained this notation, it may now become clear from Figure 1 that the value of information element '27' can be determined in two different ways. If the value of information element '12' is “no”, information element '27' can be produced directly. When the value of '12' is “yes”, a number of other steps have to be executed before the value of information element '27' can be determined. d
a
b
d
c
a
b
c
Fig. 2. Representation of an information element structure with AND- and XOR-construction. The structure on the left-hand side is the AND-construction: “a”, “b” and “c” are needed to get “d”. The right-hand structure is the XOR-construction. To make “d” information element “a” is needed or information elements “b” and “c” are needed.
G
F
C
B
A
E
D
Fig. 3. The workflow net of “Request for governmental student grant”
In Figure 3, the current workflow process that implements the information structure of Figure 1 is represented as a workflow net ([4]). Individual activities, as described in Table 2, are represented as rectangles. We will explain the exact relation between the operations of the information element structure and the workflow process after we have formally defined both concepts in a later section.
296
H.A. Reijers and I.T.P. Vanderfeesten Table 2. Description of the activities in the workflow net of Figure 4.
Activity A B C D E F G
3
Description Determine the income of the parents of the applicant Determine the period/year of student grant and the reference year for tax authorities Determine if the applicant has a right to receive governmental student grant Determine the amount of basic scholarship Determine the amount of supplementary scholarship Determine the amount of loan Determine the total amount of student grant
A Cohesion and Coupling Notion for Workflow Activities
Because of the resemblances between software programs and workflow processes as mentioned in the introduction, we studied various software quality metrics in software engineering and their applicability to workflow process design. According to [9] and [22] the quality of a design is related to five design principles: coupling, cohesion, complexity, modularity and size, of which the first two are the most important ones ([12] and [22]). These concepts can be implemented in several ways (see for example: [8], [10], [11] and [21]). Due to space limitations, we cannot describe these metrics in detail, but we concluded that because of subtle differences between software programs and workflow processes none of the existing cohesion metrics seem to be directly applicable to workflow design. However, we were inspired by the idea of the coupling metric by Selby and Basili ([20]) and Xenos et al ([23]). Also, we adopted the combined use of a cohesion and coupling metric as in [20]. As an extension of earlier work ([17]), we will now present a formalization of the design problem and new and extended cohesion and coupling metrics. First of all, the job of process design is to impose on a set of operations and its accompanying information elements a number of activities that partition it. Therefore, we introduce the concept of an operations structure. Definition 1 (Operations Structure). An operations structure is a tuple (D, O) with: • D: the set of information elements that are being processed, • O = {(p, cs) ∈ D × P(D)} is a set of operations on the information elements, such that there are no 'dangling' information elements and no value of an information element depends on itself: • R = {(p, c) ∈ D × D | ∃ (p, cs) ∈ O: c ∈ cs} is connected and acyclic, where p denotes the output information element of the operation and cs the input elements of the operation. We have to remark here that the conditional alternative construction as introduced previously is represented by multiple operations with the same output element (as many as there are alternatives). The formalization of the operations of the situations
Cohesion and Coupling Metrics for Workflow Process Design
297
given in Figure 2 is then as follows. The construction on the left is built of one operation that is represented by the tuple: {(d, {a, b, c})}. The XOR-construction on the right is built out of two operations that can be formalized by {(d, {a}), (d, {b, c})}. The activities that partition an operations structure should satisfy a basic notion of correctness. Definition 2 (Valid Activity). Given an operations structure (D, O), any subset t ⊆ O is a valid activity on the operations structure, or simply an activity. Definition 3 (Valid Activity Ordering). Given an operations structure (D, O), the tuple (T, F) is a valid activity ordering on that operations structure iff: • T is a set of valid activities, T ⊆ P(O), such that: ∀o ∈ O : (∃t ∈ T : o ∈ t ) .
• F is a partial ordering on T, F ⊆ T × T, such that:
(
∀t , u ∈ T : (∃( p, cs ) ∈ t , (q, ds ) ∈ u : q ∈ cs ) ⇒ (u , t ) ∈ F *
(1)
)
(2)
Within this definition it is expressed by (1) that all operations from the operation structure should appear at least once in an activity. This condition ensures the completeness of the activity design. Condition (2) enforces that when one operation depends on the output of another operation, then the respective activities they are part of are ordered such that they respect this dependency. In other words, if the execution of an activity requires the value of an information element for one of its operations to be executed, this information element has been established as part of executing a preceding activity. This condition ensures the correctness of the ordering. A new cohesion metric, which allows for the assessment of conditional alternatives in an information element structure, can now be defined as follows. Its first component, the relation cohesion, quantifies how much the different operations within one activity are related. It does so by determining for each operation of an activity with how many other operations it overlaps by sharing an input or output, i.e. a nonempty intersection. In this determination conditional alternatives are treated as separate operations, because in an instantiation only one of the alternatives will be executed. The overlap between these operations (they have the same output element) is therefore not considered. This explains why the expression p ≠ q is in the formula. Then, the average overlap per operation is computed by dividing the total amount of overlaps by the number of operations. Finally, note that all overlaps are counted twice, because we considered all pairs of operations separately (distinguishing as different pairs for example (p, cs), (q, ds) and (q, ds), (p, cs) ). Therefore, to get a relative metric between 0 and 1, the average overlap per operation over all operations within an activity is divided by the maximal overlap, i.e. the number of operations minus 1. Definition 4 (Activity Relation Cohesion). For a valid activity t on an operation structure (D, O), its relation cohesion λ(t) is defined as follows:
298
H.A. Reijers and I.T.P. Vanderfeesten
∑
{(q, ds ) ∈ t | ({p} ∪ cs ) ∩ ({q} ∪ ds ) ≠ ∅ ∧ ( p ≠ q )} ( p,cs )∈t , for t > 1 λ (t ) = t ⋅ t −1 0 , for t ≤ 1
(
)
(3)
The other component of our cohesion metric, the activity information cohesion, focuses on all information elements that are used either as input or output by any operation within the respective activity. It determines how many information elements are used more than once in proportion to all the information elements used. It does so by counting all different information elements that appear in the intersection of a pair of operations, considering all pairs. Again, in case of conditional alternatives, the overlapping element is left aside. This number is divided by the total number of information elements in the activity. Definition 5 (Activity Information Cohesion). For a valid activity t on an operation structure (D, O), its information cohesion µ(t) is defined as follows: {d ∈ D | ∃( p, cs ), (q, ds ) ∈ t : d ∈ ({p} ∪ cs ) ∩ ({q} ∪ ds ) ∧ ( p ≠ q )} , for t > 0 {d ∈ D | ∃( p, cs ) ∈ t : d ∈ ({p}∪ cs )} µ (t ) = 0, for t = 0
(4)
The total cohesion of an activity is now given as the product of both the relation and information cohesion. This is to reflect that in our opinion an activity has to score high on both cohesion metrics to say it is cohesive in total. In other words, the operations should be inter-related to each other and information should be shared. Definition 6 (Activity Cohesion). For a valid activity t on an operation structure (D, O), its cohesion c(t) is defined as follows:
c(t ) = λ (t ) ⋅ µ (t ) .
(5)
The cohesion of the process in total can then be determined by the average activity cohesion. Definition 7 (Process Cohesion). For a process, which consists of a number of valid activities on the operations structure (D, O), the average cohesion, or process cohesion (c), is defined as follows:
∑c(t)
c = t∈T T
(6)
As an extension and a natural counterpart of cohesion we also define a metric for coupling in a process. Coupling focuses on how much the activities in a process are
Cohesion and Coupling Metrics for Workflow Process Design
299
related, or connected, to each other. A certain activity is connected to another iff they share one or more information elements. The coupling metric determines the number of related activities for each activity. First the average coupling is determined by adding up the number of connections for all activities and dividing this number by the total number of activities. Now, all pairs of activities have been counted twice. To get a relative metric, the average coupling is divided by the maximal number of coupling, i.e. the number of activities minus 1. Definition 8 (Process Coupling). For a process, which consist of a number of valid activities on the operations structure (D, O), the process coupling k is defined as follows:
∑
connected ( s, t ) s ,t∈T , for T > 1 k= T ⋅ T −1 0 , for T ≤ 1
(7)
1, if (s ≠ t ) ∧ (∃(p, cs ) ∈ s ∧ (q, ds ) ∈ t : ({p}∪ cs ) ∩ ({q} ∪ ds ) ≠ ∅ ) connected ( s, t ) = 0, otherwise
(8)
(
)
where
Inspired by the work of Selby and Basili ([20]), we also define a coupling/cohesion ratio. This ratio enables the comparison between various design alternatives. Definition 9 (Process Coupling/Cohesion Ratio). For a process, which consists of a number of valid activities on an operations structure (D, O), the process coupling/ cohesion ratio ρ is defined as follows:
ρ=
k . c
(9)
The previously defined metrics can be used to find the best workflow design among a number of alternative designs. The design with the minimal process coupling/cohesion ratio, is the best design. Note that we do not describe how the alternative designs can be determined. The ratio can only help to choose the best alternative between already devised options.
4
Application
In this section we will show an application of our above presented heuristic. We will use the example of the request for student grant introduced earlier. First we will compute the process cohesion of the partitioning of activities as given in the workflow net of Figure 3. Afterwards, we will give two alternative designs, one with smaller
300
H.A. Reijers and I.T.P. Vanderfeesten
activities and one with larger activities. Our heuristic will help to determine which of the three designs is best, implementing our hypothesis that activities should neither be too small nor too large. This is the insight which we derived from our experiences with workflow designers (see [17]).
E
F
24
21
26
20
13 19
3
16
7
22
14
23
9
17 12
12
A
15
7
10
11
3
15 C
B
12 10 D
25 G
27
8
25
24
26
12
18
17
12
3
4
6
5
3
7
1
2
Fig. 4. Partitioning of the information element structure in activities for the original “Request for student grant” process.
4.1
The Original Process Design
The original process design is a division of the information element structure into 7 activities, as displayed in the process model of Figure 3. The accompanying information element structures of the activities are shown in Figure 4. The formalization of the structure is as follows: DA OA DB OB DC OC DD OD DE OE DF OF
= = = = = = = = = =
{9, 10, 11, 13, 14, 15} { (13, {9, 10}), (14, {10, 11}), (15, {13, 14}) } {1, 2, 3, 10} { (3, {1, 2}), (10, {3}) } {4, 5, 6, 7, 8, 12} { (8, {4, 5}), (12, {6, 7, 8}) } {3, 12, 17, 18, 25} { (25, {3, 12, 17, 18}) } {3, 7, 12, 15, 16, 17, 20, 21, 24} { (16, {7, 12, 15}), (20, {3, 17}), (21, {15, 16}), (24, {20, 21}), (24, {16}) } = {3, 7, 12, 19, 22, 23, 26} = { (19, {7, 12}), (23, {3}), (26, {19, 22, 23}), (26, {19}) }
Cohesion and Coupling Metrics for Workflow Process Design
301
DG = {12, 24, 25, 26, 27} OG = { (27, {24, 25, 26}), (27, {12}) } The activity relation cohesion, the activity information cohesion and the activity cohesion are computed for all seven activities (see Table 3). Next the process cohesion is calculated. The process cohesion of the original process design is: c=
0.5 + 0.25 + 0.167 + 0 + 0.222 + 0.143 + 0 ≈ 0.183 7
.
(10)
Table 3. The activity relation cohesion, the activity information cohesion and the activity cohesion for all activities in the original process design.
Activity
Activity relation cohesion
A B C D E F G
1 1 1 0 0.5 0.5 0
Activity information cohesion 0.5 0.25 0.167 0 0.444 0.286 0
Activity cohesion
0.5 0.25 0.167 0 0.222 0.143 0
Table 4. The connections between activities from the original process design.
A B C D E F G
A 0 1 0 0 1 0 0 2
B 1 0 0 1 1 1 0 4
C 0 0 0 1 1 1 1 4
D 0 1 1 0 1 1 1 5
E 1 1 1 1 0 1 1 6
F 0 1 1 1 1 0 1 5
G 0 0 1 1 1 1 0 4
2 4 4 5 6 5 4 30
As an illustration of the computation of the coupling metric for this process a table (see Table 4) is given, containing all relations between activities (when two activities are connected the value is 1, when they are not connected the value is 0). The coupling value can now be calculated as follows: k=
2 + 4 + 4 + 5 + 6 + 5 + 4 30 = ≈ 0.714 7*6 42
.
(11)
Based on these values for cohesion and coupling for the process we can compute the coupling/cohesion ratio: ρ=
0.714 ≈ 3.9 0.183
.
(12)
302
H.A. Reijers and I.T.P. Vanderfeesten B
G
C
27
25
24
12
26
F
12
10
3
26
8
6
7 19
D
1
25
2
4
12
18
17
12
22
23
5
7
3
A3
3 16
A4
24
A1
A2
13
9
12
14
10
10
7
11
15
21
13
14
16
20
15
3
17
Fig. 5. The partitioning of the information element structure in smaller activities.
G
F
27
AE
26 24
25
24
26
12 19
22
23
21
20
16
17
D
25
12
18
17
12
7
3
3
3
12 B
7
15
C
12
10
13 3
8
6
9 1
2
4
14
7
10
11
5
Fig. 6. The partitioning of the information element structure in larger activities. Compared to the original structure activities A and E are merged.
Cohesion and Coupling Metrics for Workflow Process Design
4.2
303
The First Alternative Process Design: Smaller Activities
In the first alternative design the activities are considerably smaller (see Figure 5). Activities A and E are split up into four new activities: A1, A2, A3, and A4. The total number of activities in this first alternative design is now nine. The process cohesion value for this first alternative process design is 0.104. The value for coupling is 0.611. The resulting process coupling/cohesion ratio is 5.8. 4.3
The Second Alternative Process Design: Larger Activities
In the second, alternative process design we merged activities A and E from the original design together (see Figure 6). This process design has six activities. The value for the process cohesion metric is 0.123, the process coupling is 0.867 and the coupling/cohesion ratio is 7.0. Now we know the value for the coupling/cohesion ratio of each process design, we can apply our heuristic. When we compare the coupling/cohesion ratio of the original design to that of the first alternative design we can conclude that the original design is best, because its coupling/cohesion ratio is lower. In the first alternative, various very small activities have been defined that seem to lead to a very fragmented workflow model, which is not something to aim for. Then, comparing the original design to the second alternative, the heuristic indicates that the original design again is best (lower coupling/cohesion ratio). This appeals to our intuition that the very large activity AE is not very attractive, because of its relatively high complexity and incohesive structure. In conclusion, the heuristic points out the original design as the most favorable one, which is confirmed by our intuition. Moreover, it seems to be in line with earlier findings where activities which were not too large and not too small were favored by experienced workflow designers ([17]).
5
Conclusion / Future Work
In this paper we discussed the applicability and development of cohesion and coupling metrics in workflow process design. We defined cohesion and coupling metrics for the design of activities in a workflow design, based on an information processing perspective on workflow processes. Although existing software quality metrics inspired us, none of these seemed directly applicable to the workflow process domain. Based on our newly introduced coupling and cohesion metrics, we also defined a ratio that allows for a comparison between alternative designs to decide which one is best. Obviously, the information processing perspective we took is but one of the views on workflow design. An important limitation of the metric in isolation is its abstraction from resources. Only qualified and authorized employees may execute specific operations (see e.g. [4]). Therefore, two operations with different resource requirements can not be clustered within the same activity. Resource restrictions limit
304
H.A. Reijers and I.T.P. Vanderfeesten
the freedom in distributing operations over activities and should therefore precede the application of a heuristic as discussed in this paper. A similar argument may be raised for the performance aspect of the operations. We abstracted, for example, from timing information on the various operations, although this may be essential information to come up with a well-structured workflow design. When certain operations take a lot of time compared to other activities, it is not sensible to put them together in one activity. We feel that this is one of the most pressing issues for further research in extending our – as of yet – purely logic view on the operations. Many more possibilities to extend this research exist. On a higher level, we aim for the testing of our hypothesis on the quality of workflow designs. This will require the further involvement of actual workflow models, the knowledge of workflow designers, and end-users. Finally, the cohesion and coupling metrics and heuristic can only support the workflow designer in making decisions with respect to activity definition. The heuristic does not suggest any clustering or ordering of information elements itself. An extension of the heuristic so that it efficiently generates (semi-)optimal activity definitions itself will be an ultimate and challenging next step in this domain.
References 1.
W.M.P. van der Aalst. On the Automatic Generation of Workflow Processes Based on Product Structures. Computers in Industry, 39(2):97-111, 1999. 2. W.M.P. van der Aalst. Reengineering Knock-out Processes. Decision Support Systems, 30(4):451-468, 2001. 3. W.M.P. van der Aalst and P.J.S. Berens. Beyond Workflow Management: Product-Driven Case Handling. In S. Ellis, T. Rodden, and I. Zigurs, editors, International ACM SIGGROUP Conference on Supporting Group Work (GROUP 2001), pages 42-51. ACM Press, New York, 2001. 4. W.M.P. van der Aalst and K.M. van Hee. Workflow Management: Models, Methods, and Systems. MIT press, Cambridge, MA, 2002. 5. W.M.P. van der Aalst, A.H.M. ter Hofstede, B. Kiepuszewski, and A.P. Barros. Workflow Patterns. Distributed and Parallel Databases, 14(1):5-51, 2003. 6. L. Baresi, F. Casati, S. Castano, M. Fugini, I. Mirbel, and B. Pernici. WIDE Workflow Development Methodology. Proceedings of International Joint Conference on Work Activities Coordination and Collaboration., pp. 19-28, 1999. 7. A. van den Berg, P. Pottjewijd. Workflow: Continuous Improvement by Integral Process Management. Academic Service, 1997 (page 77). (In Dutch) 8. J.M. Bieman, B-K Kang. Measuring Design-level Cohesion. IEEE Transactions on Software Engineering, 24(2): 111-124, 1998. 9. S.D. Conte, H.E. Dunsmore, V.Y. Shen. Software Engineering Metrics and Models. Benjamin/Cummings Publishing Company, Inc., 1986. 10. T.J. Emerson. A Discriminant Metric for Module Cohesion. Proceedings of the 7th International Conference on Software Engineering (ICSE-7), pages 294-303, 1984. 11. N. Fenton, A. Melton. Deriving Structurally Based Software Measures. Journal of Systems and Software, 12: 177-187, 1990. 12. G.J. Myers. Composite/Structured Design. Van Nostrand Reinhold, New York NY, 1978.
Cohesion and Coupling Metrics for Workflow Process Design
305
13. A. Orlicky. Structuring the Bill of Materials for MRP. Production and Inventory Management, December, pp.19-42, 1972. 14. E.A.H. Platier. A Logistical View on Business Processes: Concepts for Business Process Redesign and Workflow Management. PhD thesis, Eindhoven University of Technology, Eindhoven, 1996. 15. H.A. Reijers, S. Limam, W.M.P. van der Aalst. Product-Based Workflow Design. Journal of Management. Information Systems, 20(1): 229-262, 2003. 16. H.A. Reijers. Design and Control of Workflow Processes: Business Process Management for the Service Industry. Lecture Notes in Computer Science 2617. Springer-Verlag, Berlin, 2003. 17. H.A. Reijers. A Cohesion Metric for the Definition of Activities in a Workflow Process. Proceedings of the Eighth CAiSE/IFIP8.1 International Workshop on Evaluation of Modeling Methods in Systems Analysis and Design 2003, pages 116-125, 2003. 18. R.O. Rupp, J.R. Russell. The Golden Rules of Process Redesign. Quality Progress, 27(12): 85-92, 1994. 19. A. Seidmann and A. Sundararajan. The Effects of Task and Information Asymmetry on Business Process Redesign. International Journal of Production Economics, 50(2-3): 117128, 1997. 20. R.W. Selby, V.R. Basili. Analyzing Error-Prone System Structure. IEEE Transactions on Software Engineering, 17(2):141-152, 1991. 21. F. Simon, S. Löffler, C. Lewerentz. Distance Based Cohesion Measuring. Proceedings of the 2nd European Software Measurement Conference (FESMA) 1999, pages 69-83, 1999. 22. D.A. Troy, S.H. Zweben. Measuring the Quality of Structured Designs. Journal of Systems and Software, 2: 113-120, 1981. 23. M. Xenos, D. Stavrinoudis, K. Zikouli, D. Christodoulakis. Object-oriented Metrics – A Survey. Proceedings of the Federation of European Software Measurement Association (FESMA) 2000, pages 1-10, 2000.