Cold chain configuration design: Location-allocation decision-making using coordination, value deterioration, and big data approximation Adarsh Kumar Singh* Nottingham University Business School China, The University of Nottingham Ningbo China, 199 Taikang East Road, Ningbo, 315 100. Email:
[email protected] *Corresponding Author
Nachiappan Subramanian School of Business Management and Economics, University of Sussex, Jubilee Building, 204, Falmer, Brighton BN! 9SL.
[email protected] Phone: +44 1273 872982 Kulwant Singh Pawar Centre for Concurrent Enterprise Nottingham University Business School, The University of Nottingham, Jubilee Campus, Nottingham, NG8 1BB, UK Email:
[email protected]
Ruibin Bai School of Computer Science, The University of Nottingham Ningbo China, 199 Taikang East Road, Ningbo, 315 100. Email:
[email protected] Submitted to the Annals of Operations Research special issue titled “Big Data Analytics (BDA) in Operations and Supply Chain Management”
Cold chain configuration design: Location-allocation decision-making using coordination, value deterioration, and big data approximation
Abstract The study proposes a cold chain location-allocation configuration decision model for shippers and customers by considering value deterioration and coordination by using big data approximation. Value deterioration is assessed in terms of limited shelf life, opportunity cost, and units of product transportation. In this study, a customer can be defined as a member of any cold chain, such as cold warehouse stores, retailers, and last mile service providers. Each customer only manages products that are in a certain stage of the product life cycle, which is referred to as the expected shelf life. Because of the geographical dispersion of customers and their unpredictable demands as well as the varying shelf life of products, complexity is another challenge in a cold chain. Improved coordination between shippers and customers is expected to reduce this complexity, and this is introduced in the model as a longitudinal factor for service distance requirement. We use big data information that reflects geospatial attributes of location to derive the real feasible distance between shippers and customers. We formulate the cold chain location-allocation decision problem as a mixed integer linear programming problem, which is solved using the CPLEX solver. The proposed decision model increases efficiency, adequately equates supply and demand, and reduces wastage. Our study encourages managers to ship full truck load consignments, to be aware of uneven allocation based on proximity, and to supervise heterogeneous product allocation according to storage requirements.
Keywords: Location-allocation problem; cold chain configuration; coordination; big data
1. Introduction Changes in lifestyle and income increases in developed and developing countries have escalated the demand for healthy and nutritious food products. The demand for frozen food, currently valued at US$224.74 billion, is projected to reach US$293.75 billion by 2019 (Meneghetti and Monti, 2015). Fruits, vegetables, and pharmaceutical goods are typical examples of perishable products that tend to deteriorate exponentially over time (Bai and Kendall, 2008); therefore, monitoring and controlling storage temperature is essential to enhance the safety and quality of such products. The
objective of cold chain configuration design is to protect perishable products while minimizing cost, waste, and energy. Currently, cold chain configuration is neither adequately developed nor applicable to bottom line users, who are highly fragmented and characterized by the many geographically dispersed primary producers and intermediaries followed by manufacturers, retailers, and so forth. The major reason for this fragmentation is the supply and demand mismatch which arises from a seasonal production but a year-long demand requirement. The few attempts that have been made to equate cold chain demand with supply have resulted in searches for suppliers beyond regional boundaries. Regulations on products imported by sea are typically different from those imposed when the same product is produced and consumed locally. This differentiation is a crucial characteristic to be considered when designing a cold chain distribution network configuration strategy because the product value and deterioration depends on the product’s age and not its durability. The specific requirements for storage and transportation configuration under controlled conditions further amplify the complexity that requires customized strategies to enable efficient functioning of cold chain operations.
High safety and quality requirements for perishable products, particularly food products, have resulted in considerable wastage, leading to economic and social losses. This is a major concern in emerging economies, specifically in China, where 370 million tons of fruits and vegetables (worth 75 billion Yuan), which can feed 200 million people, are wasted annually. Similarly, in India, poor infrastructure and inadequate monitoring results in substantial (35%–40%) wastage of fruits and vegetables (Shih and Wang, 2016). The effects of temperature and time on the internal characteristics of food products are irreversible, which places stringent requirements on preserving food safety and quality. Food loss is primarily attributed to inadequate storage infrastructure and inappropriate handling and transportation. Decision makers at all stages of food manufacturing must differentiate between appropriate use of frozen storage and cool storage. The aforementioned factors also lead to misinterpretation of information by multiple actors at various stages (Thakur and Forås, 2015).
Food supply chains are similar to value chains except in that the deployment of appropriate refrigeration technology is critical to maintaining the quality, nutritional, and financial value of the product (Dodd and Bouwer, 2014). Although effective cold chain management primarily
decelerates the deterioration of harvested products, it may not necessarily enhance the nutritional value. Some attributes that increase the complexity of cold chain are distance, change of transport, and storage units, as well as other trade and border regulations.
Involvement of heterogeneous customers further complicates the operation and functioning of cold chains. The standard location–allocation problem in a conventional supply chain includes aggregating demand and service requirements by customers rather than by products. However, to develop a suitable cold chain configuration for perishable products, shelf life and stringent storage requirements are critical factors that must be considered in the location–allocation decision.
We propose a decision model for analyzing how certain customers identify cold storage locations and allocate according to the demand for perishable products. In addition to shelf life, we consider four other factors that are most essential in location allocation for cold chains: coordination among fragmented and heterogeneous customers, opportunity cost in terms of deterioration of value with time, units of product transportation, and distance calculation by using big data approximation. A critical aspect considered in the model is the difference between product value and market price. Shelf life represents the marketable life of a product and not necessarily its physical condition or deterioration rate (Wang et al., 2009).
The present study contributes to the literature on location–allocation by integrating the aspect of perishability in decision-making. Location–allocation studies that have addressed durable products have been modeled using customer service requirements. In this study, a customer is any member of a cold chain, such as cold warehouse stores, retailers, and last-mile service providers. Each customer can manage only products that are in a certain stage of the product life cycle, which is referred to as the expected shelf life (ESL). Moreover, the same product might be required by various customers with different ESL and different product value on account of order frequency, proximity from point of use (PoU), and selling market. Geographically fragmented customers with different ESL increase the complexity of coordination necessary for satisfying demands. Coordination is achieved by selecting and allocating storage locations that satisfy the ESL of customers. This is incorporated into the model by translating ESL into a service distance requirement. The proposed model allows both discrete and continuous transportation units for
products. For example, a piecewise product flows in discrete units, whereas weight (in kilograms) flows in continuous units. Value for perishable products deteriorates with time (Coelho and Laporte, 2014) and unmet demand for perishable products can then be considered opportunity cost. We define opportunity cost as a value of product ESL perceived by customers that determines the bundling of products when storage capacity is limited. The study utilizes big data information that reflects geospatial attributes of location to derive the real feasible distance between shippers and customers. The conceptual description of the problem is detailed in Section 3. The results of this study provide several valuable insights into aspects such as full truck load (FTL) shipments, uneven allocation based on proximity, and heterogeneous product allocation according to storage requirements. Finally, the role of opportunity cost is illustrated under capacity allocation decision. The optimization model facilitates coordination by encapsulating the service distance requirement of perishable products to a heterogeneous group of customers.
The remainder of the paper is organized as follows: Section 2 presents a discussion of the literature on cold chain storage requirement and coordination concerns, location–allocation problem, and summary of the gaps in literature. Section 3 provides a conceptual description of the problem and is followed by mathematical formulation in Section 4 and an illustrative example in Section 5. Finally, the results are discussed in Section 6, and the conclusions, prospects for future research, and limitations of the study are presented in Sections 7, 8, and 9, respectively.
2. Literature review 2.1 Cold chain storage requirement and coordination concerns Cold chain creates customer value by merging logistics activities related to perishable products with prevalent business processes (Shih and Wang, 2016). Cold supply chains require storage and transportation of associated products in temperatures approximately equal to or less than their freezing points; this places emphasis on appropriate temperature settings in refrigerated warehouses and trucks to fulfill the needs of the customers. Refrigerant energy leakage is proportional to the cooling capacity of the system. In conventional supply chains, the warehouse capacity is dependent on throughput (demand rate) and actual stock-keeping capacity. However, the operating cost for cold storage increases drastically with the addition of a refrigeration system; this means that warehouse capacity is influenced by demand pattern, inventory policy, and
customer service requirements as well as actual physical capacity (Saif et al., 2016). Consideration of customer service requirement is driven by the shelf life of products: acceptable safety and quality levels should be maintained when the products reach the customer.
The quality of food products is dependent on the temperature, time, and atmosphere of storage, all of which affect-depending on the sensitivity of the product to time and temperature-the degree of deterioration of products. The average storage time at distribution centers depends upon the batch size of transfer between producers and distributors, which influences variable cost, whereas fixed cost depends on the set-up costs for cooling and treatment units (Zanoni and Zavanella, 2012).
Consolidation in storage for durable products is mostly influenced by external features such as shape, size, weight, and volume of the products. The ability to share the same storage space depends on compatibility in terms of the modular design of products, which differs between perishable and durable products. Different holding temperature requirements restrict the combining of cold items for shipment and storage. Clustering of cold items, such as dairy products (milk and chocolate milk) can be facilitated by enabling sharing of storage and transportation capacity to fulfill the demand requirements (Bozorgi, 2016).
Speed, reliability, and specialized transportation and storage units impose additional requirements on a food supply chain. Modern food chains entail multiple products with multiple temperature requirements, defying the notion of “one size fits all.” Food contamination depends on external factors (humidity, temperature) and internal factors (microbial contamination and composition) as well as the duration of exposure to these conditions (Thakur and Forås, 2015).
Chen et al., 2016 identified that uncertain factors, such as weather, temperature, and customer preferences, influence the demand for agriculture products. China, with its decentralized and complex agriculture configuration, requires an organized farming structure, such as the facility agricultural supply chain prevalent in Eastern China. The operation of organized farming is structured to allow supermarkets to order from the facility agricultural enterprises according to the demand. This further enables the development of a plan for upstream farm producers through adequate coordination. In China, shortages of third-party logistics (3PL) warehousing for cold
chains are because of the following reasons: i) low capacity and low space utilization rate, ii) low utilization rate per year due to seasonality of the products, iii) difficulties in guaranteeing product quality, and iv) low operational efficiency due to manual entry and untimely updates (Zhang et al., 2012).
Dissimilar products should have different types of service levels. Warehouse locations for frozen products may be located closer to either the harvest (or production) center or the market. Temperature control ensures food product quality and safety. On the basis of temperature control, food products can be classified as frozen (lower than −18°C), ambient (room temperature), and chilled (0–15°C) products, with further diversification or clustering (Fredriksson and Liljestrand, 2015). Frozen food stores in Germany are classified as follows: (1) plant cold stores (number [n] = approximately 20, temperature [T] < −20°C); (2) central cold stores (n = approximately 80, T < −24°C); distribution cold stores (n = approximately 200, T < −20°C); freezing cabinets in retail (n = approximately 2 × 10⁵, T = approximately −18°C). The British Frozen Food Federation has differentiated primary cold stores for frozen foods as those with temperatures ranging between −20 and −28°C, with the ability to reduce the temperature to −18°C and with a tolerance of 3°C in primary distribution. The American Society of Heating, Refrigerating and Air-Conditioning Engineers require temperatures for frozen food storage to be between −23 and −29°C, whereas the Italian Frozen Food Institute guidelines suggest a maximum storage temperature of −22°C (Arduino et al., 2015). The difference in temperature requirements for different countries, stages, and measuring units of temperature increases complexity in coordination because of the presence of multiple actors and potential for misinterpretation of information.
Producers and farmers face greater risks and lower margins primarily because of a low level of consolidation. This has resulted in higher bargaining power possessed by a small number of retailers in fresh fruits and vegetables supply chains. Farmers are seeking measures to grow either individually or in associated groups or cooperatives to benefit from high levels of consolidation. The integration needs to be complemented by simultaneous collaboration with downstream partners. Planning of production associated with farmers is influenced by external factors related to demand forecasting as well as by internal factors that pertain to the distribution of demand among associated members. The cooperative structure is not effective because of asymmetric
information and decentralized control, which are primarily attributed to farmers’ reluctance to share cost structures and expected outputs (Mason and Villalobos, 2015).
2.2 Location-allocation problem Location problems can be depicted on a graph network with nodes (location) and arcs (distance between locations). Locations on networks are differentiated as either tree-like structures or with cycles (Tansel et al., 1983). The tree-like structures are utilized when cycles are expensive, for example, to depict interstate highways. The functions of distance for tree-like structures functions are often convex, whereas those for cyclic networks are non-convex. In Daskin et al. (1992), determination of planning horizon for the first period decision served as an efficient tool for the dynamic uncapacitated fixed-charge location problem.
Facility location problems are of two types: number of facility locations, which is a p-median problem, and service levels (based on distance), which is set covering problem. Other types of problems are formulated by combining these aspects with additional criteria. Owen and Daskin (1998) reviewed decision making methods for facility location problems, including p-median, set covering, and p-center problems, and established that the robustness of a facility location model depends on uncertain future events and changes in the state of the system. Long-term planning characterizes the complexity and importance of facility location as it involves high initial investment and uncertainty. Substantial reduction in computational time was achieved in solving such complex problems by sequential arrangement of inherent quality. Inventory costs at distribution centers and economies of scale associated with transportation cost are expected to help in solving the facility location problem (Daskin et al., 2002). Ghaderi and Jabalameli (2013) provided a solution for the longitudinal uncapacitated facility location-network design problem with budget constraints for opening the facility and creating links during each period of planning horizon and demonstrated the practical feasibility of the proposed approach by applying it to health care facilities in Iran.
Warehouse site selection is a strategic decision with high initial investment and requires a process that integrates both tangible and intangible criteria into the decision-making process. The analytical hierarchical process (AHP), which is used to link corporate objectives with site selection
criteria in the form of hierarchical relationships, facilitates the prioritization of warehouse sites (decision alternatives) (Korpela and Tuominen, 1996). Fischer (2002) modeled duopolistic location planning with variable locations and prices to reach an equilibrium price and a sequential problem with the leader assessing the actions of the follower to make pricing decisions. The effect of knowledge spillovers on location choice for new entrants in the United States from 1985 to 1994 revealed that firms tend to align physically with locations of high academic innovation while also considering the impact of outward knowledge spillovers. Technological factors are also attributed to the selection of location sites: less technologically advanced regions emphasize industrial innovative regions and more technologically advanced regions avoid such regions to reduce outward spillover to competitors (Alcácer and Chung, 2007). The function for weightage of demand point with time enabled the identification of optimal locations, relocation times, and total cost (Farahani et al., 2008). Avella et al. (2012) performed a clustering analysis wherein p facilities (medians) were located by minimizing the sum of distances from each facility to the nearest facility. Clustering involves grouping a set of similar patterns into clusters to reduce the size of the problem and further solving each cluster as a p-median problem. The material location–allocation problem in dual warehouses for allocating material quantity between owned warehouses and those rented from 3PL would be beneficial when the storage capacity constraint of manufacturer’s warehouse requires renting a 3PL warehouse, which incurs storage rental and transportation costs and excludes the initial investment for the site (Wutthisirisart et al., 2015). Drexl and Schneider (2015) highlighted using planar locations, instead of any location on plane, to eliminate the problem of forbidden regions. The authors also emphasized the need for integrating other logistical factors with the problem to apply a more holistic approach.
2.3 Analyzing real-time data in the cold chain perspective Tracking technologies vary from paper-based entry to computer-based information technologies and highly sophisticated biological technologies. Qualitative traceability involves the ability to trace the physical flow along with additional information on ingredients, quantity, supplier, producer, and the linkage among them. Moreover, identifying the source of contamination and assessment of variance in quality is helpful. Most food products are treated as commodities that can be easily substituted, thereby complicating the tracing process (Turi et al., 2014).
Wang et al. (2015) emphasized the development of real-time environment monitoring to maintain the safety and quality of perishable food products. Transportation and storage conditions, such as the state of motion of the transporting vehicle, vibrations, unexpected fall, loading, unloading, and power management in non-joined status, are critical factors affecting value added attributes of food products. Although installed thermometers and humidity sensors capture the macroscopic environment in warehouses and vehicles, they fail to provide continuous and microscopic information. The categories and their respective information attribute characteristics in a food supply chain are as follows: i) environmental conditions: temperature, humidity, and carbon dioxide concentration; ii) state of motion: abnormal vibration, unexpected fall, excessive tilt, and illegal opening; iii) location: geographical positioning system (GPS) and iv) network status: voltage network topology.
Various studies have employed databases and online application of temperature monitoring through the application of temperature monitoring technologies. Thakur and Forås (2015) developed an approach for online temperature monitoring and traceability in a cold chain. Electronic Product Code Information Services (EPCIS), a web-based temperature monitoring system, was deployed during various phases of product flow for monitoring temperature and tracking. Gogou et al. (2015) developed a cold chain database (CCD) tool to manage and evaluate food products. The tool estimated the product shelf life on the basis of existing or user-defined kinetic data. Grunow and Piramuthu (2013) estimated the remaining product shelf life using radio frequency identification (RFID) for waste reduction. Applicability of RFID use among retailers, distributors, and customers was compared with barcode using return on investment as a (ROI) measure. Derens-Bertheau et al. (2015) used the real-time-temperature profile of a Frisbee field test to measure the time–temperature performance of chilled food.
2.4 Summary of research gaps An analysis of the literature provided the following insights into the unexplored area of the location–allocation problem in cold chain configuration, which requires development to preserve value by ensuring acceptable shelf life quality (Wang and Shih, 2016) and emphasizing specific storage requirements (Saif et al., 2016; Zanoni and Zavanella, 2012): First, the necessity to
characterize cold chain service requirement on the basis of the product level (Fredriksson and Liljestrand, 2015) with emphasis on addition of touch points to avoid wastage and uninterrupted supply; second, the misinterpretation of information, because of different temperature requirements at various stages (Arduino et al., 2015), and asymmetric information and decentralized control (Mason and Villalobos, 2015) require coordination with an initiative originating from mature downstream members; finally, the necessity to monitor the temperaturetime relationship requires the sophisticated use of technology to ensure safety and quality of products. However, most studies (Wang et al., 2015; Thakur and Forås, 2015; Gogou et al., 2015; Grunow and Piramuthu, 2013; Derens-Bertheau et al., 2015) have been conducted at an operational level and not at a planning level. The incorporation of perishability and deterioration at the planning stage would facilitate the design of a robust system and form a suitable framework for incorporating such technologies.
The accumulation of extensive quantum diverse datasets in an analytics environment requires decision makers to devise a mechanism for integrating the two aspects in the evaluation of alternatives. Hazen et al. (2016) suggested the need to bridge the gap between operations research/supply chain management and big data analytics by synergizing decision-making with quantitative results, transitioning to business analytics, enhancing data quality, diversifying team structure, and defining a structured plan for alternative selection. Recent research on big data sets in the operations management domain includes the studies by Wang et al (2016) which focused on developing a capacitated network design to locate distribution centers for scattered demand points and Tail and Singh (2016) which focused on the facility layout problem. Aloysius et al. (2016) investigated the role of technology enablers and privacy inhibitors in big data customer transactions in the realization of competitive advantage by retailers. The role of decision-making is altered with the advent of big data, and reading relevant information is an asset that is expected to assist in achieving the appropriate results for gaining a competitive advantage.
The location–allocation problem is a long-range decision problem with high initial investment (Owen and Daskin, 1998); the addition of product-related aspects (Wutthisirisart et al., 2015) in site selection and allocation requires more attention. Few studies (e.g., Ghaderi and Jabalameli, 2013) have used period data to investigate location–allocation problems under different
environments, thereby complicating the use of such data in cold chain configuration with a longitudinal product characteristic (shelf life). The use of a seed or potential locations as input parameters in the model is expected to not only lead to more practical results by avoiding the possible selection of forbidden locations (Drexl and Schneider, 2015) but also to simplify the modeling of such problems. The attributes of cold chain storage requirements and coordination aspects are illustrated in Tables 1 and 2, respectively.
Given the gaps in the literature, the current study addresses the following concerns for the location– allocation problem in cold chain configuration: a) Incorporation of perishable product attributes (shelf life, age-based value, or opportunity cost) b) Heterogeneous product-service requirements by different customers c) Use of big data in incorporating practical parameters d) Coordination to reduce complexity due to fragmentation
Table 1: Attributes of cold chain for storage requirements # Cold stores (ref. Germany)
Temperature (ref. Germany)
Distributors
Retailers
Capacity of Distributor
Consolidation Requirement
Location selection
Suppliers produce products requiring cold storage at further stages
Suppliers Manufacturers
Storage Time
Plant Cold Stores (~20)
Central Cold Stores (~80)
Distribution Cold Stores (~200)
Freezing Cabinets (~210)
T < −20°C
T < −24°C for Central Cold Stores
T < −20°C for Distribution Cold Stores
T < −18°C
Not Applicable Transfer batch size between producer and distributor
Inventory policy
Order size
Shelf life
Customer service requirements
Actual physical capacity
Promotional activity
Customers
Customers utilize household refrigerators for storage
Cold Chain Issues
Misinterpretation of information; Multiple actors
Different holding temperature
Product compatibility
Locating close to harvest/producti on or to market. Generally located close to market.
Table 2: Attributes of coordination in cold chain Horizontal Coordination Suppliers Manufacturers Distributors Retailers
Technology Loose Contract
Information sharing (Traceability)
Transition to market oriented systems
Interdependent security (Free riders-mixed testing for milk; Batch dispersion problem-food recalls)
Delivery performance (Service level and shelf life)
Customers
Consumer awareness (Qualitative traceability)
Environmental factors: Food miles and Carbon footprint
Cold Chain Issues
Cold chain integrity: Transportation, transshipment and warehouse storage temperature monitoring issues
Continuous imbalance between supply and demand
Safety requirement
Food source
Different temperature requirement at different stages
Vertical Coordination Associated groups or cooperatives to benefit from consolidation
Varies from paper based entry to computer based information technologies (RFID) and highly sophisticated biological technologies.
Asymmetric information and Decentralized control
3. Problem description The location–allocation problem in cold chain configuration requires the consideration of inherent product attributes, such as transient shelf life, storage time at warehouse, and time-dependent product value. Traditional location–allocation problems have focused specifically on locations with aggregate weight to minimize the total weighted average distance, which is subject to demand satisfaction. Product characteristic is a crucial characteristic for location allocation in cold chains. In this study, we consider a heterogeneous group of customers. Each customer only manages products that are in a certain stage of the product life cycle, which is referred to as ESL.
The objective of the problem is to identify location(s) on the basis of customer requirements to meet product demands. Traditional location–allocation problems use location points on a two dimensional plane and evaluate them numerically to identify these locations. Drexl and Schneider (2015) suggested that potential locations, instead of locations on the plane, be used to avoid the problem of forbidden locations. For example, the potential search outcome from location allocation may result in an isolated location with inadequate infrastructure and other capabilities. Therefore, understanding the importance of these locations is imperative because they involve high initial investment and long-term benefits. The existing warehouse(s) along with a set of seed locations are the potential locations in the model. Furthermore, prospective potential locations along with existing warehouse(s) are chosen in sufficient numbers and are densely scattered along the demand grid. We use big data, which actually transforms textual data into sensible information, for distance calculation to include shelf life in the problem; detailed descriptions are provided in Sections 3.1 and 3.2.
3.1 Haversine formula for distance calculation Sinnott (1984) devised the Haversine formula to calculate the distance between two locations on the basis of latitude and longitude. The use of Euclidean distance, which is based on point-to-point straight-line distance, provides the shortest distance between two locations. However, the Haversine formula considers the spherical shape of the earth for a more realistic distance calculation. The distance DistAB between two points A and B using the Haversine formula is defined as follows in Equation (1):
DistAB = 2 × R × arcsin √(sin2
(Xb -Xa ) 2
+ cos(Xa ) cos(Xb ) sin2
(Yb -Ya ) 2
)
(1)
where Xa and Xb are latitudes and Ya and Yb are longitudes for A and B, respectively. R is the radius of earth in kilometers (km), approximated as 6,371 km. We converted latitude and longitude units from degrees to radians by multiplying the radians terms by (π/180). The use of latitude and longitude for locations enabled in calculating distance without employing the use of distance engines with reasonable accuracy compared to actual road distance. It offered considerable benefit over straight-line distance and adequate approximation of actual road distance.
Customer service requirement for a product in terms of ESL is translated into a service distance requirement. The identification of many potential location sites requires determination of distance matrix from each warehouse to each customer. For instance, with “m” customers and “n” potential locations, the input requirement would be an m*n distance matrix from each potential location to each customer. Determining actual road distance from an open search engine, such as Google, would require considerable time and effort to retrieve sensible information from smaller areas. For example, a smaller area with 10 locations and 20 customers would have 200 possible combinations. In addition, Google has a per day data retrieval limitation: 2500 times per customer (Google Maps API, 2016). Hence, the use of big data approximation, such as the Haversine formula, will substantially reduce the effort to transform the distance information from a small combination of (m + n) customers and warehouse locations.
3.2 Incorporating shelf life in the problem Perishability of products can be classified in terms of using the product at the right time without considering deterioration, such as previous year’s calendar, and the deterioration of the product (such as fruits, vegetables, and medicines) with respect to time (Coelho and Laporte, 2014). Our model addresses the second category, namely deterioration of product value with respect to time or before the expiry date. The inability to use the product within the shelf life results in wastage of the product. Therefore, to reduce the wastage of perishable products, researchers and practitioners worldwide should address the issue at a strategic or design level. The location–allocation process typically begins with the identification of location(s); the selection of location depends on the product of total weighted distance and aggregate demand. The concern of similar and different
products perishability along with heterogeneous shelf life is considered in the location–allocation problem. Our model is applicable at a strategic level and is expected to aid in future location selection.
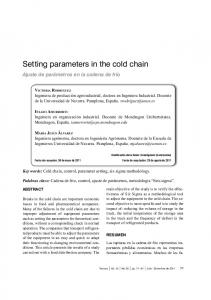
Our model derives the time dimension from four sources, such as distance, average speed of the vehicle, shelf life, and ESL. We assume that the shelf life of a product includes three phases: storage time at the warehouse (or location), transit time, and ESL requirement for customer, as demonstrated in Figure 1. The service distance is calculated using Equation (2). The allocation of customer and product to a particular location is competed on the basis of the comparison between actual and service distance and is expected to be less than or equal to service distance. The difference between shelf life and ESL provides the maximum available time for transportation, which is used as service distance requirement in the problem. Service Distance Requirement = (Shelf life – ESL) X Avg. speed of vehicle
Shipper Storage time at Warehouse
Transit time (If Actual distance