This article has been accepted for publication in a future issue of this journal, but has not been fully edited. Content may change prior to final publication. Citation information: DOI 10.1109/TCNS.2017.2754364, IEEE Transactions on Control of Network Systems
1
Collaborative and Compressed Mobile Sensing for Data Collection in Distributed Robotic Networks Minh T. Nguyen⋆ , Hung M. La, and Keith A. Teague
Abstract—In this paper, we exploit an integration between the mobility of robots and the collaboration between them to sample sensing areas that need to be observed. A Collaborative and Compressed Mobile Sensing (CCMS) algorithm is proposed for distributed robotic networks to build scalar field maps. In order to move in the sensing field and to avoid collision with obstacles and with each other, a control law is embedded into the robots. At a sampling time, each robot senses and adds data within its sensing range and collaborates to the others by exchanging data with its neighbors. A compressed sensing (CS) measurement created is a sum of scalar values collecting by a connected group of robots. A certain number of CS measurements is required at each robot to be able to reconstruct all sensory readings from points of interest visited by the group of robots. The method reduces significantly data traffic among robots. We further analyze and formulate power consumption for the robots, and suggest some optimal cases for the robot to consume the least power. Keywords—Distributed robotic networks, collaborative control, compressed sensing, scalar field mapping
I.
I NTRODUCTION
A. Motivation Mobile sensor networks (MSNs) have emerged as an effective solution for a wide range of applications. They are a class of networks where small sensing devices move in space over time to collaboratively monitor physical and environmental conditions (e.g., temperature, sound, vibration, pressure, motion, event detection). The networks are combined from sensors, control algorithms and other dynamic factors which depend on specific purposes or application scenarios [1], [2], [3]. One of the most common applications in MSNs is scalar field mapping [4], [5]. A scalar map can be presented as a vector X = [x1 x2 . . . xN ]T which includes unknown sensor readings from N points of interest (POIs) in a sensing area that needs to be observed. The readings are humidity, temperature, etc. and are often highly correlated or compressible. The sensory devices are often attached to moveable robots or vehicles which are controlled by algorithms [6]. In order to build a full map, all robots need to visit the entire sensing field at a high cost of energy for both sensor movements and communications [5], [7]. There Dr. Minh Nguyen is currently with Thai Nguyen University of Technology (TNUT), Vietnam. E-mails:
[email protected];
[email protected]. Dr. Hung La is with the Advanced Robotics and Automation (ARA) Laboratory, Department of Computer Science and Engineering, University of Nevada, Reno, NV 89557-0312 USA. E-mail:
[email protected]. Dr. Keith Teague is with School of Electrical and Computer Engineering, Oklahoma State University, Stillwater, OK, 74078 USA. E-mail:
[email protected].
have been a lot of technical results shown to refine physical sensors, data processing methods, control algorithms and robot communications for more energy saving in such networks [8], [9], [10], [11], [12]. Propagation maps for mobile devices utilizing WiFi connections are mentioned in [13]. Wireless sensor networks are also used as communication means for mobile robots [14]. Compressed sensing (CS) [15], [16], [17], [18] is based on the idea that the information rate of a signal may be much less than the bandwidth of the signal suggests. The technique is perfectly applicable to sensor readings collected MSNs. Based on the fact that the signal may be represented by far fewer samples than the Nyquist-Shannon sampling theorem would allow, CS exploits this fact and offers to reconstruct all readings from the POIs with a much smaller number of CS measurements (Y = [y1 y2 . . . yM ]T ) compared to the total number of POIs (N ). These measurements are collected as Y = ΦX, where Φ is the sampling matrix, also called measurement matrix. The matrix shows how the data is collected in a sensing field. This will be addressed in the next section. This paper extends our previous study [19]. We consider the problem where a certain number of distributed robots needs to visit a number of POIs in a sensing area to build scalar maps themselves. The team-work of robots, being led by a collaborative control algorithm, samples a sensing area sparsely at each sampling time. At instant time t, the distributed robots add all readings from POIs within their sensing range together and then exchange their own accumulated scalar values attached with the corresponding position indices to each other within their communication range. Each CS measurement created is a sum of all scalar sensor readings measured by the robot working as a connected group. After a certain number of sampling (M ), each robot obtains M CS measurements to be able to reconstruct N sensor readings from the POIs. Note that the number of the measurements is much smaller than the number of POIs (M ≪ N ). Our proposed method is different from the others such as the consensus methods [20], [21], [22], [23], [24] in which most likely require connected networks. Our robotic network may be disconnected sometimes due to the limitation of robot communication range and/or avoiding obstacles on the sensing field. This may result in unequal CS measurements created between different groups of robots, but it does not degrade the performance of recovering data. The total power consumption for robots and the coverage are analyzed and formulated.
2325-5870 (c) 2017 IEEE. Personal use is permitted, but republication/redistribution requires IEEE permission. See http://www.ieee.org/publications_standards/publications/rights/index.html for more information.
This article has been accepted for publication in a future issue of this journal, but has not been fully edited. Content may change prior to final publication. Citation information: DOI 10.1109/TCNS.2017.2754364, IEEE Transactions on Control of Network Systems
2
B. Literature Review The collaboration between robots in MSNs has been studied in [4], [5], [9], [10], [25] with various applications, ranging from monitoring (e.g., pollution prevention, precision agriculture), to event detection (e.g., intrusions, fire/flood emergencies) and target tracking (e.g., surveillance). The mobile robots connect to each other with a limited communication range to exchange their sensed data through their neighbors for programmed purposes. A twostage robot deployment strategy, robots in distant groups are merged into one group that covers a desirable area and robot communications are optimized in terms of expected number of transmissions per successfully delivered packet, has been proposed [26]. Based on some data routing schemes employing CS in wireless sensor networks (WSNs) [27], [28], [29], [30], recently, there exist a few research studies that address the integration between CS and the mobility of sensors. Wang [31] monitored vehicular networks using CS to decrease the communication cost. Mostofi built maps of sensing areas and obstacles/objects using cooperative mobile sensor and robot networks, respectively [32], [33]. The mobile sensors and robots mentioned in the papers are employed outside the sensing areas. In [34], [35], some mobile sensors are deployed randomly in a work space to collect data to create CS measurements. They exchange the measurements between their own neighbors to achieve a sufficient number of CS measurements to reconstruct all data collected from the sensing area. In [36], mobile robots perform independent random walks to collect CS measurements to be able to build scalar maps. We considered consensus methods that are currently being used in sharing data between robots to build scalar maps [21], [24], [22], [4], [5]. In such methods, all sensory data from POIs need to be transferred among the robots which causes a huge communication cost. Additionally, when mobile robots move to visit all the POIs, many POIs are visited more than once that cause redundancy in sampling and moving. Different to the consensus methods [21], [22], our proposed algorithm does not require mobile robots to maintain their connections while moving and collecting data. This feature is new and it can be useful for real world applications where random obstacles may exist and interrupt the network connectivity. Additionally the robotic network only needs to visit certain number of target locations on the field instead of full field coverage to be able to recover the scalar field map based on the fact that our sensory readings are highly correlated. Statement of contributions: The existing work has not mentioned the collaboration between robotic sensors in sharing their accumulative sensing data to form CS measurements. In our proposed method, the robots only need to sample and transmit to each other a much smaller number of samples compared to the total number of POIs (M ≪ N ). Each distributed robot can reconstruct data from POIs based on a certain number of measurements collected. The measurement matrix in CS, also called the routing matrix, and some vital network elements are analyzed to be suggested to optimize the network. The contributions of our paper can be summarized as follows.
1) A new collaborative and compressed mobile sensing algorithm for scalar field mapping at each mobile robot in distributed MSNs is proposed. 2) Power consumption for the robots are modeled and formulated. The sensing coverage is analyzed in detail. 3) Some significant factors of robot networks such as the number of mobile robots, convergence time, communication range and sensing range of robots are analyzed and simulated to minimize the network power consumption. The remainder of this paper is organized as follows. The background and the problem formulation are addressed in Section II. The distributed collaborative control algorithm which is to steer the robots is addressed in Section III. The collaborative and compressed mobile sensing algorithm and some discussions are proposed in details Section IV. The power consumption for robots and the coverage are analyzed in Section V. Experimental and simulation results are shown in Section VI. Finally, conclusions and suggestions for future work are presented in Section VII. II. P RELIMINARIES AND P ROBLEM F ORMULATION A. Model of a Scalar Field A scalar field of interest without considering sensing positions is modeled as Z = [z1 z2 . . . zN ]T ,
(1)
where zi represents one sensor reading collected from one POI or certain types of sensory data at each POI in the field. Since data collected from sensing areas is often highly correlated which is suitable to apply CS, all data from Z should be sorted with indices corresponding to sensing positions. In other words, sensory readings which are highly correlated should be indexed consecutively or closely. The better we can sort the sensing data, the better CS performance we can achieve at each robot. In this paper, we do not discuss how to sort the data. We define a sorting binary matrix AN ×N as each row in A has only one non-zero element, the rest are zeros, e.g., if A(i, j) = 1, the ith row of Z is replaced by the j th . After sorting, we expect to have a new data vector, denoted as X, with all the entries highly correlated as X = AZ.
(2)
B. Compressed Sensing (CS) 1) Presentations of Signals: Compressed sensing (CS) offers a novel paradigm for sampling and recovering sparse signals [15], [16], [17]. The signals can be perfectly recovered based on a much smaller number of samples compared to the total number of the signals. To do so, signals are supposed to be sparse or compressible in proper domains. Consider X ∈ RN (X = [x1 x2 . . . xN ]T ) is a k-sparse vector in the canonical basis if X has k non-zero entries and the rest can be considered as zeros. In other cases when X have most elements which are non-zeros, this vector could be considered as a sparse vector in some domains if X = ΨΘ with Θ has only k non-zero transformed coefficients. Ψ ∈ RN ×N is called the sparsifying matrix.
2325-5870 (c) 2017 IEEE. Personal use is permitted, but republication/redistribution requires IEEE permission. See http://www.ieee.org/publications_standards/publications/rights/index.html for more information.
This article has been accepted for publication in a future issue of this journal, but has not been fully edited. Content may change prior to final publication. Citation information: DOI 10.1109/TCNS.2017.2754364, IEEE Transactions on Control of Network Systems
3 320
2) Creating CS Measurements: The measurement vector Y ∈ RM ( Y = [y1 y2 . . . yM ]T ) includes M CS measurements in which each measurement is linear combinations ∑n of vector X as yi = j=1 φi,j xj and Y = ΦX where Φ ∈ RM ×N is often a full-Gaussian matrix [17] or binary matrix [37]. yi represents on CS measurement collected at each distributed robot and φi,j represents a corresponding entry of Φ. The matrix is often called the sampling matrix or measurement matrix. CS sampling allows M ≪ N . Therefore it is much easier to store, transmit, and retrieve Y compared to the uncompressed X. 3) Data Reconstruction: In order to reconstruct precisely vector X based on Y, a certain number of CS measurements is required as M = O (k log N/k) following the l1 optimization problem given by [17]. The original data can be recovered with high probability as ˆ = Arg M in ∥ Θ ∥1 , Subject to Y = ΦΨΘ. Θ
(3)
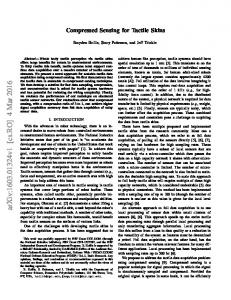
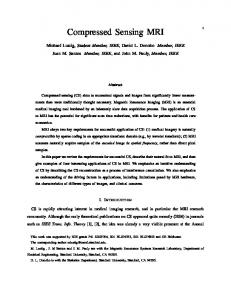
where ∑N X is sparse in Ψ domain as X = ΨΘ with ∥ Θ ∥1 = i=1 |θi |. The l1 optimization problem can be solved with Basis Pursuit (BP) [15]. Noise should be considered in real systems. CS measurements are collected as: Y = ΦX + e , and ||e||2 < ϵ to be able to recover X as follows ˆ = Arg M in ∥ Θ ∥1 , Subject to ∥ Y − ΦΨΘ ∥2 < ϵ. Θ (4) C. Problem Formulation In this section, we first model a network of robots to be able to move in a sensing area and to collect/measure data. Some main parameters for the robots are defined. In order to utilize CS, we present the procedures of exchanging and creating CS measurements between the robots to be able to reconstruct scalar maps based on the CS recovery algorithm at each distributed robot. 1) Network Model: We assume that the sensing field has N random POIs that correspond to N unknown sensory readings for scalar mapping. We also assume L distributed mobile robots work as a group in the area to collect data periodically. There is a collaborative algorithm that leads the robots to cover all the sensing area that would be addressed in the following section. The robots connect wirelessly to each other between a range of Rc , called the communication range. The robots have an equal sensing range, denoted as Rs , that is often set up to be smaller than Rc . In this paper they are chosen as Rs ≤ 21 Rc . Both Rs and Rc of the robots are chosen to be much smaller than the sensing field due to their limited power. Robots are connected through their neighbors to share data to each other. Collaborative control algorithms [6], [38] with predefined virtual leaders are chosen in order to lead the robots to measure data and avoid obstacles and to sample the entire scalar field. As shown in Figure 1(a), the obstacles and the limitation of Rc cause the group of robots not to be fully connected all the time. This does not affect our proposed data collection method which will be analyzed in the following sections. Given an unknown field with N scalar values that need to be observed, the scalar sensory readings are represented
300
280
260
(a)
240
220
200
180
160 150
200
250
300
350
400
450
500
550
200
250
300
350
400
450
500
550
320
300
280
260
(b )
240
220
200
180
160 150
Fig. 1: A group of mobile robots are led by a collaborative algorithm in the sensing field to collect data. They could be formed in different shapes: (a) separated as three groups and (b) fully connected. The red filled circles are obstacles, and the small square is the virtual leader.
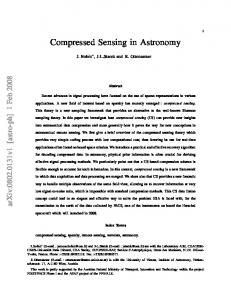
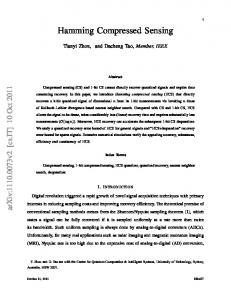
as X ∈ RN ( X = [x1 x2 . . . xN ]T ). Within the time period T , the collaborative algorithm leads the connected group of L distributed robots to measure all of the sensing field. The period T is divided into M time slots as t = T /M . One CS measurement needs to be collected at each robot after one time slot t. The robots start mapping as follows. 2) Data Collection: At a time instant t, each robot can sense a number of POIs within its sensing range Rs in the red circle as shown in Figure 2. As assumed, the distribution of the POIs is random that, on average, the number of POIs measured by each robot is calculated as N πRs2 , (5) S where S is the sensing area. Due to the assumption of Rs ≤ 1 2 Rc , there is no overlapped sensing area between L robots. So, there are about γL POIs sampled at a time instant ∑γ t. Each distributed robot adds all measured data as i=1 xi within a red circle as shown in Figure 2. The figure also illustrates that there are non-overlapped regions measured by the robots. It means that no region or a POI is measured more than once at the same time. 3) Robots Exchange Sensing Data: After adding all scalar values together, the robots share their accumulated readings attached with the corresponding indices of POIs through robot neighborhoods based on the communication range Rc . After a certain number of times sharing data, defined as convergence time, the distributed robots achieve one CS measurement themselves which is a scalar sum of sensory data from all POIs sensed by L mobile connected robots as follows γ L ∑ ∑ yt = xi . (6) γ=
j=1 i=1
Two definitions are provided at this point: Definition 1 (Robot neighbors): two robots are considered neighbors if the Euclidean distance between them is less than or equal their communication range Rc .
2325-5870 (c) 2017 IEEE. Personal use is permitted, but republication/redistribution requires IEEE permission. See http://www.ieee.org/publications_standards/publications/rights/index.html for more information.
This article has been accepted for publication in a future issue of this journal, but has not been fully edited. Content may change prior to final publication. Citation information: DOI 10.1109/TCNS.2017.2754364, IEEE Transactions on Control of Network Systems
4 Sensing range Rs = 5; Communication range Rc = 11
Let pi , v i ∈ ℜ2 denote the position and velocity vectors of the ith robot. For simplicity, the kinematic motion of each robot is modeled as { p˙ i = v i (10) v˙ i = ui , i = 1, 2, ..., L,
230 225 220 215 210 205 200 195 190 185 180 200
210
220
230
240
250
260
Fig. 2: A close view of the robot group in the sensing field. The robots communicate to each other by the blue lines and sense data with within the red circles. The small region in this view may or may not include obstacles.
Definition 2 (Convergence time): The average number of times that each robot shares data with its neighbors until it achieves one CS measurement is called the convergence time, denoted as I. This parameter shows how fast a connected robot group can generate a CS measurement. 4) Robots Moving for other Measurements: As controlled by a collaborative control algorithm with virtual leaders, the group of L distributed robots travel to visit different POIs for collecting data. At another time (t+1), the group creates one more CS measurement following the previous steps (collect and exchange data). After M time slots or the period T (T = M t), one distributed robot stores M CS measurements Y = [y1 y2 . . . yM ] for the CS recovery process. 5) Data reconstruction at each distributed robot: N scalar readings from the unknown POIs are contained in vector X which is compressible or sparse in proper domains as X = ΨΘ,
(7)
T
where Θ = [θ1 θ2 . . . θN ] has k non-zero elements and |θ1 | ≥ |θ2 | ≥ ... ≥ |θN |.
(8)
Ψ referred to as the sparsifying matrix, is an orthogonal basis of RN . If X is a k-sparse vector, Ψ is an identity matrix. Otherwise, Ψ can be chosen from another domain such as wavelet, DCT (discrete cosine transform), etc. Each robot can implement the CS recovery algorithm to find the sparse representation of X as Θ following Equation (3) or (4) with noiseless or noisy CS measurements, respectively. The reconstructed scalar readings at each roots can be built as ˆ ˆ = ΨΘ. X (9) III.
D ISTRIBUTED C OLLABORATIVE C ONTROL A LGORITHM As modeled with the robotic network, there is a dynamic topology of L robots connected as a graph G(V , E) based on their communication range Rc . Where V = {1, 2, ..., L}, called the vertex set, presents all the active mobile robots. The set of edges E = {(i, j) : i, j ∈ V , i ̸= j} is based on the communications between the robots.
where ui is the robot ith control input vector. This equation (10) could be used to model distributed robots that have omni-directional motion capability. Using Rovio robots [39] is one good example. The robot neighborhoods of robot ith are defined at time t as { } Nia (t) = j ∈ V : ∥pj − pi ∥ ≤ Rc , j ̸= i , (11) where ∥.∥ represents Euclidean distances between two robots. The actual neighbors of ith robot, denoted as superscript a, are different from virtual neighbors, denoted as superscript v, in the case of avoiding obstacles. The virtual neighbor set of the ith robot at time t when sensing K obstacles is defined as follows Niv (t) = {k ∈ V o : ∥pik − pi ∥ ≤ R0 , V o = {1, 2, ..., K}} (12) where R0 is the obstacle detection range and V o is a set of obstacles. pik is the position of robot ith projecting on the k th obstacle. For simplicity we use Nia and Niv by dropping t. In order to keep robots away from obstacles, the repulsive force is created by the virtual neighbors. The mobile robots are working as a team. They communicate with their own neighbors for a certain geometry formation (grid or lattice). They can avoid collision between each other and also obstacles based on the distributed collaborative control law ui for each robot which is mentioned in [38], [40], [41]. The law consists of three terms: formation control f fi , obstacle avoidance f oi , and navigation f ni as follows ui = f fi + f oi + f ni . (13) The term f fi is the pair-wise repulsive/attractive action function that allows robots to maintain distances between their own neighbors for collision avoidance. The function is defined as ∑ ∑ aij (p)(v j − v i ), f fi = ca1 ϕa (∥pj − pi ∥σ )nij + ca2 j∈Nia
j∈Nia
(14) where ϕa (.) is the action function addressed in [38]. The σ m - norm, ∥.∥√ =⇒ R+ defined as σ , of a vector is a map R 1 2 ∥z∥σ = ϵ [ 1 + ϵ∥z∥ −1] with ϵ > 0. Unlike the Euclidean norm ∥z∥, which is not differentiable at z = 0, the σ - norm ∥z∥σ , is differentiable every where. This property allows to construct a smooth collective potential function for√sensor nodes. ca1 and ca2 are positive constants, and ca2 = 2 ca1 . In our experiments we selected ca1 = 10. While moving along the scalar field, the obstacle avoidance function of the robotic network is designed to enable the robots to avoid obstacles around. The term f oi in Equation (13) is the repulsive action function for obstacle
2325-5870 (c) 2017 IEEE. Personal use is permitted, but republication/redistribution requires IEEE permission. See http://www.ieee.org/publications_standards/publications/rights/index.html for more information.
This article has been accepted for publication in a future issue of this journal, but has not been fully edited. Content may change prior to final publication. Citation information: DOI 10.1109/TCNS.2017.2754364, IEEE Transactions on Control of Network Systems
5
avoidance purpose, which is defined as ∑ ∑ f oi = co1 ϕo (∥pik −pj ∥σ )nik +co2 bik (p)(v ik −v j ), j∈Niv
j∈Niv
(15) where ϕo (.) is a repulsive action function to lead robots avoiding obstacles as mentioned in [38]. Two vectors nij and nik along the line connect pj to pj and pik to pi , respectively. The adjacent matrices A = [aij ] and B = [bik ] o o are created by the graph √ oG [42]. c1 and oc2 are positive o constants, and c2 = 2 c1 . We selected c1 = 20 in our experiments. Note that pik is the position of the virtual robot or β agent of the actual robot projected on the surface of the obstacle kth . pik is only available when the actual robot detects the obstacle, or f oi is active. To find out β agents (ˆ pik , vˆik ) generated by each actual robot or α agent when it detects the obstacles, we project each each robot to obstacles and find out which shadow of′ that robot on obstacles satisfies the condition ∥ˆ pik −pi ∥ ≤ r , and the obtained pˆik are neighbors of robot i. Equation (16) illustrates the projection method to find the positions and velocities of the β neighbors generated by robot i. pˆik = µpi + (1 − µ)yk , vˆik = µP vi
(16)
where µ = Rk /∥pi − yk ∥. P = I − is the projection matrix with ak = (pi − yk /∥pi − yk ∥) and an unit matrix or identity matrix I. Here, Rk is the radius of the obstacle at its center yk . ak aTk
where cn1 and cn2 are positive constants. These two constants play the same role of the gain of the proportional controller. Hence the larger these constants are, the faster target tracking is. However, if they are too large, the tracking performance has larger overshoot or oscillation. In our experiments, we selected cn1 = cn2 = 4. Adaptive or optimal parameters for cn1 and cn2 can be obtained [43], [44] to allow the robots to track the target faster when it is far from, and to decrease the robot’s speed when approaching to the target. (p(Nia ∪{i}) is calculated as follows p(Nia ∪{i})
1 = |Nia ∪ {i}|
|Nia ∪{i}|
∑
pi ,
where |Nia ∪ {i}| represents total number of neighbors of the robot ith including itself. pt is the target location where the group of robots want to visit to sense data. The large sensing field requires more virtual leaders or target locations to lead the robotic network for sensing coverage. IV.
T HE C OLLABORATIVE AND C OMPRESSED M OBILE S ENSING A LGORITHM (CCMS) In this section, we first analyze the sampling matrix which is directly related to how the robots collect CS measurements. Then the algorithm is addressed in detail. A. Analysis of Measurement Matrix Φ As stated in [15], nearly all matrices could be CS matrices. In effect matrices satisfying the CS conditions are so ubiquitous that it is reasonable to create them by sampling at random from a uniform probability distribution. The condition is referred to as the restricted isometry property (RIP) [16]. Definition: A matrix Φ satisfies the restricted isometry property (RIP) of order k if there exists a δk ∈ (0, 1), called restricted isometry constant, the smallest quality such that (1 − δk )||X||22 ≤ ||ΦX||22 ≤ (1 + δk )||X||22 .
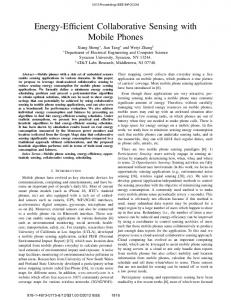
Fig. 3: The projection method for finding the positions and velocities of β- neighbors of each α - sensor.
For example as shown in Figure 3, we have three obstacles O1 , O2 and O3 . After projecting α-robot i on all obstacles, we see that only two shadows (β-neighbors) on the obstacles O1 and O2 satisfying the condition (12). The obstacle O3 ′ is out of obstacle interaction range r , hence there is no shadow of α-robot i on it. Consequently, we found out two β-neighbors (ˆ pi1 , vˆi1 ) and (ˆ pi2 , vˆi2 ) of α-robot i. As mentioned that the scalar field is much greater than the robot sensing range which is limited, the distributed robots are required to move to visit certain POIs and to collaborate to exchange sensing data collected from the field. The navigation function is designed to lead the mobile robots as follows f ni
= −cn1 (pi − pt ) − cn2 (p(Nia ∪{i}) − pt ), (17)
(18)
i=1
(19)
One of the most common matrices that has independent and identically distributed (iid) random variables from a Gaussian probability density function as the matrix elements ϕij with mean zero (’0’) and variance of 1/N [17] as ϕij ∼ N (0, δ 2 = 1/N ). The matrix has useful properties that can recover compressible signals or k-sparse of length N based on only M = O (k log N/k) ≪ N random Gaussian measurements. With random Gaussian sampling matrices, all POIs are sampled for every CS measurement. In a sparse random measurement matrix, only a certain number of row weight signals contribute for one CS measurement as [45] 1 withprob. 2s √ 1 ϕij = s (20) 0 withprob. 1 − 1s 1 . −1 withprob. 2s With s = 3, the matrix can achieve a threefold speedup since only 1/3 of the signals need to be processed. The matrix can be very sparse (s ≫ 3) as mentioned in [46] to speedup that way as far as the total number of non-zero elements becomes smaller.
2325-5870 (c) 2017 IEEE. Personal use is permitted, but republication/redistribution requires IEEE permission. See http://www.ieee.org/publications_standards/publications/rights/index.html for more information.
This article has been accepted for publication in a future issue of this journal, but has not been fully edited. Content may change prior to final publication. Citation information: DOI 10.1109/TCNS.2017.2754364, IEEE Transactions on Control of Network Systems
6
The multiplications of signals and the matrix elements can delay the sampling process. In our method, signals are added up to form CS measurements that simplifies the process. After collecting M CS measurements (Y = ΦX), the sampling matrix is built as a sparse binary matrix as shown in Equation (21). Each row of the matrix corresponds to one CS measurement. Non-zero entries in a row represent POIs sampled by a group of connected robots. It means that the group of robots has the same CS measurement collected from the POIs. 1 0 0 1 0 1 ... 0 0 1 1 0 0 0 ... 1 Φ = 0 0 0 1 1 0 ... 1 (21) ... ... ... ... ... ... ... ... 1 1 0 1 0 1 ... 0 M ×N If all of these L distributed robots are connected as one group through the sampling time, the average row weight of the measurement matrix can be calculated as γL. This means one robot can have data from all the others and the corresponding rows have γL ones (’1’) and (N − γL) zeros (’0’) in each row. According to the way the data (X) is sorted and sampled, this type of matrix can be considered asymptotically random sparse binary. In [47], the isometry condition (RIP) on sparse binary matrices (Φ) establishes its important function in the CS performance. The RIP of random binary matrix has been well studied in [48]. This type of the matrices can satisfy RIP and therefore they could be utilized as energyefficient sampling matrices. The matrices (ΦM ×N ) could perform as well as dense random Gaussian matrices in CS signal reconstruction processes [48]. It means that the matrix created through our proposed data collection method does not degrade the CS performance that will be shown in the simulation section. As mentioned in [49], there is a trade-off between the sparsity of the measurement matrix and the number of CS measurements or the number of rows of the measurement matrix Φ. Intuitively, if the matrix is excessively sparse, the CS performance degrades. It means that if we deploy very few robots, the number of non-zero elements in each row is too small and a fixed number of CS measurements does not contain enough information for the signal reconstruction. In order to guarantee a small error as a target, each robot needs to collect more CS measurements to reduce the reconstruction error. We need to deploy a certain number of robots that build appropriate measurement matrices and should not degrade the CS performance. B. The CCMS Algorithm The proposed collaborative and compressed mobile sensing algorithm has four main phases which are addressed in Algorithm 1. In the Starting phase, all the distributed robots collect sensing data from POIs within their sensing range Rs and add the data as one scalar value. As mentioned, the average number of the POIs sampled by one robot is calculated 2 as γ = N S πRs . In the Phase of sharing data, after finding neighbors within the communication range, the group of connected
Algorithm 1: Collaborative and Compressed Mobile Sensing Algorithm for Distributed Robotic Networks 1. Starting Phase: - X = [x1 x2 . . . xN ]T contains N unknown values. - Y = [y1 y2 . . . xM ]T contains M CS measurements formed at each distribute robot. - S = [s1 s2 . . . sL ] illustrates accumulated data at L distributed robots. At ∑γfirst, one robot has its own data calculated as sj = i=1 xi . - The convergence time of a robot is calculated as IS = [IS1 IS2 . . . ISL ] = zeros(1, L); - L distributed robots have a equal range Rc . - The matrix of neighborhood Q is formed based on direct connections between L robots { 1, if r(i, j) ≤ Rc Q[i, j] = . (22) 0, others 2. Phase of Sharing Data between L connected robots: for k = 1 to L do - A distributed robot finds its neighbors as follows nei = f ind ( Q(k, :) = = 1); - The robot receives and sums up all data including its own readings as s(k) = s(k) + s(nei); - Convergence time counts at each robot as IS (k) = 1; end - The ”new data” for sharing data is considered based on attached positions of POIs. while Robots do not receive new data do for i = 1 to L do if A robot receives new data from any neighbor (j) then - Keep adding data received from neighbors s(i) = s(i) + s(j); - Forward updated data s(j) to its nei; - The convergence time updates as follows IS (i) = IS (i) + 1; end end - Robots update new data from their neighbors end - At the ith robot, the 1st CS measurement is built as y1 = si ; - The convergence time finally updates as follows I = mean(IS ); 3. Phase of Robot Motion: - These distributed robots are led by a collaborative control algorithm in Equation (13). - After M time slots, one distributed robot achieves a sufficient number of CS measurements (M ). 4. Phase of Data Reconstruction: All unknown scalar values of (X) are recovered at each robot based on M CS measurements (Y) following Equation (3) or (4) with noisy or noiseless environment, respectively.
2325-5870 (c) 2017 IEEE. Personal use is permitted, but republication/redistribution requires IEEE permission. See http://www.ieee.org/publications_standards/publications/rights/index.html for more information.
This article has been accepted for publication in a future issue of this journal, but has not been fully edited. Content may change prior to final publication. Citation information: DOI 10.1109/TCNS.2017.2754364, IEEE Transactions on Control of Network Systems
7
robots exchange their own data to the others to build a CS measurement at an instant time t. These distributed mobile robots only collaborate with their own neighbors to share data. The robots only receive and add new data from the others which are recognized by their indices. All the received indices also form a measurement matrix at each robot for the data reconstruction process. After each time of sharing, the convergence time will be increased by one. In the third phase, Moving phase, the robot team is led by the collaborative algorithm to move in the field, as addressed in Section III. It depends on an expected quality of a scalar map reconstructed at each robot, the robots need to visit the POIs to build a sufficient number of CS measurements. The greater the number of CS measurements created at each robot, the better quality of the recovered map. As mentioned, since the sensing data is often highly correlated, the robots may not need to visit all the POIs. In order to satisfy an error target, each robot can be assigned a number of sampling times or the corresponding number of CS measurements. In the last phase, the Phase of Data Reconstruction, each robot spends M time slots and completes forming M CS measurements to be able to build a scalar map itself. In reality, the measurements collected have additive noise. The CS recovery algorithm is able to work with noisy measurements in reconstructing data. In some cases, the group of mobile robots may be separated into smaller groups for avoiding obstacles or due to the limitation of the communication range Rc . This means that CS measurements collected at that sampling time are not equal for all L robots. The measurements from different connected groups are different. Robots from the same neighborhoods should have equal CS measurements. If a robot has a CS measurement different from the others, it means that the row weight of the corresponding row in its measurement matrix is different. As mentioned in [48], this might not affect the CS recovery algorithms depending on the allowable sparsity of the matrix. With the combination of CS and robot collaboration, a distributed robot only needs to create M CS measurements to be able to build a scalar map itself (M ≪ N ). This significantly saves consumed power not only for the communication between robots but also for their motion. V. P OWER CONSUMPTION AND C OVERAGE A NALYSIS A. Power Models of Robots In general, control, sensing and communication are combined in each robot. We formulate generally the power consumption on each main function and then focus on the communication part that applies CS to collect data for scalar maps. 1) Micro-controller and Embedded Computer: A microcontroller directly controls motors, polls readings from sensors and provides programming interface for the embedded computer. Its tasks are often set and the consumed power for the micro-controller could be considered as a constant. The embedded computer is in charge of higher level controls, such as motion planning and coordination. It is more complex than the micro-controller. The power consumption of the embedded computer may be changed for running different programs. Many research studies have
been contributed to simulation-based methods to estimate the power consumption, as shown in [50], [51], [52]. 2) Sensing: There are many types of sensors being used with robots depending on specific purposes. The consumed power for sensing varies from different sensors and sensing frequencies (fs ). We can formulate heuristically the power consumption of sensors as a linear function below ps (fs ) = cso + cs1 fs ,
(23)
where ps is the power consumption for sensing, cso and cs1 are two positive constant coefficients that depend on types of sensors deployed. 3) Motion: DC motors are often used in robots to transform direct current into mechanical energy. Power consuming on the motors is the sum of the mechanical output power and the transforming loss. Denote the robot’s mass as m and the ground friction constant as µ. While a robot traveling with a velocity of v and an acceleration of a, this robot needs a traction force as m(a+f µ). The mechanical power output is calculated as m(a + f µ)v. The power consumption for motion could be formulated as a function of robot velocity, acceleration and mass as follows pm (m, v, a) = pl + m(a + gµ)v,
(24)
where g is the gravity constant and pm is the motion power. pl is the transforming loss. With DC power, this power loss includes eddy-current loss, internal mechanical loss and armature loss. As shown in Equation 24, the power loss increases as the robot speed increases. 4) Communications Power Consumption: Generally, power consumption for transmitting and receiving data in the networks, denoted as PT x and PRx , is calculated, respectively as PT x = PT0 + PA (d) (25) and PRx = PR0 ,
(26)
where PT0 and PR0 are electronics consuming power depending on some elements such as coding, modulation, and signal processing. These factors do not depend on transmitting distances, denoted as d. Only the consumed power of the power amplifier PA (d) is a function of d which is considered to express the power consumption for communications between robots throughout this work. The total power consumption for data transmissions between robots includes some main elements; the intraneighborhood communications, denoted as Pnei , that represents all the communications among all neighborhoods, the convergence time, known as I, and the sufficient number of CS measurements (M ). To create one CS measurement, the robots need to share data with their own neighborhoods. I counts the average number of sharing above until one CS measurement is created. Every distributed robot is required to work through M time slots that corresponds to the sufficient number of CS measurements to be able to reconstruct data. So, the total consumed power can be formulated as follows Ptotal = Pnei × I × M, (27)
2325-5870 (c) 2017 IEEE. Personal use is permitted, but republication/redistribution requires IEEE permission. See http://www.ieee.org/publications_standards/publications/rights/index.html for more information.
This article has been accepted for publication in a future issue of this journal, but has not been fully edited. Content may change prior to final publication. Citation information: DOI 10.1109/TCNS.2017.2754364, IEEE Transactions on Control of Network Systems
8
3000
Ending Configuration 2000
Snapshot 1
1000
Y (m m )
0
-1000
Snapshot 2 -2000
-3000
(a) (a) -4000 -1000
Snapshot 3
Starting Configuration -500
0
500
(b) 1000
1500
X(mm)
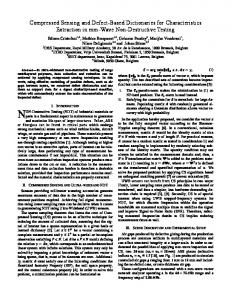
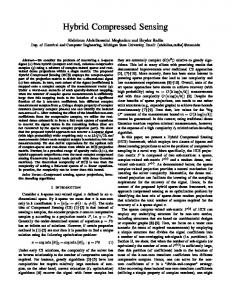
Fig. 4: (Left) Adaptive formation control of multi-robot team to change the shape to pass obstacles: (a) Trajectories of all robots; (b) Snapshots of robot networked formation. (Right) CS sampling: there are 5000 POIs, plotted in magenta color, randomly distributed in the scalar field with dimension of 300 × 300 square units. The group of 50 mobile robots (black triangles) with sensing range that covers circular regions in the red circles travel together along the sensing area to collect data. The robots sample the sensing area at 8 different times and create 08 CS measurements. There are 3 target locations for the navigation function defined in Equation (17) as p1t = [70 50]T , p2t = [250 70]T and p3t = [250 250]T are pre-determined to allow the robotic network to cover the field.
where the consumed power Pnei among L neighborhoods is Pnei = ω × Rcα × L,
(28)
where ω denotes the average number of neighbors of each robot that corresponds to the number of communication links in each robot neighborhood. This number depends on the communication range Rc . As addressed in [53], α is the path loss exponent that can be chosen as 2 ≤ α ≤ 4. We choose α = 2 as the robots working in free space channels throughout this paper. Finally, we have the total power consumption for data transmission as Ptotal = ωRc2 LIM.
(29)
The convergence time can be analyzed based on the robot density and the communication range Rc of robots. The more the number of connected robots, the larger the convergence time. A grid network is formed between a group of connected robots based on the collaborative control algorithm. So, the number connections between the robots is limited. The corresponding convergence time would not change even the range of communication changes. This point is clarified in Figure 6 in the simulation section. B. Coverage Analysis The mobile robots work as a team to sample the area following virtual leaders. The sensing area (S) with a fixed dimension could be fully sampled depending on both the communication range Rc and the sensing range Rs . As mentioned, there is not any overlapping area sampled by more than one robot due to the lattice network and the
assumption of Rs ≤ 12 Rc . So, as we increase Rs and Rc , the sensing area is sampled more at each time instant t. The power consumption also increases. We prefer to minimize both Rs and Rc for the least power consumption and have the coverage fully sampled by the robotic network. At a time instant t, L mobile robots can sample an area as Ct = L × πRs2 .
(30)
Generally, after M time slots, the coverage is sampled by L robots as C = M LπRs2 and C ≫ S. This shows that many POIs in the sensing area are measured more than once at different times of sampling. Besides, since the readings from those POIs are often highly correlated, if there are a few POIs missed, the whole scalar map still can be recovered by the CS recovery algorithm. VI.
E XPERIMENTAL AND S IMULATION R ESULTS
A. Experimental Results of the Flocking Control Algorithm In this section, we deployed 7 Rovio robots to apply the flocking control algorithm addressed in Section III. Figure 4-Left shows the experimental results of the control law (Equation 13) that was applied to a group of mobile robots to collaboratively form and change shapes to efficiently pass through obstacles without collision. As shown in three snapshots, the Rovio robots communicate with their neighbors to go through the obstacle. Their connections and the shape of the group could be changed as they pass the obstacle.
2325-5870 (c) 2017 IEEE. Personal use is permitted, but republication/redistribution requires IEEE permission. See http://www.ieee.org/publications_standards/publications/rights/index.html for more information.
This article has been accepted for publication in a future issue of this journal, but has not been fully edited. Content may change prior to final publication. Citation information: DOI 10.1109/TCNS.2017.2754364, IEEE Transactions on Control of Network Systems
9 Average convergence time versus communication range Rc
B. Simulation Results of Deploying Robots in Scalar Fields
Sensing range R s = 5
[update]
L = 50 L = 100 120
Average convergence time
100
80
60
40
20 10
10.5
11
11.5 12 12.5 13 Communication range Rc
13.5 [unit]
14
14.5
15
Fig. 6: Two robotic groups, 50 robots and 100 robots, are deployed. The convergence time for both groups are calculated with different communication ranges. Total power consumption vs Rc (L = 50; M = 800; I = 45)
9
[unit]
1.8
Total communication power consumption
We consider 5000 POIs randomly and uniformly distributed in a square sensing area 300 × 300 square units. Two different groups of robots are deployed in the sensing area, 50 robots and 100 robots. They are led by the control algorithm as addressed in Section III. We used real data collected from Sensorscope [54]. We chose the sparsifying matrix Ψ as the discrete cosine transform (DCT). As mentioned in [28], DCT sparsifying matrices provide the best CS performance. Figure 4-Right depicts snapshots when 50 robots work as a team to sample the area at different times to create CS measurements. 8 CS measurements are created while the robots are either connected or separated. The robots keep moving and sampling to collect more CS measurement to be able to reconstruct all data from 5000 POIs. This shows that when robots are not connected, they still create CS measurements for their recovery processes. Given the sensing range of Rs = 5, the histogram of the number of POIs sensed by one robot in the field is shown in Figure 5. This can provide to total number of POIs being sampled by L robots at a time instant. We can calculate the average number of POIs following Equation 5 as γ = 5000 2 300×300 3.14 × 5 = 4.36. As mentioned, changing the communication range Rc does not change the convergence time since the robots are formed as lattice networks. As shown in Figure 6, the smaller the number of robots in each group, the smaller the convergence time. So, the 50 robot group would be preferred to reduce power consumption. The question here is if the the group of 50 robots can work as well as the group of 100 robots in building scalar field maps that would be answered later.
140
x 10
1.6
1.4
1.2
1
0.8
0.6 10
10.5
11
11.5 12 12.5 13 Communication range Rc
13.5 [unit]
14
14.5
15
Fig. 7: In the 50 robot group, the total consumed power for data transmission with different communication range Rc .
2500
ber of measurements with a fixed communication range as Rc = 10.
2000
1500
1000
500
0 0
2
4
6
8
10
12
14
Number of positions sampled by each sensor
Fig. 5: The histogram shows the number of POIs covered by a robot. The average number of positions covered by each sensor 5000 sensing range Rs as γ = 300×300 3.14 × 52 = 4.36.
The total power consumption for data transmission in the network of 50 robots for creating 800 CS measurements with different communication ranges (Rc ) is depicted in Figure 7. The smallest the communication range, the smallest the consumed power. Figure 8 depicts the total power consumption for all communications in the 50-robot network with different num-
C. Simulation Results of Scalar Field Mapping As mentioned, sparse binary measurement matrices could work as well as full dense Gaussian matrices [37], [48]. ˆ 2 X∥ Normalized reconstruction error calculated as ∥X− is ∥X∥2 considered in all the recovery processes. Figure 9 depicts different reconstruction errors provided by two sparse binary matrices and a full dense Gaussian matrix. It shows that either 50 or 100 robots with sparse random matrices could work as well as the case when every CS measurement is collected from all POIs (N = 5000) that corresponds to the dense Gaussian matrix. In order to reduce total cost for the network, we can choose the 50-robot network based on this point. A comparison between reconstructed readings on scalar maps built at each robot and the true ones is presented in the 2-D in Figure 10. After collecting 800 CS measurements, the robots can recover the maps with the normalized reconstruction error as 0.1. Figure 11 depicts the true map, the reconstructed map and the error map in 3-D. The true map represents the real data
2325-5870 (c) 2017 IEEE. Personal use is permitted, but republication/redistribution requires IEEE permission. See http://www.ieee.org/publications_standards/publications/rights/index.html for more information.
This article has been accepted for publication in a future issue of this journal, but has not been fully edited. Content may change prior to final publication. Citation information: DOI 10.1109/TCNS.2017.2754364, IEEE Transactions on Control of Network Systems
10
Scalar field mapping based on the original data
Scalar field mapping based on the reconstructed data
3
Error between the true and reconstructed map
3
2
2 1.5 1 0.5 0 300
1 2
Error
Temperature
Temperature
2.5
1
0 300 300
200
-2 300 300
200
200 100 0
0
300
200
200 100
100
Y
0 -1
Y
X
200 100
100 0
0
100 0
Y
X
0 X
Fig. 11: 3-D maps show the true map, the constructed map and the normalized reconstructed error when each distributed robot collects 800 CS measurements. Total power consumption vs M (L = 50; Rc = 10; I = 45)
8
x 10
The true and the reconstructed sensor readings from 5000 positions 3 True sensor readings Reconstructed redings 2.5
9.5 9
Temperature (F)
Total communication power consumption [unit]
10
8.5 8 7.5
2
1.5
1
7 6.5
0.5
6
0 5.5 600
650
700
750 800 850 Number of measurements
900
950
Fig. 8: In the 50 robot network, the total consumed power for data transmission while collecting different number of CS measurements. Compare different measurement matrices 0.16 Full Gaussian matrix Sparse binary matrix (L = 50) Sparse binary matrix (L = 100)
Normalized Reconstruction Error
0.15 0.14 0.13 0.12 0.11 0.1 0.09 0.08 600
650
700
750 800 850 Number of CS measurements
900
950
0
1000
2000
3000
4000
5000
1000
1000
Fig. 9: Comparison between three different sampling matrices: one dense Gaussian matrix, two sparse binary matrices provided by two group of robots: 50 robots and 100 robots.
that should be collected. The reconstructed map is built at each robot based on 800 CS measurements collected that can provide the map with the normalized reconstruction error as 0.1. The third map is the error map that shows the difference ˆ This between the true and the recovered data as (X − X). error map that is quite uniform shows that the CS recovery algorithm can reconstruct data from all POIs in the scalar field equally. * Discussion: As shown in Table I, with the combination of CS and robot collaboration, the group of robots can reduce
Fig. 10: 2-D maps: comparison between the reconstructed map and the true map when a robot collects M = 800 CS measurements sampled by 50-robot team.
a significant amount of energy for transceiving data in the network . Without using CS and a given density of POIs, each robot can measure 4.36 different sensory readings on average and needs to send those readings separately at each round of collecting data. With CS sampling, each robot only needs to send 1 accumulative sample which is the sum of all readings within its sensing range. Eventually, the total number of measurements to be transmitted among the network can be reduced from 250, 000 to 40, 000 utilizing CS when 50 robots are always connected. If they are not connected sometimes, the amount of data could be further reduced and this does not affect the CS performance due to the allowable sparsity of the measurement matrix. Furthermore, the robotic network can also save energy from robot motion while the connections between robots are flexible.
TABLE I: Compare two cases: Using CS and Not using CS for data collection in 50 robot network Total number of robots
Total POIs
Sample sent
Total
need to be
from each
samples
observed
robot
Apply CS
50
5000
1
Not apply CS
50
5000
4.36
sent 50 × 800 = 40, 000 50 × 5000 = 250, 000
2325-5870 (c) 2017 IEEE. Personal use is permitted, but republication/redistribution requires IEEE permission. See http://www.ieee.org/publications_standards/publications/rights/index.html for more information.
This article has been accepted for publication in a future issue of this journal, but has not been fully edited. Content may change prior to final publication. Citation information: DOI 10.1109/TCNS.2017.2754364, IEEE Transactions on Control of Network Systems
11
VII. C ONCLUSIONS AND F UTURE W ORK In the paper, a collaborative and compressed mobile sensing algorithm (CCMS) is proposed for distributed mobile robots to collect data in robotic networks for building scalar maps at each robot. The novel combination between the collaboration of robots and compressed mobile sensing can reduce power consumption for both robot motion and communications. The robots only need to move to collect and transmit a certain amount of sensing data corresponding to a small number of CS measurements to be able to build full scalar field maps. The power consumption for robots and the sensing coverage are analyzed and formulated in detail. Both experimental and simulation results are provided to show the effectiveness of the proposed approach. Either the smallest communication range or the smallest number of robots are recommended for minimizing the total power consumption for such networks. Due to the sparsity needed for the measurement matrix, the number of robots can be reduced to optimize the network cost. In future work, we will deploy the proposed algorithm into real systems and consider all the power consumption arising from robots to evaluate the network cost. Based on that, we can define some main parameters, such as the number of robots, the communication range, etc. to optimize the cost. VIII. ACKNOWLEDGEMENTS This work is supported by Oklahoma State University, Thai Nguyen University of Technology, project DH2017TN02-05. This work is also partially supported by the National Aeronautics and Space Administration (NASA) under Grant No. NNX15AI02H issued through the Nevada NASA Research Infrastructure Development Seed Grant, and the Nevada NASA Space Grant Consortium. R EFERENCES [1] P. Ogren, E. Fiorelli, and N. E. Leonard, “Cooperative control of mobile sensor networks:adaptive gradient climbing in a distributed environment,” IEEE Transactions on Automatic Control, vol. 49, pp. 1292–1302, Aug 2004. [2] B. Liu, O. Dousse, P. Nain, and D. Towsley, “Dynamic coverage of mobile sensor networks,” IEEE Transactions on Parallel and Distributed Systems, vol. 24, pp. 301–311, Feb 2013. [3] C. Tunca, S. Isik, M. Donmez, and C. Ersoy, “Distributed mobile sink routing for wireless sensor networks: A survey,” IEEE Communications Surveys Tutorials, vol. 16, pp. 877–897, Second 2014. [4] H. M. La and W. Sheng, “Distributed sensor fusion for scalar field mapping using mobile sensor networks,” IEEE Transactions on Cybernetics, vol. 43, pp. 766–778, April 2013. [5] H. M. La, W. Sheng, and J. Chen, “Cooperative and active sensing in mobile sensor networks for scalar field mapping,” IEEE Transactions on Systems, Man, and Cybernetics: Systems, vol. PP, pp. 1–1, May 2014. [6] H. M. La, R. Lim, and W. Sheng, “Multirobot cooperative learning for predator avoidance,” IEEE Transactions on Control Systems Technology, vol. PP, pp. 1–1, April 2014. [7] K. M. Lynch, P. Yang, and R. A. Freeman, “Decentralized environmental modeling by mobile sensor networks,” IEEE Trans. on Robotics, vol. 24, pp. 710–724, Jun. 2008. [8] J. Cortes, “Distributed Kriged Kalman filter for spatial estimation,” IEEE Trans. on Auto. Control, vol. 54, no. 12, pp. 2816–2827, 2009. [9] J. Choi, S. Oh, and R. Horowitz, “Distributed learning and cooperative control for multi-agent systems,” Automatica, vol. 45, no. 12, pp. 2802–2814, 2009.
[10] F. Zhang and N. E. Leonard, “Cooperative filters and control for cooperative exploration,” IEEE Transactions on Automatic Control, vol. 55, pp. 650–663, March 2010. [11] R. Graham and J. Cortes, “Spatial statistics and distributed estimation by robotic sensor networks,” American Control Conf., pp. 2422– 2427, 2010. [12] S. Li, R. Kong, and Y. Guo, “Cooperative distributed source seeking by multiple robots: Algorithms and experiments,” IEEE/ASME Transactions on Mechatronics, vol. 19, pp. 1810–1820, Dec 2014. [13] T. Dumont and S. L. Corff, “Simultaneous localization and mapping in wireless sensor networks,” Signal Processing, vol. 101, pp. 192 – 203, 2014. [14] G. Tuna, V. c. G¨ung¨or, and S. M. Potirakis, “Wireless sensor networkbased communication for cooperative simultaneous localization and mapping,” Comput. Electr. Eng., vol. 41, pp. 407–425, Jan. 2015. [15] D.L.Donoho, “Compressed sensing,” IEEE Transactions on Information Theory, vol. 52, pp. 1289 – 1306, 2006. [16] E. Candes, J. Romberg, and T. Tao, “Robust uncertainty principles: exact signal reconstruction from highly incomplete frequency information,” IEEE Transactions on Information Theory, vol. 52, pp. 489 – 509, Feb. 2006. [17] R. Baraniuk, “Compressive sensing [lecture notes],” Signal Processing Magazine, IEEE, vol. 24, pp. 118 –121, July 2007. [18] T. Do, L. Gan, N. Nguyen, and T. Tran, “Fast and efficient compressive sensing using structurally random matrices,” IEEE Transactions on Signal Processing, vol. 60, pp. 139–154, Jan 2012. [19] M. T. Nguyen, H. M. La, and K. A. Teague, “Compressive and collaborative mobile sensing for scalar field mapping in robotic networks,” in Communication, Control, and Computing (Allerton), 2015 53rd Annual Allerton Conference on, (Illinois, USA), Sept. 2015. [20] R. Olfati-Saber and R. M. Murray, “Consensus problems in networks of agents with switching topology and time-delays,” IEEE Transactions on Automatic Control, vol. 49, pp. 1520–1533, Sept 2004. [21] W. Ren, R. Beard, and E. Atkins, “A survey of consensus problems in multi-agent coordination,” in American Control Conference, 2005. Proceedings of the 2005, pp. 1859–1864 vol. 3, June 2005. [22] E. Kokiopoulou and P. Frossard, “Distributed classification of multiple observation sets by consensus,” IEEE Transactions on Signal Processing, vol. 59, pp. 104–114, Jan 2011. [23] R. Aragues, J. Cortes, and C. Sagues, “Distributed consensus on robot networks for dynamically merging feature-based maps,” IEEE Transactions on Robotics, vol. 28, pp. 840–854, Aug 2012. [24] F. Muoz, E. S. Espinoza Quesada, H. M. La, S. Salazar, S. Commuri, and L. R. Garcia Carrillo, “Adaptive consensus algorithms for realtime operation of multi-agent systems affected by switching network events,” International Journal of Robust and Nonlinear Control, vol. 27, no. 9, pp. 1566–1588, 2017. rnc.3687. [25] H. La, T. Nguyen, T. D. Le, and M. Jafari, “Formation control and obstacle avoidance of multiple rectangular agents with limited communication ranges,” IEEE Transactions on Control of Network Systems, vol. PP, no. 99, pp. 1–1, 2016. [26] B. Ning, J. Jin, B. Krishnamachari, J. Zheng, and Z. Man, “Twostage deployment strategy for wireless robotic networks via a class of interaction models,” IEEE Transactions on Systems, Man, and Cybernetics: Systems, vol. PP, no. 99, pp. 1–12, 2016. [27] M. T. Nguyen, “Minimizing energy consumption in random walk routing for wireless sensor networks utilizing compressed sensing,” in 2013 8th International Conference on System of Systems Engineering (SoSE), pp. 297–301, June 2013. [28] M. T. Nguyen and N. Rahnavard, “Cluster-based energy-efficient data collection in wireless sensor networks utilizing compressive sensing,” in Military Communications Conference, MILCOM 2013 - 2013 IEEE, pp. 1708–1713, Nov 2013. [29] M. T. Nguyen and K. Teague, “Compressive sensing based data gathering in clustered wireless sensor networks,” in 2014 IEEE International Conference on Distributed Computing in Sensor Systems (DCOSS), pp. 187–192, May 2014.
2325-5870 (c) 2017 IEEE. Personal use is permitted, but republication/redistribution requires IEEE permission. See http://www.ieee.org/publications_standards/publications/rights/index.html for more information.
This article has been accepted for publication in a future issue of this journal, but has not been fully edited. Content may change prior to final publication. Citation information: DOI 10.1109/TCNS.2017.2754364, IEEE Transactions on Control of Network Systems
12
[30]
[31]
[32]
[33]
[34]
[35]
[36]
[37] [38]
[39] [40]
[41]
[42]
[43]
[44]
[45]
[46]
[47]
[48]
[49]
[50]
M. T. Nguyen, K. Teague, and N. Rahnavard, “Inter-cluster multi-hop routing in wireless sensor networks employing compressive sensing,” in Military Communications Conference (MILCOM), 2014 IEEE, pp. 1133–1138, Oct 2014. H. Wang, Y. Zhu, and Q. Zhang, “Compressive sensing based monitoring with vehicular networks,” in INFOCOM, 2013 Proceedings IEEE, pp. 2823–2831, April 2013. Y. Mostofi, “Compressive cooperative sensing and mapping in mobile networks,” IEEE Transactions on Mobile Computing, vol. 10, pp. 1769–1784, Dec 2011. Y. Mostofi, “Cooperative wireless-based obstacle/object mapping and see-through capabilities in robotic networks,” IEEE Transactions on Mobile Computing, vol. 12, pp. 817–829, May 2013. M. T. Nguyen and K. A. Teague, “Random sampling in collaborative and distributed mobile sensor networks utilizing compressive sensing for scalar field mapping,” in System of Systems Engineering Conference (SoSE), 2015 10th, pp. 1–6, May 2015. M. T. Nguyen and K. A. Teague, “Compressive and cooperative sensing in distributed mobile sensor networks,” in Military Communications Conference, MILCOM 2015 - 2015 IEEE, pp. 1033–1038, Oct 2015. R. Hummel, S. Poduri, F. Hover, U. Mitra, and G. Sukhatme, “Mission design for compressive sensing with mobile robots,” in 2011 IEEE International Conference on Robotics and Automation (ICRA), pp. 2362–2367, May 2011. R. Berinde and P. Indyk, “Sparse recovery using sparse random matrices,” MIT-CSAIL Technical Report, 2008. R. Olfati-Saber, “Flocking for multi-agent dynamic systems: algorithms and theory,” IEEE Transactions on Automatic Control, vol. 51, pp. 401–420, March 2006. http://www.wowwee.com/en/support/rovio. H. M. La and W. Sheng, “Flocking control of a mobile sensor network to track and observe a moving target,” Proc. of the 2009 IEEE Inter. Conf. on Robotics and Automation, pp. 3129–3134, 2009. H. M. La and W. Sheng, “Dynamic targets tracking and observing in a mobile sensor network,” Robotics and Autonomous Sys., pp. 996– 1009, 2012. F. Bullo, J. Cortes, and S. Martinez, “Distributed control of robotic networks,” Ser. Applied Mathematics Series. Princeton University Press, 2009. H. M. La, T. H. Nguyen, C. H. Nguyen, and H. N. Nguyen, “Optimal flocking control for a mobile sensor network based a moving target tracking,” in 2009 IEEE International Conference on Systems, Man and Cybernetics, pp. 4801–4806, Oct 2009. H. M. La, R. S. Lim, W. Sheng, and H. Chen, “Decentralized flocking control with a minority of informed agents,” in 2011 6th IEEE Conference on Industrial Electronics and Applications, pp. 1851– 1856, June 2011. D. Achlioptas, “Database-friendly random projections,” in Proceedings of the Twentieth ACM SIGMOD-SIGACT-SIGART Symposium on Principles of Database Systems, PODS ’01, (New York, NY, USA), pp. 274–281, ACM, 2001. P. Li, T. J. Hastie, and K. W. Church, “Very sparse random projections,” in Proceedings of the 12th ACM SIGKDD International Conference on Knowledge Discovery and Data Mining, KDD ’06, (New York, NY, USA), pp. 287–296, ACM, 2006. E. Candes and T. Tao, “Decoding by linear programming,” IEEE Transactions on Information Theory, vol. 51, pp. 4203–4215, Dec 2005. R. Berinde, A. C. Gilbert, P. Indyk, H. J. Karloff, and M. J. Strauss, “Combining geometry and combinatorics: A unified approach to sparse signal recovery,” CoRR, vol. abs/0804.4666, 2008. W. Wang, M. Garofalakis, and K. Ramchandran, “Distributed sparse random projections for refinable approximation,” in IPSN 2007. 6th International Symposium on Information Processing in Sensor Networks, 2007., pp. 331–339, April 2007. J. Lorch and A. Smith, “Apple macintosh’s energy consumption,” Micro, IEEE, vol. 18, pp. 54–63, Nov 1998.
[51] T. Simunic, L. Benini, and G. De Micheli, “Cycle-accurate simulation of energy consumption in embedded systems,” in Design Automation Conference, 1999. Proceedings. 36th, pp. 867–872, 1999. [52] P. Pillai and K. G. Shin, “Real-time dynamic voltage scaling for low-power embedded operating systems,” SIGOPS Oper. Syst. Rev., vol. 35, pp. 89–102, Oct. 2001. [53] T. S. Rappaport, Wireless Communications: Principles and Practice (2nd Edition). Prentice Hall, 2 ed., Jan. 2002. [54] http://lcav.epfl.ch/op/edit/sensorscope en.
Minh T. Nguyen received his B.S., M.S. and PhD degrees in Electrical Engineering from Hanoi University of Communication and Transport, Hanoi, Vietnam in 2001, Le Quy Don Technical University, Hanoi, Vietnam in 2007, Oklahoma State University, Stillwater, OK, USA, in 2015, respectively. Dr. Minh Nguyen is currently the director of International training and Cooperation center at Thai Nguyen University of Technology, Vietnam, and also the director of Advanced Wireless Communication Networks (AWCN) Lab. He has interest and expertise in a variety of research topics in the communications, networking, and signal processing areas, especially compressive sensing, and wireless/mobile sensor networks. He serves as technical reviewers for several prestigious journals and international conferences.
Hung M. La (IEEE SM’2014, M’2009) received his B.S. and M.S. degrees in Electrical Engineering from Thai Nguyen University of Technology, Thai Nguyen, Vietnam, in 2001 and 2003, respectively, and his Ph.D. degree in Electrical and Computer Engineering from Oklahoma State University, Stillwater, OK, USA, in 2011. He is the Director of the Advanced Robotics and Automation (ARA) Lab, and Assistant Professor of the Department of Computer Science and Engineering, University of Nevada, Reno, NV, USA. From 2011 to 2014, he was a Post Doctoral research fellow and then a Research Faculty Member at the Center for Advanced Infrastructure and Transportation, Rutgers University, Piscataway, NJ, USA. Dr. La is an Associate Editor of the IEEE Transactions on Human-Machine Systems, and Guest Editor of International Journal of Robust and Nonlinear Control.
Keith A. Teague serves as Professor in the School of Electrical and Computer Engineering at Oklahoma State University and Faculty Affiliate in the School of International Studies and Outreach. Dr. Teague’s research interests include wired and wireless communication systems, secure voice over IP, low rate speech coding, topics related to information assurance and security, and engineering education. He has an established record of funded research dealing with future secure wired and wireless communications technologies, modeling and simulation of secure wireless communications systems, speech coding, and enhancement of engineering education. Dr. Teague has a special interest in international academic collaborations and partnerships, particularly in Asia where he has traveled extensively. Dr. Teague received the Ph.D. in Electrical Engineering, specializing in digital signal processing, from Oklahoma State University in 1984. He has authored or co-authored more than 50 technical articles. Dr. Teague is a member of Eta Kappa Nu and Tau Beta Pi, a senior member of IEEE, and a Registered Professional Engineer in Oklahoma.
2325-5870 (c) 2017 IEEE. Personal use is permitted, but republication/redistribution requires IEEE permission. See http://www.ieee.org/publications_standards/publications/rights/index.html for more information.