228
Problems and Perspectives in Management, 2/2004
Collaborative Continuous Improvement Programs in Supply Chain Hamid Noori1 Abstract This paper presents findings from an exploratory study that investigates the extent to which Continuous Collaborative Improvement (CCI) activities are implemented in the supply chains of Canadian industries. Several Canadian industries including the automotive, electronics and aerospace sectors were examined to determine: (i) what CCI activities were initiated, (ii) which supply chain nodes were the most proactive in establishing these endeavors, (iii) what are the most effective collaborative tools and processes, and (iv) the effect such tools would have on the supply chain performance of participating companies. The results indicate that Canadian companies are placing greater strategic importance on supply chain performance. Supply chain nodes are engaging in joint strategic planning to a greater extent than they did a decade ago. However, certain industries such as the automotive and aerospace sectors are decidedly more integrated, as cost control and on-time deliveries are strategic imperatives in these businesses. The efforts are being initiated more at the customer level than at the upstream supplier nodes. The most effective tools are quality standards such as ISO 9000, EDI usage, improvements process such as JIT and lean manufacturing, and the establishment of performance targets for suppliers. These efforts are resulting in improvements in variables such as quality, lead-time, on-time delivery and cost and operational efficiencies. Key Words: collaborative continuous improvement programs, supply chain management, total quality management.
1. Introduction In the 1980s, manufacturing organizations viewed the supply chain as an afterthought of corporate strategy. The supply chain was merely a means to serving a market, and it consisted of numerous individual players. During the last ten years global competition has given customers more choices in many product markets and that in turn has compromised the concept of customer loyalty. Today, customers have elevated product and service expectations regarding lead-time, quality and cost. Initially, these significant changes in the industrial landscape forced downstream manufacturing companies in order to impose stringent requirements on their suppliers. They were able to use contracts as levers to drive down input prices, and this effectively exploited the suppliers’ dependence on the large downstream manufacturing firm. However, it soon became clear that this was not a long-term solution to the technological and competitive forces facing the manufacturing sector. Collaboration among supply chain participants was the answer to these new environmental realities. Globalization and increased customer expectations had transformed the supply chain into an integral element of corporate strategic planning. If supply chain players worked together and managed the process properly, it could become a source of sustainable competitive advantage. Recently, much attention has been paid to network cooperation and collaboration and the role they can play in enhancing a company’s ability to remain competitive. According to Strzelec (2002), network collaboration, using the advancements in information technology, enables companies to be successful in one-to-one collaboration as well as one-to-many supply chain collaborations. This will inevitably result in better efficiencies, better trading relationships, improve service levels and, therefore, improved bottom lines.
1
Laurier Business School Wilfrid Laurier University Waterloo, Ontario N2L 3C5
[email protected]
Problems and Perspectives in Management, 2/2004
229
While the notion of collaboration and partnership has been widely discussed, it is also true that the concept is less understood and is a difficult and complicated process to implement (Dyer et al, 1998; Noori, et al., 1999). To better understand the factors influencing the collaboration efforts, we have developed a framework, dubbed “Collaborative Continuous Improvement” (CCI) model, which is placed in the context of Deming’s “Plan-Do-Check-Act” (PDCA) framework1. The model consolidates many of the concepts found in contemporary literature on collaborative supply chain management (see Temkin, 2002, and Dyer et al., 1998). This paper reports on a questionnaire survey that was developed basing on the CCI model to explore the level of success achieved in collaborative continuous improvement activities as measured by improvements in cost, quality, on-time delivery and lead-time. The objective was to uncover the most significant collaborative efforts in the Canadian manufacturing sector and to rank the relative importance of the elements of the CCI model. Additionally, the survey was designed to answer the following questions regarding the participants and beneficiaries of CCI improvement efforts: 1. Who within the value chain is driving continuous supply chain improvement? 2. What activities and tools are customers and suppliers embracing? 3. Which collaborative activities in the value chain are yielding the greatest benefits to organizations? 4. What is the strategic role of CCI as perceived by customers and suppliers in the value chain? The structure of the paper is as follows. Section 2 provides a short review of the related literature. The analysis of the survey is given in Section 3. Section 4 provides an examination of the results of the eight-industry analysis and Section 5 provides an interpretation of these results. Finally, Section 6 concludes the paper.
2. Literature Review To develop a responsive supply chain, continuous collaborative improvement among firms has become strategic imperative. This collaboration is occurring in many industries and has become the source of competitive advantage for some companies. “Competition is no longer company to company, but supply chain to supply chain” (Grossman, 1997). The Canadian Food and Beverage Processors (CFBP) is a case in point in that companies in this industry are beginning to recognize that the CCI programs among the participants in supply chain are a crucial component for success. In a recent study (Ernst & Young, 1998), 75 participated companies indicated that they saw a change in the environment from a sales focus to an integrated supply chain management (ISCM) service focus. The CFBP reinforced the need to have close relationships with supply chain members to get the best possible service at the lowest price. One key to achieving close relationships in the channel is to have a solid understanding of the supply chain members and their respective corporate cultures. Rather than following the just-in-time model and imposing penalties for late delivery in supply chains, “the better solution is to work together to identify and fix problem areas, take out non-value-added components and get the cost down and service level up.” Tompkins et al. (1998) have emphasized the importance of continuous improvement processes within the value chain and subsequently coined the term “Supply Chain Synthesis” (SCS). This is a continuous improvement process that ensures the satisfaction of all players in the supply chain from original raw material providers to the finished product consumer. In the traditional Supply Chain Management (SCM) model a particular node manages its own upstream and downstream performance attempting to maximize its own effectiveness and value. For example, a supplier will examine its customer’s requirements over time to ascertain how it can better meet the needs of the client organization. The main goals of this analysis are re-
1 To read about PDCA framework see for example Balanced Scorecard Institute at: http://www.balancedscorecard.org /bscit/intranet/pdca.html
230
Problems and Perspectives in Management, 2/2004
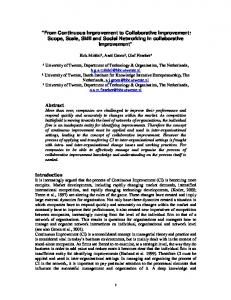
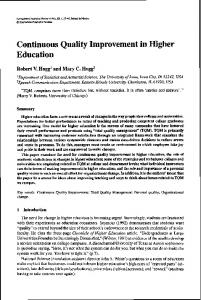
ductions in cost and inventory, improved delivery time and improved quality. In the SCM model, efforts to improve supply chain responsiveness remain at the level of a single node. In contrast, the SCS model advocates the creation of teams of suppliers, manufacturers and retail customers who share information to improve the performance and effectiveness of the whole chain. SCS enables the various links of the entire supply chain to work together in response to changing consumer needs and trends. The SCM model can be applied to a supply chain orientation that is either a “pull” or a “push” system. However, the orientation of the SCS model can be a “pull” system, a “push” system or a combination of both. In a recent paper, Carter et al. (2000) provide a ten-year forecast of purchasing and supply trends and report that supply chain integration would continue to proliferate as a means to more lean and competitive supply chains. “Resources will be increasingly divided among highly interdependent firms that rely on each other as customer/supplier in the supply chain to maximize value-added contributions and reduce duplication of resources.” The forecast further discussed relationship building in the channel as a means to improve supply chain as a source of competitive advantage. All aspects of collaboration will be exploited such as trust building, communications, joint efforts, and planning and fostering interdependency. Supply chain nodes will manage these elements jointly in an effort to continuously improve and to ultimately increase competitiveness. The researchers supported these predictions with empirical research methods outlined in the article. However, they did qualify that these trends of supply chain collaboration and integration will be slow and difficult. These trends will not be embraced or implemented by the entire manufacturing sector overnight. There are other researchers who concur with this notion. Despite the argument in favour of joint collaborative efforts among the participants in supply chain, the concept has not been fully embraced by the entire business world according to Tompkins et al. (1998). One of his findings includes a surprising statement that 80% of North American executives believed that suppliers should not be included in their efforts to improve their own organizational effectiveness. They felt that improvements should come from within their own company. Executives on other continents agreed, while 87% of Asian Pacific managers and 92% of South American managers believed that these organizational improvements should be developed in-house. Vonderembse & Tracey (1999) conducted a research study on the impact of supplier selection and involvement on manufacturing performance. They concluded that the level of supplier involvement in continuous improvement activities and in product development efforts is low in North American supply chains. Although many managers acknowledge the need for enhanced relationships in the channel, it is not being implemented consistently in the manufacturing sector. However, their statistical analysis uncovered a “high correlation between the supplier involvement questions and the supplier performance questions, which indicate strong positive relationships.” The two researchers felt that increased company/supplier involvement may have significant impact on supply chain performance. Other authors have also looked at different aspects of collaborations. Among them are: development of a methodology for designing a multi-partner SC system for HP (Calliono and Billington, 2001), examining the impact of fixed and variable costs on the structure and competitiveness of supply chains (Corbett and Karmarkar, 2001), studying the impact of collaborative forecasting initiatives on the supply chain (Yossi, 2001), and the use electronic data integrator (EDI) to improve efficiencies of inter-firm coordination of activities involving suppliers and customers (Hill and Scudder, 2002). To sum it up, to foster continuous improvement in the supply chain, the participants must share the same vision and have a solid spirit of teamwork and partnership (Dornier et al., 1998). This research paper will determine the extent to which this cooperation is occurring in the Canadian manufacturing sector. The CCI model was employed as the basis for developing a series of questions that were used to survey the Canadian Manufacturing sector. The CCI model is comprised of the following four elements (Figure 1): (a) relationships, (b) communications, (c) shared resources, and (d) continuous improvement activities. Each of
Problems and Perspectives in Management, 2/2004
231
these elements is integral in securing an effective collaborative effort. These elements are applicable at each level of the supply chain from upstream suppliers to downstream customers. To ensure the integrated improvement and responsiveness of the supply chain at large, a formal program that cultivates these values in the original equipment manufacturers (OEMs) down through the supply base tiers en route to the final participant can be implemented.
3. The Survey A. Development of the Survey Instrument A questionnaire was developed by using the CCI model to determine how the various supply chain members are collaborating. It was designed to pose clear questions and to take fifteen to twenty minutes to complete. Once the questionnaire had been designed, individuals from industry who had significant experience in supply chain management reviewed it. These practitioners also held a thorough understanding of the policies and procedures employed in the procurement of goods and services in their respective firms. Next, the proposed questionnaire was submitted to individuals in academia who had a particular interest in operations and supply chain management. These two groups of people evaluated the document for clarity, content and completion time. The final version of the questionnaire analyzed the feedback of all participants in the pilot study. The questionnaire consisted of six sections including an introductory section describing the intent of the survey and what was expected of the respondents. It indicated that respondents could remain anonymous, or they could include their name and address in the survey to have results forwarded to them in appreciation of their participation. For the purposes of this research effort, “the firm”, was defined as, “a business unit having an identifiable business strategy, a distinct top management group, and one or more target markets.” Each section of the questionnaire contained between 13 and 20 questions. The questions were designed to view participation and activities from both customer and supplier perspectives. The demographic section included both open-ended and close-ended questions. In the rest sections, a multiple-choice format was employed. All of the non open-ended questions were posed with five possible answers: (1) = not at all; (2) = to a little extent; (3) = to a moderate extent; (4) = to a great extent; and (5) = to a very great extent. The answers ranked the extent to which a surveyed firm participated in collaborative continuous improvement activities. B. Sample Selection A random sample of 1,140 companies was chosen from a comprehensive database of Canadian manufacturers supplied by Industry Canada. The sample included companies with annual sales of ranging from $5 million to $5 billion. The survey was mailed with a cover letter detailing the deadline for submission and a stamped return envelope. The questionnaire was only mailed to companies in English speaking Canada, as the time and costs associated with accurate translation of the document were prohibitive. The survey resulted in 216 useful responses, which constitutes an acceptable 19% response rate. The data were coded by using an alphanumeric scheme that allowed researchers to analyze the five categories described earlier in the paper. C. Characteristics of the Respondents Table 1 provides a breakdown of the respondents by industry. The “other” category is comprised of those responding firms that cannot be classified under any of the seven major industries. Further analysis of responses with respect to company size, sales, markets, and organizational structure and performance measures is provided in Table 2. Sales have been divided by geography, (Canada, U.S. and other), and by sectors, (consumer, business and government), to provide additional insight into the responses. Organizational structure is indicative of workforce composition and it also conveys the working environment in each industry.
Purchasing Strategic Planning
Collaborative Continuous Improvement Model Relationships x Single source x Long-term contracts x Fewer suppliers Communications x Supplier symposia/councils x Early supplier involvement x Information sharing, EDI x Joint planning Shared Resources x Cross functional design teams x Cross functional CI teams x On site representative x Commodity teams Continuous Improvement Activities x Seven quality tools x Statistical process control x Just in time manufacturing x Lean manufacturing x Kanban replenishment x Kaizen x Pull system/Dem and flow
DO
ENABLERS x Common Communication Platforms x Common Information Platforms x Shared Data Bases x Trained Knowledgeable Buyers & Suppliers x Quality Systems (ISO 9000, QS 9000)
Fig. 1. Proposed Collaborative Continuous Improvement Model
CHECK
ACT
Supplier Strategic Planning
Measure and Monitor Results
Steering Committee
PLAN
Feedback to Steering Committee Document & Formalize Improvements
Baseline Measurement x Cycle Time x Lead Time x Quality x Number of Suppliers
Organization Strategic Planning
DRIVERS x Global Competition x Customer Demands o Shorter lead time o Lower cost o Improved quality
232 Problems and Perspectives in Management, 2/2004
233
Problems and Perspectives in Management, 2/2004
Table 1 Breakdown of Respondents by Industry Industry
Number of Respondents
Automotive
31
Metal Processing
27
Food Processing
25
Industrial Machinery
19
Chemical
18
Electronics
10
Aerospace
6
Other
80
Table 2 Demographics Industry
Auto
Metals
Food
Machinery
Chemicals
Electronics
Aerospace
Others
115.4
99.72
150.4
59.5
242.7
94.4
115
153.2
29
54.5
76
50
49
31.3
33.5
67.18
U.S. Sales (%)
64.4
38.5
15.1
29.2
39.1
31.3
48
25.75
Other Sales (%)
6.8
5.1
8.9
22.4
12.3
10.8
18.5
8
Sales to Consumers (%)
8.6
20.2
46.8
12.1
11.2
10.5
3.3
29.7
Sales to Business (%)
88.3
74.6
51.9
85.4
86.6
70.5
38
62.6
Sales to Government
3.1
5.3
1.3
7.6
2.2
19
58.7
7.8
789
303
428
205
410
351
667
599
Sales and Markets
Average Annual Sales ($000,000) Domestic Sales (%)
Organizational Structure
Average number of employees Supervisors (% Workforce)
10.15
11.2
12.7
16
16
15.7
13.7
13.6
Represented by Union (% Workforce)
44.3
53.7
30.7
21.3
33.4
12.5
37.5
48.4
Post Secondary Education (% of non sup.)
25.8
12.1
18.5
43
27.8
71.1
41.7
23.4
Performance Measures
Avg. Annual Sales per Employee ($000)
233.8
341.8
369
345.6
492.2
301.8
189
324
Avg. MRO Suppliers
92
382
79
417
58
113
313
381
Avg. Inventory Suppliers
72
52
47
125
158
228
480
372
234
Problems and Perspectives in Management, 2/2004
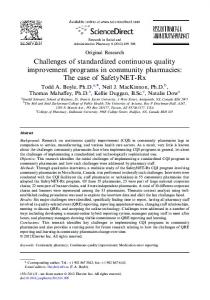
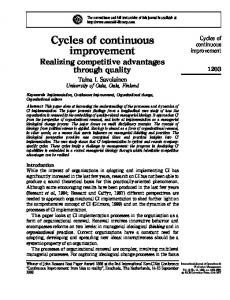
4. Analysis of the Results Tables 4-8 display how the different CCI activities vary across industrial boundaries. The arithmetic mean for each response was calculated for each question to determine the average level of involvement in the particular aspect of the CCI model, within each industry1. These tables illustrate the extent to which the different aspects of the CCI model are adopted in the various industries. They also examine the results of these collaborative activities. The results can be interpreted to assess each industry’s priorities with respect to CCI. Table 3 summarizes the results presented in Tables 4-7 different industries and matches each industry with each criterion of collaborative continuous improvement in the supply chain. The observations below, and the consequent discussion provided in Section 5, seek to enhance this tabular presentation of the survey results. Given the methodology applied for data analyses, we provide it in the context of the exploratory nature of this study. Future research is required to delve into these observations and offer more detailed and plausible answers. The discussion is presented in the framework of the elements of supply chain collaboration and based on the results summarized in Tables 4-7 : customer imposed continuous improvement activities (Tables 4), collaborative efforts imposed on suppliers, collaborative efforts agreed by all the participants (Tables 5), strategic role of CCI (Tables 6), and impact of CCI initiatives on performance (Tables 7). 4.1. Customer Influenced Continuous Improvement Activities The suppliers in the automotive industry were the most that demanded or influenced their downstream customers to adhere to their continuous improvement requirements. Customers in the aerospace industry were also active in stipulating supply chain improvement requirements to their suppliers. This is not surprising since the automotive producers have considerable channel power and aerospace customers are typically paying for a customized product. In contrast, electronics industry customers, metal processing customers and those in the industrial machinery sector showed little interest in initiating collaborative supply chain efforts. This could be because of the fact that their products are somewhat commoditized and further efficiencies will not reduce costs significantly. In the chemical and food processing industry, customers showed a moderate level of initiative in demanding supply chain improvement activities from their upstream suppliers. In all of these industries the activities most implemented by customers included ISO 9000 certification, quality standard establishment, consistent price reductions in the channel, and the use of EDI for more efficient inventory flows. 4.2. Collaborative Efforts Imposed by the Firm on its Suppliers In contrast, automotive firms are less apt to require their suppliers to participate in ‘collaborative’ activities. The metal processing and industrial machinery industries also ranked as very low in this section of the survey. Aerospace companies were the third most active among all industries in imposing collaborative supply chain requirements on suppliers. Ahead of this industry were the food processing, chemical and electronics sectors. Electronics firms typically develop cross-functional teams with suppliers to share market demand information. This is necessary to combat the bullwhip effect in an industry with many supply chain nodes from retail to wholesale to producer. Chemical companies generally require suppliers to have on-site personnel at their chemical processing plants. In general, the major collaborative activities imposed by the customer on its suppliers include cross-functional teams, JIT, TQM and a sharing of statistical and demand data.
1 Admittedly, the arithmetic mean is not the ideal measurement technique and does not accurately reflect the respondents’ extent of activities along the factors studied in this research. However, assuming that the data accurately measures activity and performance, the arithmetic mean does provide a good approximation of the indices.
Automotive
-ISO 9000 -QS 9000
-Joint planning and training
-EDI usage -Joint new product development
-Materials and supply management goals part of business planning
-On-time delivery -Product quality -Cost and efficiency enhancements
Element
Requirement Imposed by Customers
Requirements Imposed on Suppliers
Collaborative Efforts & Activities
Strategic Elements
Positive Impact on Performance (Improvements)
-Lead times -Product quality -On-time delivery -Cost reductions
-SCM is integral to overall strategy -Strong relations with key suppliers
-Product development - Increase contract value/duration
-Crossfunctional teams
-Price eductions -Quality standards
Electronics
-Product quality -Lead-time -On-time delivery -Cost reductions
-Certification of key suppliers for achievement of performance standards
-Increase contract value/duration -Little sharing of personnel
-High collaboration due to customized nature
-Price/cost reductions -Quality standards
Aerospace
-Product quality -Operational efficiencies -Lead-time -On-time delivery
-Minority ownership of customers -Key supplier partnerships (single-source long-term)
-Increase contract value/duration -Minimal collaboration
-ISO 9000 -Request statistical data
-Product quality -Operational efficiencies -Lead-times -Minimal improvements
-Purchasing & supply goals in business lanning
-Increase contract value/duration -Minimal collaboration
-On-site personnel at plants -2nd-party Audits
-Quality standards -Price reductions
Industry Chemical
-Minimal collaboration -ISO 9000
Metal Processing
-Product quality -On -time delivery -Process improvements -Lead-times
-Long-term, single-source suppliers -Front-line employees participate in planning
-Increase contract value/duration -Planning symposia
-JIT, TQM -Crossfunctional teams
-Price reductions -EDI usage
Food Processing
Summary of Industry Analysis – Priorities of CCI Initiatives
Ma-
-Product quality -Lead-time -On-time delivery -Cost reductions
-Long-term, single source suppliers -Employee participation in process improvements
-Increase contract value and duration
-JIT and TQM are required to a minimal extent
-EDI usage -Crossfunctional teams
Industrial chinery
-Product quality -Cost reductions -Lead-time -On -time delivery
-Minority ownership of suppliers -Supply issues in business planning
-Increase contract value and duration
-ISO 9000 to a minimal extent
-EDI usage -Minimal extent
Other Industries
Table 3
Problems and Perspectives in Management, 2/2004 235
236
Problems and Perspectives in Management, 2/2004
4.3. Collaborative Efforts Agreed by the Entire Supply Chain The most active sectors in overall collaborative supply chain activities were the automotive, electronics and aerospace industries. Again, this makes sense considering the complex nature of the auto supply chain and the customized nature of the aerospace products. These firms all had a tendency toward awarding supply contracts of increased value and duration to key suppliers. Conversely, the metal processing, industrial machinery and chemical industries did not exhibit a strong tendency toward collaborating to improve the supply chain. It appears that the nature of the products in these industries does not require as high a level of supply chain integration as more technologically complex offerings such as airplanes, automobiles and consumer electronics. The food processing industry companies showed a moderate interest in collaborative supply chain activities and improvements. The most common overall collaborative supply chain activities in Canadian manufacturing sectors include increased duration and value of supply contracts, EDI usage, and joint product development. 4.4. Strategic Role of CCI Initiatives The automotive and electronics industry consider the supply chain to be very important in terms of following corporate strategy and attaining organizational objectives. Strategic relationships in the channel are very important in these industries. Automotive firms feel that a costefficient supply chain is a way of being more responsive to customers. The aerospace, metal processing and food processing sectors engage in strategic supply chain activities to a moderate extent. In particular, aerospace companies tend to certify key suppliers based on continuing achievement of agreed standards, and metal and food processing firms tend to rely on single-source, long-term relationships for key components. Chemical and industrial machinery companies are likely to engage in value strategic relationships within the supply chain. Other strategic supply chain activities identified the establishment of materials and supply management goals, minority ownership of customers, supply issues as part of business planning, and the inclusion of front-line employees in strategic planning exercises. 4.5. Impact of CCI Initiatives on the Participants’ Performance Most industries, including the aerospace, automotive and metal processing sectors, reported moderate improvements in supply chain performance as a result of collaborative supply chain activities. The automotive industry was able to reduce costs in the channel to a significant extent as a result of JIT and lean manufacturing process operations. The chemical and industrial machinery sectors did not experience significant performance improvements due to supply chain enhancements. Finally, the food processing was the one industry that reported substantial improvements in performance due to collaborative supply chain improvements. The arithmetic means for this industry were all at or above the survey averages. The food processing sector boasted moderate enhancements of product quality, on-time delivery, cost structure and employee training programs regarding quality tools and process improvements. Additional improvements experienced by many of the eight industries also include reduced lead times, improved product quality, operational efficiencies and overall cost reductions.
5. Interpretations The survey results point at the nature and extent of collaborative supply chain efforts in Canadian industry. This section provides an interpretation of these results through the following four questions: 1. Who within the value chain is driving continuous collaborative supply chain improvement? 2. What activities and tools are customers and suppliers embracing? 3. Which collaborative activities in the value chain are yielding the greatest benefits to the organization?
Problems and Perspectives in Management, 2/2004
237
4. What is the significance of strategic planning? We will discuss these questions in detail below. Who within the value chain is driving continuous collaborative supply chain improvements? Our survey revealed that no single supply chain link is taking charge and boldly initiating collaborative supply chain activities. 90% of responses concerning suppliers and customers across all industries fell into the “(1) = not at all”, the “(2) = little extent”, or the “(3) = moderate extent” categories. It appears that each industry is somewhat unique with certain participants commencing different activities. All in all, however, it appears that downstream customers are somewhat more proactive in attempting to further integrate the supply chain in pursuit of cost efficiencies, improved quality and customer responsiveness. The questionnaires asked respondent firms the same sixteen questions about their suppliers’ supply chain initiatives and their customers’ initiatives. The “customers” set of questions yielded a higher numeric evaluation of supply chain initiatives (2.43 vs. 2.22) on the aforementioned five-point rating scale. One reason that customers find out somewhat more interested in CCI initiatives is that they are closer to the market and final customers than are other supply chain participants. As a result, these downstream nodes have a better understanding of customer requirements regarding product flexibility, access flexibility and overall responsiveness to the market. The customers understand the positive impact that improvements in any of these dimensions of supply chain flexibility will yield. The customers must instill these values in their supply base partners. As an aside, this research effort also revealed an interesting trend relating to upstream suppliers. Although suppliers may not be as proactive as downstream customers in starting CCI activities, the degree of participations varies between supplier tiers. Section 2 of the questionnaire, entitled Requirements Imposed by Customers, revealed that Tier 2 supply firms exhibited the highest degree of collaboration with their customers as compared to OEM and Tier 1 supply firms. What activities and tools are customers and suppliers embracing? The survey indicated that customers of Canadian industrial firms were employing certain tools in their CCI efforts. The most popular tool was the ISO 9000 quality control standard. 24.5% of downstream customers required this quality assurance standard as a prerequisite for a supply contract. This requirement was especially prevalent in the automotive, aerospace and electronics sectors. Some customers engaged in EDI usage with their upstream suppliers, although this was used to a minimal extent in most industries. Automotive industry participants in particular employed EDI for sharing demand information and reducing transaction and inventory costs. However, customers were responsive to activities such as ongoing price and cost reductions, product quality improvements, on-time delivery improvements and process improvements through models such as JIT, TQM and lean manufacturing. A final trend exhibited by supply chain customers was the tendency to augment their relationship with suppliers through increasing the duration and value of supply contracts. This suggests that these downstream participants were interested in increasing the investment associated with these supply relationships. It seems that these customers feel that an enhanced relationship will force the two parties to be more responsive and efficient in their interactions. The survey also revealed that 90% of the participants had a collaborative relationship with upstream suppliers to a moderate extent or less. In fact, a particularly effective tool was the establishment of performance targets for suppliers. These targets concerned variables such as product quality, on-time delivery rates, lead-time and general cost efficiency measures. Suppliers exhibited a modest level of interest in initiating collaborative continuous improvement activities regarding variables such as cost control, quality, process improvements and employee programs.
238
Problems and Perspectives in Management, 2/2004
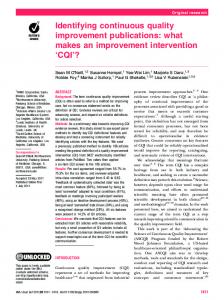
Which collaborative activities in the value chain are yielding the greatest benefits to the organization? Table 7 summarizes the effects that collaborative supply chain efforts have had on the firm’s performance. The figures in the final column represent the eight-industry average response. Most of the averages indicate that improvements resulting from CCI efforts have been from a “little to moderate” extent (from 1.63 to 2.89). However, there are three questions that resulted in eight-industry averages that fell between “moderate and great” extents (from 3.09 to 3.37). These questions concern the supply chain variables such as cost reductions, efficiency, lead-time and product quality. The respondents have indicated that collaborative supply chain efforts have resulted in a significant improvement in efficiency and cost reductions. This indicates that tools such as EDI and process improvements such as JIT, TQM and lean manufacturing have had positive impacts on the companies’ performances. These tools also played a significant role in reducing lead-time and improving on-time delivery rates in supply chains throughout the eight surveyed industries. These improvements in lead-time and on-time delivery also resulted from the trend toward increased value and duration of supply contracts. As the relationship between supply chain partners evolves, they become more responsive to each other’s demands regarding volume and timeliness. Product quality has also been enhanced through these CCI supply chain efforts. This indicates that the customers’ insistence on the ISO 9000 quality standard is warranted. These tighter control measures are having a positive effect on the quality of the physical goods that flow downstream. What is the significance of strategic planning? The questions found in Table 7 pertained the extent to which companies are including supply chain and procurement considerations in their corporate strategic plans. Respondents indicated that they included purchasing and supply management goals in their business plans from a moderate to great extent. The research also uncovered a trend for these companies to rely on longterm, single-source supply relationships for key components and materials. These two results indicate that the supply chain is becoming a critical part of strategic planning in these eight industries. This trend was most prevalent in the automotive and electronics industries, whose responses indicated the greatest tendencies toward strategic supply chain management.
6. Conclusion This paper presents findings from an exploratory study that investigates the extent to which Continuous Collaborative Improvement (CCI) activities are being implemented in the supply chains of Canadian industries. In a broad sense, the detailed questionnaires were designed to answer the following four questions : (a) who within the value chain is driving continuous collaborative supply chain improvement? (b) what activities and tools are customers and suppliers embracing? (c) which collaborative activities in the value chain are yielding the greatest benefits to the organization? and (d) what is the significance of strategic planning? Based on our preliminary findings, the following conclusions can be offered. First, companies participated in the study are making steadfast efforts to cooperate in the channel in search of greater cost efficiencies, timeliness and overall product quality. Second, these efforts vary among the industries. Despite trends such as globalizations and increasing customer demands, many companies have not yet embraced the supply chain as a strategic route to increased responsiveness and competitiveness. Having said that, the results indicated that most companies include supply chain cooperation and enhancement in their strategic planning to some degree. Finally, the industries with higher levels of cooperation and integration, such as the automotive, electronics and aerospace, experience higher cost efficiency and better responsiveness to their final user demands.
Problems and Perspectives in Management, 2/2004
239
Acknowledgement The contribution of Scott Clark in preparation of this manuscript is acknowledged. This research was partially supported by a grant from Social Sciences and Humanities Research Council of Canada (SSHRC).
References 1. Aviv, Yossi (2001), “The Effect of Collaborative Forecasting on Supply Chain Performance,” Management Science, Vol. 47, No. 10, October, PP. 1326-1343. 2. Brown, John (1997), “Achieving peak performance using QS9000,” IIE Solutions. Vol. 29, Issue 1, January, PP. 34-39. 3. Carter, P., J. Carter, R.M. Monczka, T.H. Slaight, and A. Swan (2000), “The future of Purchasing and Supply: A Ten-Year Forecast,” The Journal of Supply Chain Management. Winter, pp. 14-25. 4. Calliono, Gianpaolo and Corey Billington (2001), “Effective Collaboration,” OR/MS Today, October, PP. 34-39. 5. Corbett, Charles and Uday Karmarkar (2001), “Competition and Structure in Serial Supply Chains with Deterministic Demand,” Management Science, Vol. 47, No. 7, July, PP. 966978. 6. Dornier, P., P. Ernst, M. Fender, and P. Kouvelis (1998), Global Operations and Logistics: Text and Cases, John Wiley & Sons, New York, NY. 7. Dyer, Jeffrey H. Dong Sung Cho , and Wujin Chu (1998), “Strategic supplier segmentation: The next "best practice" in supply chain management,” California Management Review, Vol. 40, Issue 2, PP. 57-77. 8. Ernst and Young (1998), “Food in Canada Executive Roundtable: Supply Chain Management in the Food and Beverage Industry,” Food in Canada, Vol. 58(7), PP. 17-28. 9. Heberling, M.E. (1993), “The rediscovery of Modern Purchasing,” International Journal of Purchasing and Materials Management. V.29, P. 48-53. 10. Hill, Craig and Gary Scudder (2002), “The Use of Electronic Data Interchange for Supply Chain Coordination in the Food Industry,” J. of Operations Management, Vol. 20, No. 4, PP. 375-387. 11. Noori, H., S. Jha , and J. Michela (1998), “Within the Canadian Boundaries : A close look at Canadian Industries Implementing Continuous Improvement,” Working Paper, Laurier School of Business and Economics, Wilfrid Laurier University, Waterloo, ON, Canada. 12. Stalk, G. Jr. and T.M. Hout (1990), Competing Against Time , Free Press, New York. 13. Strzelec, Paul (July 15, (2002), “Achieving the Potential of Network Collaboration,” ASCET (http://www.ascet.com/documents.asp?d_ID=1006), Vol. 4, July 15, PP. 96-98. 14. Temkin, Bruce (2002), “Building A Collaborative Supply Chain,” ASCET (http://www.ascet.com/documents.asp?d_ID=1023), Vol. 4, May 15, PP. 44-48. 15. Tompkins, J., B. Knill, and T. Andel (1998), “Time to Rise Above Supply Chain Management,” (Supply Chain Synthesis, a Continuous Improvement Process Advocated.) Transportation and Distribution, Vol. 39, No. 8. 16. Vonderembse, M.A., and M. Tracey (1999), “The Impact of Supplier Selection Criteria and Supplier Involvement on Manufacturing Performance,” The Journal of Supply Chain Management. Summer, pp.33-43.
To what extent do customers make resources available to you for the purpose of continuous improvement (such as Hands-on training in process improvement activities and quality tools)?
Over the past 2 years, to what extent have your customers awarded longer duration or higher value contracts/orders?
To what extent do customers require your firm to provide ongoing price reductions to them?
To what extent do customers require your firm to set cost, quality or lead time reduction goals?
To what extent do your customers engage in 2nd party quality audits of your facilities, process, or systems?
To what extent have your customers or markets required your firm to implement a process improvement initiative such as (JIT, lean Manuf.,Continuous Improv. Or Total Quality)?
Over the past 2 years, to what extent have your customers or markets required your firm to implement a structured quality system (ISO 9000 or QS 9000)?
To what extent do customers require your firm to use cross functional teams or new products development activities?
To what extent do customers require your firm to use cross functional teams for process improvement activities?
To what extent do customers require your firm to provide them with statistical data as evidence of process control and capability?
To what extent do customers require firm to use EDI, to share demand information or reduce transaction costs?
To what extent do you participate in joint planning and training sessions initiated by your customers?
4 2.9
1 3.93
4 1.9
2 2.32
6
2.3
3.45
2.5
4
2
1
2.2
3.19
3.33
6
2.4
3.74 2
6
1
3 3.6
1 4.53
6 1.65
1
1.6
3.55
3.42
7
1
7 2.1
2 3.52
8 1.8
1 3.74
3 2.8
1
Electronics
3.1
Automotive
2.5
1
3.33
1
3.5
2
3.83
1
3.33
1
3.67
2
4
2
2.67
2
2.83
2
3.83
1
2.5
3
3
2
Aerospace
1.59
7
2.48
7
2.37
8
2.19
5
2.41
4
2.35
7
3.12
4
1.78
5
1.73
6
2.56
5
2.11
6
2.44
Metal Processing 6
Requirements imposed by customers questions
4
1.83
6
2.72
2
2.67
5
2.11
6
2.33
5
2.44
5
3.11
5
2.06
3
2.22
3
3
4
1.94
7
2.78
Chemical
1.92
3
2.68
3
3.2
3
2.58
3
2.84
3
2.68
3
2.8
7
2
4
2
4
3.04
3
2.52
2
2.56
Food Processing 5 8
1.89
5
2.53
5
2.42
7
2.11
7
2
7
2.47
4
3.05
6
2
4
1.84
5
2.21
6
2.21
4
2.21
Industrial Machinery
Others
1.58
8
2.55
4
2.57
6
2.07
8
1.96
8
2.25
8
2.64
8
1.57
7
1.6
7
2
8
2.16
5
2.3
7
Table 4
240 Problems and Perspectives in Management, 2/2004
5 1.5
1 2.48
4 1.5
1
2.3
2.77
1.9
5
1.5
3.13 2
8
1
1.67
3
1.67
3
3
1
3
2
1.59
4
1.41
7
1.85
8
1.93
5
1.5
5
1.44
6
2.72
4
2.33
4
1.72
2
1.68
2
1.96
6
2.56
3
1.37
7
1.37
8
2.74
3
1.79
7
To what extent do suppliers require your firm to use cross functional teams or new products development activities?
To what extent do suppliers require your firm to use cross functional teams for process improvement activities?
To what extent do suppliers require your firm to provide them with statistical data as evidence of process control and capability?
To what extent do suppliers require firm to use EDI, to share demand information or reduce transaction costs? 1.8
2.8 6 1.6 4 1.8
3.29 1 2.65 1 2.57
4
1
3
2.6
2
1
5 2.32
2.39
Electronics
Automotive
1.67
5
1.83
3
3.33
1
1.83
3
2.5
2
Aerospace
1.41
8
1.52
7
2.67
5
1.63
7
2
8
Metal Processing
Requirements imposed on suppliers questions
1.47
7
1.47
5
2.47
6
1.53
8
2.06
7
Chemical
2.12
2
2.32
2
2.68
4
1.72
6
2.44
3
Food Processing
1.53
6
1.47
4
2.37
7
1.74
5
2.16
6
Industrial Machinery
1.84
3
1.83
3
2.31
8
1.86
2
2.42
4
Others
Table 5
1.38
6
1.46
5
1.94
7
1.9
6
Table 4 (continuous)
1. For each industry the top # is the Rank and the bottom # is the Mean. 2. The Rank was based on the highest mean within the specific question. 3.Responses were measured on a scale of 1 to 5, where 1=Not at All 2=Little Extent 3=Moderate Extent 4=Great Extent 5=Very Great Extent.
To what extent do you participate in joint planning and training sessions initiated by your suppliers?
Notes:
To what extent do customers require your firm to have employee involvement programs?
To what extent do customers require your firm to assess job satisfaction or otherwise address employee concerns?
To what extent do customers require your firm to provide on-site personnel at their facility (for example, providing engineering or administrative support)?
To what extent do customers require your firm to provide quality or cost improvement data?
Problems and Perspectives in Management, 2/2004 241
Notes:
2.4 3 2.6 7 1.9 4 1.4 3 1.4
2.68 1 2.9 2 2.26 2 1.52 1 1.74
3.3 3
1
2 2.87 1
3.5
2.97
1
2 3.3
3.1
1
1
3 2.87
3
3.2
2.94
1
2 2.9
3.3
3.42
1.17
7
1.17
8
2
6
2.67
2
2.17
4
2.83
3
2.5
7
2.5
5
3
2
2.33
4
3.67
1
1.22
6
1.19
7
1.7
8
2.04
7
1.74
8
2.65
5
2.58
6
2.22
7
2.19
7
1.7
8
2.44
5
1.29
5
1.41
3
2.18
3
2.24
6
1.94
7
2.53
7
2.18
8
1.94
8
2.35
5
1.76
7
2.35
6
1.56
2
1.6
1
2.36
1
2.56
4
2.44
2
2.6
6
3
2
2.72
3
2.44
4
2.4
3
2.48
4
1.05
8
1.22
6
2.11
5
1.95
8
1.95
6
2.26
8
2.84
4
2.63
4
1.74
8
1.84
6
2.16
8
1.3
4
1.39
5
2.14
4
2.27
5
2.08
5
2.73
4
2.72
5
2.46
6
2.21
6
2.08
5
2.31
7
Table 5 (continuous)
3. Responses were measured on a scale of 1 to 5, where 1=Not at All 2=Little Extent 3=Moderate Extent 4=Great Extent 5=Very Great Extent.
1. For each industry the top # is the Rank and the bottom # is the Mean. 2. The Rank was based on the highest mean within the specific question.
To what extent do suppliers require your firm to have employee involvement programs?
To what extent do suppliers require your firm to assess job satisfaction or otherwise address employee concerns?
To what extent do suppliers require your firm to provide on-site personnel at their facility (for example, providing engineering or administrative support)?
To what extent do suppliers require your firm to provide quality or cost improvement data?
To what extent do suppliers make resources available to you for the purpose of continuous improvement (such as Hands-on training in process improvement activities and quality tools)?
Over the past 2 years, to what extent have your suppliers awarded longer duration or higher value contracts/orders?
To what extent do suppliers require your firm to provide ongoing price reductions to them?
To what extent do suppliers require your firm to set cost, quality or lead time reduction goals?
To what extent do your suppliers engage in 2nd party quality audits of your facilities, process, or systems?
To what extent have your suppliers or markets required your firm to implement a process improvement initiative such as (JIT, lean Manuf.,Continuous Improv. Or Total Quality)?
Over the past 2 years, to what extent have your suppliers or markets required your firm to implement a structured quality system (ISO 9000 or QS 9000)?
3
2
242 Problems and Perspectives in Management, 2/2004
3.2 7 1.2 3 1.5 4 2.3 7 2.3 1 3.5 1 2.7 1 2.6
6 1.16 5 1.26 2 2.64 1 2.9 2 3.1 2 2.4 2 2.58
To what extent does your firm have minority ownership of its customers?
To what extent does your firm have minority ownership of its suppliers?
To what extent have customers initiated strategic alliances with your firm?
To what extent has your firm conducted benchmarking to identify "best-inclass" suppliers?
To what extent has your firm reduced the number of suppliers it deals with based on their improved cost, quality, lead time, or delivery?
To what extent has your firm reduced the number of suppliers it deals with based on their participation in continuous improvement activities?
To what extent does your firm include continuous improvement objectives in the selection and evaluation of suppliers?
3.4 2
3
1
1
3.1
3.7
5
1
3.1
3.61
1
2
2.7
2.52
2.94
2
4
Electronics
3.4
To what extent does your senior management include supply base management in the overall planning of business strategy?
To what extent does your firm include purchasing/supply management goals in the business plan?
To what extent are materials management and purchasing represented at your firm's strategic business planning activities?
To what extent are your firm's material and purchasing personnel trained in quality tools and process improvement (for example process mapping, problem solving, statistical techniques, and benchmarking)?
Over the past 5 years, to what extent has your firm increased the amount of outsourcing (measured by the cost of goods and services bought from suppliers, as a percentage of your film's sales revenue)?
Automotive
4 2.33
6 1.83
8 2.5
2 2.67
1 2.67
4 1.33
5 1.17
3
5
3.5
2
3.33
2
2.5
5
2.5
5
Aerospace
Supportive strategy questions
8 1.89
7 1.63
7 2.82
3 2.48
3 2.37
1 1.71
4 1.18
2.78
7
3.22
5
2.89
8
2.48
6
2.04
8
Metal Processing
3 2.44
4 2.11
3 2.89
8 2.28
7 2.17
7 1.17
8 1.11
3.17
3
3.33
4
3.28
3
2.94
2
2.29
7
Chemical
5 2.32
3 2.16
5 2.84
4 2.44
5 2.28
2 1.68
1 1.36
3.12
4
3.4
3
3.02
6
2.28
7
2.79
1
Food Processing
7 2.06
7 1.63
6 2.58
6 2.37
8 2.05
5 1.26
3 1.21
2.95
6
3
7
3
7
2.84
3
2.68
3
Industrial Machinery
6 2.21
5 1.92
4 2.85
5 2.38
6 2.27
6 1.23
2 1.26
2.92
6
3.11
6
3.12
4
2.65
4
2.45
6
Others
Table 6
Problems and Perspectives in Management, 2/2004 243
Notes:
3.4 3 3.1
6 2.83
4 2.97
3.2 1
3.26
1. For each industry the top # is the Rank and the bottom # is the Mean. 2. The Rank was based on the highest mean within the specific question.
To what extent has your firm tried to involve front-line employees in suggesting improvements to materials and purchasing management?
To what extent has your firm made efforts to partner with key suppliers?
To what extent has your firm made efforts to certify key suppliers, based on continuing achievement of agreed standards of [performance?
3.3 3
5
2
2
3.7
3.42
1
3 3.16
To what extent has your firm identified key suppliers with whom to collaborate closely, based on strategic reasons?
To what extent does your firm rely on long term, single source relationships for key components and materials?
2 2.1
3 2
To what extent does your firm require suppliers to participate in continuous improvement activities, before they can bid on new business?
2.5
8
3
3
3.83
1
3.67
1
3.17
2
7 1.5
2.7
7
2.74
5
2.74
5
3.07
7
3.07
5
8 1.37
2.94
4
2.5
7
2.56
6
2.67
8
2.83
8
4 1.83
3.16
2
3.08
2
2.4
7
3.32
4
3.08
4
1 2.12
3.42
1
3
3
2.84
4
3.37
3
2.9
6
6 1.53
2.88
5
2.68
6
2.25
8
3.08
6
2.86
7
5 1.6
Table 6 (continuous)
244 Problems and Perspectives in Management, 2/2004
4.10 3.52 4.10
Explores the extent customers measured and evaluated the firm’s performance with respect to quality.
Investigates the extent customers measured and evaluated the firm’s performance with respect to lead time.
Inquires the extent customers measured and evaluated the firm’s performance with respect to on-time delivery.
3.43
Addresses the extent firms have reduced the lead time they need to fill customers’ orders 3.77
3.65
Inquires whether firms have improved the quality of their products.
3.55
3.71
Inquires whether firms have improved their efficiency by reducing their costs.
This question probes the extent customers measured and evaluated the firm’s performance with respect to cost.
1.55
Asks whether the firm has lost business because its customers reduced the number of suppliers they buy from.
Inquires the extent firms have improved their on-time delivery to customers’ orders.
2.73
nquires to what extent the surveyed firms have developed cost, quality, lead time, and on-time delivery targets for t heir suppliers.
3.17
2.97
Inquires whether suppliers have added value to the firm through membership in cross-functional teams.
Attempts to predict, over the next two years, whether firms plan to reduce the number of suppliers.
2.26
nquires whether suppliers’ employees are trained in quality tools and process improvement.
Inquires whether the firm has reduced the numbers of suppliers.
2.47 2.61
Inquires whether suppliers significantly reduced the price for their goods.
3.19 2.65
Inquires whether suppliers achieved significant cost reductions.
2.93
Inquires whether suppliers reduced their lead time to fill orders
Inquires whether suppliers have improved their on-time delivery.
3.16
Automotive
Inquires whether suppliers improved the quality of goods and services delivered.
QUESTIONS
2.80
2.70
2.90
2.50
3.10
3.10
3.40
3.50
1.70
2.90
3.00
3.20
1.89
3.33
2.10
2.30
2.70
3.10
2.90
Electronics
Impact on performance
4 .00
3.83
4.33
3.61
3.60
3.33
3.33
3.33
1.50
3.00
2.33
3.17
2.00
2.17
2.50
2.83
2.83
2.67
2.83
Aerospace
3.52
3.26
3.59
2.81
3.19
2.81
3.26
3.26
1.50
2.41
2.37
2.30
1.46
2.50
2.08
2.23
2.78
2.56
Chemical
Metal processing 2.78
3.17
2.83
3.50
2.72
3.39
2.89
3.59
3.50
1.67
2.11
2.17
2.22
2.28
2.50
2.06
1.94
2.44
2.39
2.72
Little extent (2)
Not at all (1)
3.16
3.04
3.60
3.13
3.20
3.00
3.36
3.56
1.56
2.52
2.64
2.92
2.27
3.42
2.20
2.60
2.76
2.68
Food processing 2.84
Modera-te extent (3)
3.05
2.74
3.16
2.56
2.84
3.05
3.05
2.84
1.67
2.74
2.63
2.63
1.80
2.24
2.14
2.29
2.76
2.66
Industrial machinery 2.89
Great extent (4)
3. 3.30
2.88
3.04
2.78
3.11
3.12
3.21
3.25
1.86
2.74
2.68
2.57
1.87
2.25
2.31
2.40
2.81
2.78
3.01
Others
Very great extent (5)
Table 7
Problems and Perspectives in Management, 2/2004 245