processes or for optimizing existing ones, requires knowledge and proper tools. ... scratch, not having reuse promoted, i.e., not considering existing knowledge.
Collaborative Process Modeling and Reuse Evaluation Luiz F. C. Tomaz, José A. Rodrigues Nt, Geraldo B. Xexéo, Jano M. Souza COPPE/UFRJ, Graduate School of Engineering Universidade Federal do Rio de Janeiro Rio de Janeiro, Brazil {luiztomaz, rneto, xexeo, jano}@cos.ufrj.br Abstract — Business Process Management Systems are largely used nowadays. Process Modeling, whether for depicting new processes or for optimizing existing ones, requires knowledge and proper tools. However, most process models are created from scratch, not having reuse promoted, i.e., not considering existing knowledge. Large enterprises not using a unique integrated system, and also some of them that do, have the same business process implemented in a variety of ways, due to differences in their units, culture or environments. In this work we evaluate BPCE, a P2P tool we previously proposed as a way of collaboratively developing process models. We describe tool implementation issues, a modeling case study, a simulation conducted using the tool and the changes in the original proposal caused by those investigations. The results present evidence that such a tool can minimize the time to develop new models, reduce the differences among similar business processes conducted in distinct organization units, enhance the quality of process design and promote reuse. Keywords-component; Process Modeling, Business Process Management, Computer Supported Cooperative Work, P2P and Reuse.
I.
INTRODUCTION
Business Process Management (BPM) has gained popularity and strength in the last few years. The failure of traditional approaches for system design in fully addressing the needs of most organizations, especially on aligning the development´s final product with business objectives [1], has contributed to this picture. Particularly, modeling the business process can greatly facilitate requirements gathering, still viewed as the source for most failures on software projects [2]. Yet, the work on Model Driven Architect (MDA) [3], enhancing the value of Platform Independent Models (PIM), also contributes to leveraging the importance of process modeling. Usually, there exist several common, or similar, processes in organizations. For instance, most organizations whether in the same company or not, have a procurement and acquisition process. We believe a cooperative approach can drastically reduce models’ development time and help in process standardization. Yet, this approach is a source of dissemination of knowledge, i.e., successful cases can be shared and the knowledge they carry can be used in the construction of new cases.
Addressing these issues, we proposed the use of a peer-topeer (P2P) tool to exchange processes models. With a P2P approach, models can be selected through collaborative filtering, where the best models are rewarded while the worst models are punished. In the long term, the best models tend to be selected, since people usually look at the first few results [32]. This way, the process design is facilitated and a “natural” standardization is promoted. The proposed tool also allows for the enhancement of existing models, through an evolutionary approach [31] that helps in organizational learning [4]. Additionally, since modelers can work independently of any organization, the tool may also be used on an individual basis, as an open repository and reuse promotion mechanism. The design process itself can be modeled and enhanced by the adoption of the proposed tool. Furthermore, any model based design effort can also benefit from this approach, since the rationale and mechanisms are directed to model sharing. This way, an industrial process can be created using the same principles, or even the design of a new product can be made this way. It is important to note that many design teams nowadays are geographically dispersed and so can have its work facilitated by a tool that supports collaborative design. In this paper we describe some details of the implementation of Business Process Cooperative Editor (BPCE) [5][20] and the case study conducted to assess the effectiveness of the proposed solution. We begin giving an overview of the problem BPCE tries to solve in section 2. In section 3 and 4, we describe a few implementation issues. Finally, we present the tool evaluation in section 5. The conclusions and perspectives for future work are presented in sections 6 and 7, respectively. II.
PROBLEM OVERVIEW
A large amount of common processes does exist among organizations. Due to the increase of attention to business process management [6], organizations tend to model all their processes. Many times though, new models are developed from scratch, with little attention to reuse or process optimization and standardization. In large enterprises, where several non-integrated systems are found [7], differences among their units or departments could be greatly reduced if there was some way of standardizing their common processes. A collaborative
approach can also ease the modeling task among different enterprises, where process integration is needed.
Modeling Notation (BPMN) has not yet defined a language for diagram interchange [13].
The adoption of standardized processes is expected to enhance efficiency and performance, e.g., streamlining the supply-chain processes [7], while facilitating reuse [8].
C. Model’s Reuse Software reuse is the isolation, selection, maintenance and utilization of existing software artifacts in the development of new systems [33]. There exist four levels of software reuse: code scavenging, function reuse, component reuse and full model reuse.
A. The Modeling Scenario Process standardization, as defined by Jang and Lee [28], is a degree to which work rules, policies, and operating procedures are formalized and followed [28]. The object of process standardization is a business process [30]. Process standardization ultimately defines a standard reference to which different versions of a business process within the firm need to conform [29]. This is usually the case in large enterprises, where different business units execute the same basic process in different ways. Consequently, process standardization is both a process and the result of achieving transparency and homogenization of business processes within a firm, or even across multiple firms [23]. Process standardization has a significant positive impact on process performance, both in a direct manner and in an indirect way, mediated by facilitating control capabilities [30]. However, making organizations adopt a standard process is not an easy task. This gets even harder if the process is split among different companies. Cross-organizational business process modeling besides justifying special care, especially due to privacy and competitive constraints, can be a complex job [9]. Furthermore, with a collaborative approach, new models usually are generated from existing models. These successive refinements can be a natural way to optimize the process. Business process models are modeled, in our case, using the Unified Modeling Language (UML) Activity Diagrams. Those diagrams can be understood as a form of knowledge externalization about processes. If modelers can reuse knowledge about existing processes, the modeling task can be faster and less error prone [23]. For the purpose of BPCE, whole diagrams or fragments are handled as models. Therefore, a user that wants to design a new process can do it by assembling existing diagrams, or parts of existing diagrams, to compose a new model that suits his requirements. B. Model Exchange Model exchange can be accomplished in a variety of ways, using different formats. It is desirable that an interchange format presents the following characteristics: readability, ease of implementation, platform independence, efficiency, free availability, and support of standards [10]. The XML Metadata Interchange Format (XMI), proposed by the Object Management Group (OMG) [11], appears as a natural choice, since the chosen modeling media is the Activity Diagram, from UML, and extensions of the work to deal with software models or other XMI based tasks would be facilitated [12]. Although restricted to interchanging diagrams based on the Meta-Object Facility (MOF), also from OMG, it is platform independent [11]. It shall be noted that Business Process
Moreover, we believe reuse of models can be accomplished in the same way software reuse, and can have the same four levels: •
Code scavenging: Is the reuse of an activity or a set of activities that was developed by the modeler or a person who the modeler trusts. It is the lower level of reuse.
•
Function reuse: Is the reuse of a set of activities that can be understood as a task or a sub-task. At this level, reuse is more than code scavenging, but is performed only in specific parts of a process.
•
Component reuse: At this level reuse can be understood as the reuse of an entire process. Reuse is higher than on the preceding levels and models are developed, as long as possible, according to known patterns, to facilitate reuse.
•
Full model reuse: At this level, reuse is total, i.e., an organization reuse an entire business process.
Nowadays, much attention is focused on the reuse of source code level artifacts [34]. We believe that with increasing importance of PIM [3], the model reuse will also draw more attention. D. P2P Approach The P2P approach is recommended to data sharing applications [35]. Since BPCE can be seen as data sharing application, the P2P approach is recommended. Also, P2P presents other advantages to cope with budget constraints, and is also indicated when the resources have high relevance to the participants and have a non-critical nature. Additionally, it allows independent, sometime “unknown” modelers to participate in the established network, posting their contributions. Trust in software development is a metric that is difficult to measure. In software development, trust can be evaluated in different ways, such as considering who developed a program, where it was published, number of reviews, others who trust it, etc. Another way to build trust is reuse [24]. BPCE treats trust as part of its scoring mechanism, considering model reuse. Considering that, a P2P system depends on the actual participation of peers and since reuse of one’s models builds up his reputation, we believe that a recommendation mechanism motivates the cooperation of peers. This way, peers are compensated for their participation on a network and for the quality of their contribution. This mechanism though, doesn’t avoid the existence of free-riders [14].
III.
THE BPCE PROTOTYPE
BPCE was implemented as a plug-in for Eclipse [25]. Since Eclipse itself doesn’t have a modeling tool, we needed to choose one to compose BPCE. We decided for IBM Rational Software Modeler (RSM), since it is also implemented as an Eclipse plug-in and is being used in other Lab’s projects. Nevertheless, any other modeling tool created as an Eclipse plug-in would fit. Mainly, BPCE works with three forms: Configuration form, Model Publishing form and Model Searching form. The Configuration form is showed in Fig 1. The three initial fields are used to configure score’s weights. Those fields must be configured, for proper model ranking behavior. These parameters are configured just the first time the tool is used, to establish the collaboration environment. Later on, the values can only be viewed, since its modification would demand the recalculation of all scores previously calculated. Figure 1. Configuration Form
The COPPEER’s port field shall receive the port number being used by COPPEER to establish the P2P infrastructure [21]. The last form field is the maximum time for synchronization. Its value can be changed to adjust the tool for network latency. The Publish Model form is showed in Fig 2. The fields are for the modeler to indicate model’s main information, i.e., its name and its author. Both fields are filled automatically, but the modeler can edit them. In the grid “Used Models”, the models that were imported into the model to be published are listed, so their contribution to the development of this new model can be evaluated before publishing. Finally, the Search Model form has a Filter tab with only one field: the Search Criteria field. When a search is performed, the form changes to the Results tab, showing a grid where results are presented, i.e., models that match the characteristics defined as the search criteria. Each model listed has a link to its simple image, which allows for the user to perform a quick visualization, in order to help decide if it shall be imported. If so, the user can mark it for importing. The Results grid and its details are shown in Fig. 3. The MO has been implemented as a compressed file (ZIP). It contains a simple image of the model in .GIF format and contains two XML documents: one that contains model´s information (scores, name, documentation) and other that contains the model itself, in XMI. The model’s name and model’s documentation are indexed in a Lucene [26] index, to facilitate search. The RO has been implemented as a XML document too. IV.
IMPLEMENTATION ISSUES
Initially, in the conception of BPCE, the scores of a model would be stored only in its MO. However, as a peer in a pure P2P network has the discretion to decide when to leave or join the network [15], we found the following problems.
Figure 2. Publish Model Form
1.
The first problem occurs because scores are stored only locally, in MO’s. This is a problem, as we cannot guarantee that all peers are online at the same time. Consequently, the reputations of modelers could be calculated incorrectly, since they are calculated based on the scores of all modelers. Incorrect reputation assignment would fail the schema, as points awarded for models would consequently be wrong. This can be verified inspecting the formulas used to calculate scores [20].
To solve this first problem, we developed the following solution: The scores are not stored in MO, but in the RO. As the RO shall be the same in all peers, the RO is replicated and synchronized among peers. This way, we can ensure that all peers use the same RO, avoiding incorrect computations.
Figure 3. Search Model Form
However, adopting this solution created a third problem, which is to guarantee that all peers have the same RO. This is a typical problem of distributed systems. Birman et al. in [16] addressed this problem and proposed a solution – the Virtual Synchrony communication model. There exist other communication’s models for distributed systems, such as BPCE. For example, following the Virtual Synchrony [16], the Extended Virtual Synchrony [17] was proposed, and, more recently, works in this area focuses on scaling group membership [18], [19]. To address this third problem, we implemented a synchronization mechanism for RO’s among peers, inspired on the Virtual Synchrony [16]. It consists of two basic algorithms: The first one is responsible to synchronize the RO when a peer connects to the network. When a peer connects, it sends its RO to all other peers. The receiving peers process the entering peer’s RO and answer its request with a RO update. Finally, the entering peer update its RO, with the RO updates received. The second algorithm is responsible to synchronize the RO when some score change occurs. We call the score change algorithm after the following events: model evaluation and model visualization. When a score change occurs in a peer, it is processed locally and sent to all other peers, for processing. 2.
The second problem happens if, between the moment of the search of a model and its visualization, the peer responsible for it leaves the network. Thus, the points of visualization that would be received by the visualized model could be lost. Additionally, when an imported model is evaluated, if the peer responsible for it is off-line, the points it would receive as a result of the evaluation would also be lost. This way, all formulas would produce erroneous results.
The second problem is solved with log generation, i.e., everything that happens with the models is registered. The following events are recorded: model evaluation, model visualization and model publication. Accordingly, at anytime, a peer with outdated data can change its status, reaching the same status of all other peers. Those logs are stored in RO too, because they need to be replicated among peers as part of the solution to the first problem discussed.
Finding adequate solutions to the problems described above was necessary for the proper functioning of the tool. Our proposed solutions still have a few other problems, such as the order in which the scores’ changes are received by all peers. Nevertheless, the current implementation was enough for conducting an investigation, in order to evaluate the effectiveness of the proposed collaborative modeling solution. On the other side, we believe that they shall be better approached by the Infra-structure layer, i.e., the COPPEER itself, not the Application layer. Another important issue in BPCE is its model ranking algorithm. We changed the formula for Model’s Initial Points presented in [5][20] because that did not properly considered the modeler’s reputation. Now, a model created by a modeler with high reputation is considered to be better than a model that is created by a modeler with low reputation. Below we present the new formula of Model’s Initial Points. •
PMk - Total points of model k.
•
pμikm – Is the point for use, by modeler i, in model k of model m.
•
x – Number of imported models.
•
Rj – Reputation of modeler j.
•
PImj – Initial points of model m created by modeler j.
∑ | |
3
The exponential function used gives a model a high score if its modeler has a high reputation and allows for the rapid growth of the model’s score, accelerating convergence. V.
TOOL EVALUATION
We perform the tool evaluation in two different ways: a Simulation and a Case Study. First we describe the simulation, as it was conducted and its results. Finally we describe the Case Study and its results.
A. Simulation We simulated BPCE behavior, using Monte Carlo simulation techniques [36, 37] to answer the following question: 1.
Is the model that achieves the highest score the one with the highest quality?
1) The Scenario In this simulation we consider that modeling occurs in an organization that has five different business divisions that need to model their Procurement and Acquisition processes. Each division has a unique modeler.
•
m – 5; and
•
mo – 5.
To assign the quality factor of a modeler, we choose one modeler as a good modeler, one modeler as a poor modeler and the other three modelers as regular modelers. Initially, the quality of a model is assigned according to the quality of its modeler. If the modeler is good, his first model receives a quality value according to a Uniform Distribution DU(80,100).
2) The Simulation Process We start the simulation considering that each modeler publishes his model of the P&A process. Following, each modeler randomly decides to publish a new version of the model. When the modeler builds his new version, he begins at his previous version and performs a search in the repository to retrieve some other models that can help in the improvement of his existing model. When the new version is published, overwriting the previous one, the modeler evaluates the imported models. We consider that, when a new version is produced, it inherits the older version quality, but with a variation according to the actual reputation of the modeler. In other words, we consider that a good modeler has a greater chance of improving his model, but sometimes can degrade it, while a poor modeler has a smaller chance of improving his model. Below we show the detailed simulation setup, executed as described in Fig 4. Input variables: •
i – Number of iterations of the simulation.
•
wi – Model’s initial points weight.
•
ws – Model’s selection points weight.
•
wu – Model’s utilization points weight.
•
m – Number of models that exist in the repository before the start of simulation.
•
mo – Number of modelers in the organization.
Each modeler has a factor of quality that indicates how good a modeler he is, i.e., good, regular or poor. A modeler is good if his reputation is greater than 0.3, is regular if it is between 0.1 and 0.3, and poor if it is less than 0.1. Similarly, each model has a quality value, derived from its modeler. A model is good if its quality value is greater than 80, regular if it is between 40 and 79, and bad if it is less than 39. Regarding the first step of the simulation, the following values are fixed for each execution. Table I presents the values which will vary for each execution. •
i – We execute 45 interactions because we consider that a modeler publishes only 10 versions of the same business process;
Figure 4. Execution flow of Simulation
TABLE I. wi
INITIAL VALUES
ws
0.3 0.3 0.6 0.6 0.1 0.1
wu
0.6 0.1 0.3 0.1 0.3 0.6
Run Setup
0.1 0.6 0.1 0.3 0.6 0.3
A B C D E F
•
0.025 0.975
•
If the modeler is regular, his first model receives a quality value according to a Uniform Distribution DU(40,79).
•
If the modeler is poor, his first model receives a quality value according to a Uniform Distribution DU(1,39).
1 •
The next step, Import Models, deals with how many models will be imported. The probability of a model being imported is calculated based on the candidate model’s reputation. To define the model reputation we need to define some variables: •
PMk – Total points of model k.
•
TotP – Is the sum of the total points of each model.
•
u – Number of imported models.
•
R(m) – Reputation of model m.
So, with these variables, we can describe in formula (1) the model’s reputation and in the formula (2) the probability of a model being imported. 1
2 Using model’s reputation, the probability of a model being imported depends directly on its score. This way, the best models are rewarded. To decide if a model will be imported, we use a Bernoulli Distribution with probability of success PU(m). The third step, Evaluate Imported Models, deals with how many points each imported model receives. To decide how many points are given to imported models, we consider that the points received by each model are related to its quality value. We define Qm as a model’s factor quality. The probability of a model receiving 0, 1, 2 or 3 points respects a Bernoulli distribution with probability of success p which is defined below: •
If a model has good quality, it receives 2 or 3 points. So, the probability p of a model receiving 2 points is defined as follows: 0.05 0.95 1
20
, , 80 ,
100 80
If a model has regular quality, it receives 1 or 2 points. So, the probability p of a model receiving 1 point is defined as follows: 79 40
, , 40 40
,
If a model has poor quality, it receives 0 or 1 point. So, the probability p of a model receiving 1 point is defined as follows: 0.975 0.025 39 1
, ,
39 1
, 40 The next step treats the quality of the new developed model. In this step, we decide if the quality of the model increases, decreases or remains unchanged. If its quality increases, the model’s quality value is increased by 5. If it decreases, its quality value is reduced by 5. We use an empirical distribution, with different values, according to the quality factor of the modeler: •
Good Modeler: p(increases) = 0.5, p(unchanged) = 0.4 and p(decreases) = 0.1.
•
Regular Modeler: p(increases) = 0.2, p(unchanged) = 0.6 and p(decreases) = 0.2.
•
Poor Modeler: p(increases) = 0.1, p(unchanged) = 0.4 and p(decreases) = 0.5.
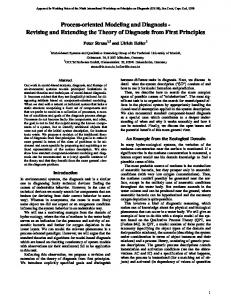
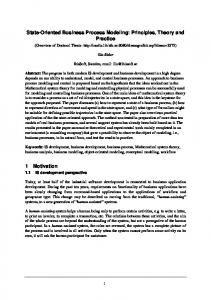
The final step, Publish New Model, is where we publish the new model and start a new interaction. 3) Simulation Reults In this section we present the results obtained from the simulation. To answer the proposed question, we run the simulation 100 times for each run setup (A, B, C, D, E and F), as shown in Table I, and we count how many times the model that has the best quality appears in each position (first to fifth). We perform the simulation with the original ranking schema [5][20] and with the new ranking schema, i.e., with the modifications presented in section 4. The results of the execution of the original ranking schema are presented in Fig. 5, and the results of the new ranking schema are presented in Fig. 6.
standardization can be promoted, since new models tend to be developed according to the first models in the search list, and the best model is always among those.
60 50 40 30 20 10 0
1 2 3 4 5 A
B
C
D
E
F
Figure 5. Times the best model appears in each position for each run setup for old ranking schema
60 50 40 30
1 2 3 4 5
20 10 0 A
B
C
D
E
F
Figure 6. Times the best model appears in each position for each run setup for new ranking schema
Analyzing the first graph we reach the following conclusions: •
Run setups that have selection points weight (ws) higher than utilization points weight (wu) and initial points weight (wi) benefit the model that has the best quality.
•
The amount of times the best model appears in each position is more uniformly distributed. This way, the best model doesn’t tend to be in top positions.
Finally, analyzing the second graph we reach the following conclusions: •
•
Run setups that have initial points weight (wi) lower than utilization points weight (wu) or selection points weight (ws) benefit the model that has the best quality. The difference between the values of ws and wu does not affect the performance of the model that has the best quality.
Considering all of the above, the new ranking schema is better than the old, since the best model appears in top positions more frequently. This way, the best model tends to be reused more times than with the old ranking schema. Also, we can say that our new ranking schema promotes the use of the best model, as long as the initial points weight is kept lower than the other weights. This way, the process
B. Case Study After the simulation, we conducted a case study to verify whether a gain in productivity could be achieved with BPCE, for the design of process models. The case study compares the task of modeling a simple business process with and without BPCE. In this case study we use the new ranking schema. The participants received a description of a business process for which they had to build a model. The process chosen is a new student registration for a graduate course of a fictitious university. We defined metrics that allow for the comparison of the task of process design with and without BPCE aid. We evaluate the development time and the correctness of the created models. The case study is conducted with two groups of people: a group modeled the process using only the information given, i.e., a small textual description of the process, explaining how the university conducts it. Another group worked on the same task, but with the aid of BPCE, i.e., using existing models. For the latter, the database of BPCE was populated with some models, with variable degree of usefulness for the task, with fictitious scores, mimicking what would be automatically attributed by BPCE in a long-term use scenario, considering the collaborative filtering system proposed in [20]. People from both groups have the same knowledge of business process modeling and no special knowledge of the registration process. Model development time was evaluated by comparing the time spent for modeling without BPCE with the time spent on the same task using BPCE. Correctness was evaluated through the verification of the model´s coverage, granularity and precision. These three issues were compared using the textual description of the process. The model’s coverage evaluates if the model includes all the required activities. The granularity evaluates if the modeled activities were designed at the correct level of abstraction. The model’s precision evaluates if only necessary activities were modeled. Additionally, group B, the one with BPCE, received six questions about the use of the tool. The results of the case study are described in Table II. The questions are described in Table III and their answers in Table IV. The case study conducted showed that the task of modeling can be easier, more efficient and more effective through the use of a collaborative business process modeling tool, like BPCE. Evidence of this is found on experiment’s data, as coverage with aid of BPCE is perfect, granularity is much better than without BPCE, and precision is also perfect with BPCE. Moreover, the modeling time with the use of BPCE was 25% smaller for group B than for group A. Considering we have a small sample, we showed that time for modeling was different with or without BPCE using ShapiroWilk test and Student’s t-test.
TABLE II.
CASE STUDY RESULTS Group’s results
Measures
Group A (w/o BPCE)
Coverage (% with correct coverage) Granularity (% with correct granularity) Precision (% with incorrect precision) Average Modeling time TABLE III.
Group B (with BPCE)
70%
100%
40%
70%
30%
0%
47,5 min
35 min
CASE STUDY QUESTIONS Questions
1 – Ease of use 2 - Model’s development task was facilitated 3 – Best features of BPCE 4 – Worst features of BPCE 5 – Overall evaluation (between 1 and 5)
Moreover, the simulation results show that process standardization can be facilitated by BPCE, because the best model is the model that achieves the best score, and so it is usually the first model in the search results list, being the one with higher chance of reuse. Nevertheless, weights shall be adjusted correctly. We can also presume that BPCE would be well accepted by the community, since it received good evaluations regarding task support, and was considered a simple and easy to use tool. On the other hand, we believe that an experiment in a real environment is necessary to confirm our conclusions.
6 – Suggestions for evolutions TABLE IV.
We also believe, although the case study does not investigate it, that the task of standardizing processes can be facilitated by BPCE, i.e., by the adoption of a collaborative design tool. Evidence that may support this, is the fact that standard deviations for granularity, coverage and precision are smaller when using the tool. Additionally, most respondents using BPCE based their new models on a few existing ones, and evaluated better the supplied model that was closer to the expected response. Thus, we suppose that, in the long run, designers building their models based on the best ranked ones would tend to end up with very similar models.
CASE STUDY ANSWERS Answers
1 – All participants praised BPCE’s interface and usability 2 – All participants answered yes
VII. FUTURE WORK Several issues appeared during prototype development. Due to time constraints, we intend to consider them on the next versions of the tool. A small list of issues is provided: •
Evolution of COPPEER – it is necessary to solve the problems of synchronization of replicated data, and access control, for protecting sensitive information, an important concern for organizations, regarding their processes’ models.
•
We use Shapiro-Wilk test to check whether distributions are close to a normal distribution. We used t-test to verify the similarity of the normal distributions.
Ontology based search – besides enhancing search, it allows for customization, including partitioning the search space onto business areas, with their proper jargon.
•
Shapiro-Wilk test applied to the distributions of modeling time of both groups resulted in the following values: WA = 0.86, p-valueA = 0.114 and WB = 0.90, p-valueB = 0.286. In the test we used 0.05 as value of alpha. Considering these results, we assume the distributions are normal.
Enhancing portability – it is necessary to prepare BPCE to use other modeling tools, not only RSM from IBM. As it is an Eclipse plug-in, supporting other tools that use the same environment shall not require an extensive work.
•
Based on the assumption above, we applied the t-test getting the following results: t = 2.58 and p-value = 0.0245. Therefore, we can say that time for modeling is different with or without BPCE, what supports our hypotheses that BPCE facilitates the design of new processes.
Support BPMN – as BPMN is OMG’s standard for modeling business processes, BPCE should be able to work with it. BPMN, in its version 2.0 [27], will also have a model interchange format, that can be adopted by BPCE.
•
Support to central repository – changing the tool architecture to also support a central repository, combined with a P2P network, may facilitate using BPCE in some organizations, where security concerns constrain the use of P2P solutions.
3 – BPCE’s simplicity of use and the model’s search feature 4 – A few participants mentioned BPCE doesn’t have negative points. Others mentioned the lack of a feature to remove published models 5 – 4 (average) 6 – Published models removal
VI.
CONCLUSIONS
As an overall finding, the case study showed that the task of modeling business processes with BPCE should be more effective, efficient and faster than doing the same task without BPCE. We believe, based on the results, that we can claim the usefulness of the tool and of collaborative modeling for a process design.
We intend to do an experiment to investigate the effectiveness of the tool for process standardization. Such experiment though is more complex, since it requires a larger number of designers, preferably in a real world scenario.
REFERENCES [1]
Y. Chang.: Why Haven’t We Mastered Alignment? The Importance of the Informal Organization Structure. MIS Quarterly Executive, Vol. 1, No. 2, Jun. 2002.
[2]
H. Hofmann e F. Lehner, “Requirements engineering as a success factor in software projects,” Software, IEEE, vol. 18, 2001, pp. 58-66. J. Miller and J. Mukerji, editors, MDA Guide Version 1.0.1 OMG 2003. J. Liebowitz, Building Organizational Intelligence: A Knowledge Management Primer, CRC, 1999. J. Nt, J. de Souza, G. Zimbrão, G. Xexéo, E. Neves, e W. Pinheiro, “A P2P Approach for Business Process Modelling and Reuse,” Business Process Management Workshops, 2006, pp. 297-307. H. Smith e P. Fingar, Business Process Management: The Third Wave, Meghan-Kiffer Press, 2003. M. May, Business Process Management – Integration in a Web-enabled Environment, Pearson Eductation Ltd. 2003. H. Smith and P. Fingar, IT Doesn’t Matter – Business Process Do., Meghan-Kiffer Press, 2003. S. Lippe, U. Greiner, e A. Barros, “A Survey on State of the Art to Facilitate Modelling of Cross-Organisational Business Processes,” in: Proceedings of the 2nd German Informatics Society (GI) -Workshop XML4BPM 2005, 2005, pp. 7--21. J. Mendling, G. Neumann and M. Nuttgens, A Comparison of XML Interchange Formats for Business Process Modeling, in Workflow Handbook, Future Strategies Inc. 2005. Object Management Group, MOF 2.0 / XMI Mapping Specification, v2.1.1. OMG, 2007. E. Rodrigues, J. Rodrigues, R. Mello, and F. Porto, “Mapping OO Applications to Relational Databases using the MOF and XMI”, Workshop on Integration and Transformation of UML models – ECOOP 2002, LNCS, vol. 2548. Spring-Verlag Heidelfeld, 2002. Object Management Group, Business Process Modeling Notation Specification, v.1.1. OMG, 2008. M. Parameswaran, A. Susarla, e A. Whinston, “P2P Networking: An Information-Sharing Alternative,” Computer, vol. 34, Jul. 2001, pp. 38, 31. J. Kubiatowicz, “Extracting guarantees from chaos,” Commun. ACM, vol. 46, 2003, pp. 33-38. K. Birman e T. Joseph, “Exploiting virtual synchrony in distributed systems,” SIGOPS Oper. Syst. Rev., vol. 21, 1987, pp. 123-138. L. Moser, Y. Amir, P. Melliar-Smith, e D. Agarwal, “Extended virtual synchrony,” Distributed Computing Systems, 1994., Proceedings of the 14th International Conference on, Pozman, Poland: 1994, pp. 56-65. T. Anker, G.V. Chockler, D. Dolev, e I. Keidar, “Scalable Group Membership Services for Novel Applications,” In Workshop on Networks in Distributed Computing, 1998, pp. 23-42. I. Keidar, J. Sussman, K. Marzullo, e D. Dolev, “A Client-Server Oriented Algorithm for Virtually Synchronous Group Membership in WANs,” Proceedings of the The 20th International Conference on Distributed Computing Systems (ICDCS 2000), IEEE Computer Society, 2000, p. 356. J.A. Rodrigues Nt., J. Souza, G. Zimbrão, G. Xexeo and M. Miranda, Business Process Reuse and Standardization with P2P Technologies, in Handbook of Research on Virtual Workplaces and the New Nature of Business Practices, 2008. M. Miranda, G. Xexeo, e J. de Souza, “Building Tools for Emergent Design with COPPEER,” Computer Supported Cooperative Work in Design, 2006. CSCWD '06. 10th International Conference on, 2006, pp. 1-6. P. Gomes, F.C. Pereira, P. Paiva, N. Seco, P. Carreiro, J.L. Ferreira, e C. Bento, “Using WordNet for case-based retrieval of UML models,” AI Commun., vol. 17, 2004, pp. 13-23. T.H. Davenport, “The Coming Commoditization Processes”, Harvard Business Review Article, pp.: 100-108, Jun 2005. B. Meyer, C. Mingins, e H. Schmidt, “Providing trusted components to the industry,” Computer, vol. 31, 1998, pp. 104-105.
[3] [4] [5]
[6] [7] [8] [9]
[10]
[11] [12]
[13] [14]
[15] [16] [17]
[18]
[19]
[20]
[21]
[22]
[23] [24]
[25] Eclipse Foundation, Available: http://www.eclipse.org/org. [26] Apache Lucene, Available: http://lucene.apache.org/. [27] Object Management Group, Business Process Modeling Notation Specification, v.2.0 RFP. OMG, 2008. [28] Y. Jang and J. Lee, "Factors Influencing the Success of Management Consulting Projects", International Journal of Project Management, 16, 1998. [29] H. de Vries, "Best Practice in Company Standardization", International Journal of IT Standards and Standardization Research, 4(1), 2006, 62-85. [30] D. Beimborn, F. Gleisner, N. Joachim, e A. Hackethal, “The Role of Process Standardization in Achieving IT Business Value,” System Sciences, 2009. HICSS '09. 42nd Hawaii International Conference on, 2009, pp. 1-10. [31] J.H. Holland, Adaptation in Natural and Artificial Systems: An Introductory Analysis with Applications to Biology, Control, and Artificial Intelligence, The MIT Press, 1992. [32] S. Brin e L. Page, “The anatomy of a large-scale hypertextual Web search engine,” Comput. Netw. ISDN Syst., vol. 30, 1998, pp. 107-117. [33] R. Reese e D.L. Wyatt, “Software reuse and simulation,” Proceedings of the 19th conference on Winter simulation, Atlanta, Georgia, United States: ACM, 1987, pp. 185-192. [34] M. Pidd, “Simulation software and model reuse: a polemic,” Simulation Conference, 2002. Proceedings of the Winter, 2002, pp. 772-775 vol.1. [35] M. Roussopoulos, M. Baker, D.S. Rosenthal, T.J. Giuli, P. Maniatis, e J. Mogul, “2 P2P or Not 2 P2P?,” Peer-to-Peer Systems III, 2005, pp. 3343. [36] N. Metropolis and S. Ulam, “The Monte Carlo Method,” Journal of the American Statistical Association, vol. 44, Sep. 1949, pp. 335-341. [37] A. Law and W.D. Kelton, Simulation Modeling and Analysis, McGrawHill Science/Engineering/Math, 1999.