Collaborative Spatial Decision-Making Scientific Report for the Initiative 17 Specialist Meeting
16th-19th September, 1995 Santa Barbara, California
Paul J. Densham, Initiative Leader Centre for Advanced Spatial Analysis Department of Geography University College London London WC1H OAP Marc P. Armstrong, Initiative Leader Departments of Geography and Computer Science The University of Iowa Iowa City, IA 52442 Karen K. Kemp, Initiative Leader NCGIA, Department of Geography University of California at Santa Barbara Santa Barbara, CA 93106-4060
National Center for Geographic Information and Analysis Report 95-14
TABLE OF CONTENTS Preface and acknowledgments ...............................................................................................ii 1. FRAMEWORK FOR THE INITIATIVE.......................................................................1 2. PARTICIPANTS.............................................................................................................2 3. MEETING FORMAT.....................................................................................................3 4. DEVELOPING A RESEARCH AGENDA.....................................................................3 4.1 Sunday small groups.............................................................................................3 4.1.1 Tool development (models and computation)...........................................3 4.1.2 Human computer interaction.....................................................................4 4.1.3 Problems and processes (institutional issues and use)..............................5 4.2 Monday a.m. small groups ...................................................................................5 4.2.1 How does the problem context constrain tool design?..............................5 4.2.2 Multiple representations...........................................................................6 4.2.3 Process intervention and empowerment....................................................6 4.2.4 Metrics for evaluation ...............................................................................7 4.3 Monday p.m. small groups...................................................................................8 4.3.1 Spatial data manipulation techniques ........................................................8 4.3.2 Generation of alternatives..........................................................................8 4.3.3 Evaluation of representations....................................................................9 4.4 Tuesday a.m. small groups .................................................................................10 4.4.1 Technology and innovation barriers ........................................................10 4.4.2 Theory.....................................................................................................10 4.4.3 Joe's cube.................................................................................................11 4.4.4 Invention decomposition.........................................................................12 4.4.5 Breakdown, failure and disaster...............................................................12 4.5 Tuesday p.m.: Toward a synthesis ...................................................................12 4.5.1 Research into tool development ..............................................................12 4.5.2 Research into tool use..............................................................................13 4.5.3 Research infrastructure............................................................................13 5. PRODUCTS OF THE INITIATIVE.............................................................................13 6. SUMMARY...................................................................................................................15 6.1 Related research activities at University of California at Santa Barbara.............16 6.2 Related research at State University of New York at Buffalo............................18 APPENDIX A. LIST OF PARTICIPANTS.....................................................................21 APPENDIX B. SPECIALIST MEETING AGENDA......................................................25 APPENDIX C. INITIATIVE PROPOSAL TO NCGIA BOARD...................................27 APPENDIX D. OPEN CALL FOR PARTICIPATION ..................................................39 APPENDIX E. POSITION PAPERS................................................................................41
i
PREFACE AND ACKNOWLEDGMENTS This is a report on the first meeting of the seventeenth NCGIA research initiative, entitled ÒCollaborative Spatial Decision-Making.Ó This meeting, held in Santa Barbara between September 16th and 19th, 1995, was attended by representatives of the NCGIA, university faculty members from North America and Europe, and representatives of US companies. The contents of this report are compiled from the notes of the organizers and student rapporteurs, materials prepared during the meeting and the personal notes of several of the participants. The Initiative leaders were assisted in the planning and organization of the specialist meeting by a steering committee consisting of Mike Batty, Joe Ferreira, Britt Harris, and Tim Nyerges. Their contributions to making the meeting a success are gratefully acknowledged. The Initiative leaders wish to thank the management and staff of the Upham Hotel, Santa Barbara, for their hospitality. We also wish to thank Sandi Glendinning and LaNell Lucius of the NCGIA Office in Santa Barbara for their hard work in organizing the logistics of the meeting. Karen Kline, Mike Figueroa, Emanuel Nordjoe and Omer Atesmen provided valuable assistance during the meeting. The meeting and this report are contributions to Research Initiative 17, Collaborative Spatial Decision-Making, of the National Center for Geographic Information and Analysis. We acknowledge support from a grant by the National Science Foundation (SBR-88-10917).
ii
NCGIA Research Initiative 17: Collaborative Spatial Decision-Making Scientific Report for the Specialist Meeting
1. FRAMEWORK FOR THE INITIATIVE The idea for an Initiative on Collaborative Spatial Decision-Making (CSDM) first arose from discussions between Armstrong and Densham. They had worked together on various elements of the research agenda for Initiative 6 (Spatial Decision Support Systems) and saw the need to move the focus of decision support research from individuals to groups as a natural outgrowth from Initiative 6. The general objective of a specialist meeting is to develop and refine a research agenda by: · refining the dimensions of the research area, the state of current knowledge, and the important research issues within it; · identifying and prioritizing those research issues which should be addressed by the NCGIA within the time-frame of the initiative; and · identifying ways in which the NCGIA's efforts can be integrated with other work in the field, including joint research, exchange of personnel, and mechanisms for the dissemination of findings. Five major objectives for Initiative 17 were stated in Densham and Armstrong's proposal to the NCGIA's Board of Directors (Appendix C): 1. examine the body of theory on the design, implementation and use of computer supported cooperative work (CSCW) environments and evaluate its utility for GIS/GIA; 2. identify impediments to the development of highly interactive, group-based spatial modeling and decision-making environments; 3. develop methods for eliciting, capturing and manipulating knowledge bases that support individual and collective development of alternative solutions to spatial problems; 4. develop methods for supporting collaborative spatial decision-making (CSDM), including methods for managing spatial models; and 5. extend capabilities for supporting multicriteria decision-making in interactive, CSDM environments. During preparations for the Specialist Meeting, Armstrong and Densham have published papers on various aspects of CSDM (see Section 5) and they both participated in a NATO Advanced Research Workshop, entitled Cognitive Aspects of Human-Computer Interaction for Geographic Information Systems, that addressed some research issues for CSDM. Held in
1
Palma de Mallorca, Spain, during March of 1994, this meeting was organized by Timothy Nyerges - a member of Initiative 17's Steering Committee. In consultation with the Steering Committee, the initiative leaders refined their initial objectives and five cross-cutting research topics were identified as potential topics for discussion during the Specialist Meeting: 1. The development of a metaplanning capability: methods to elicit, capture and manipulate knowledge bases that support individual and collective development of alternative solutions to spatial problems. 2. The design and implementation of methods to improve decision-makers' interaction with spatial analysis tools, including modelbase management systems, visualization and display tools, and group-based user interfaces. 3. The provision of mechanisms that enable decision-makers to evaluate alternative solutions to a problem. 4. The identification, selection and incorporation of methods for resolving spatial conflicts in interactive, CSDM environments, including multicriteria decision-making. 5. The characterization of CSDM processes, including but not limited to the specification of task models in various domains such as environmental, transportation, natural resource, economic development, emergency management, and other high priority subject domains; and investigations which elucidate the use of CSDM technology in various CSDM subject domains. These themes were made public when an open call for participation was issued during March of 1995 (Appendix D). 2. PARTICIPANTS 2.1 External participants The organizers sought to bring together a wide range of researchers from academia as well as from the public and private sectors. In particular, the organizers encouraged the participation of researchers with interests in linkages between GIS and group-based decision-making, researchers with international links and researchers who could provide specific examples of the strengths and weaknesses of GIS in CSDM research. Fifteen of the external participants were affiliated with universities in 5 countries (US, Canada, UK, Germany and Switzerland). Two of the participants work for US private corporations (one of these has recently moved to an academic position, but retains a part-time relationship with his prior employer). Three participants work for US public sector agencies. Two additional international participants (David Grimshaw, UK, and Paul Hendriks, the Netherlands) were not able to attend at the last minute, but as their position papers were included in the set reviewed by others they are included in Appendix E. Furthermore, Mike Batty, one of the Steering Committee, had last minute demands that prevented him from attending the meeting.
2
2.2 NCGIA participants A total of five NCGIA faculty, students and staff attended the meeting: one member of faculty, one research staff member, and two graduate students from UCSB, plus one research staff member from NCGIA Maine. NCGIA participants represented departments of geography and spatial information engineering and science; in addition, Professors Helen Couclelis and Waldo Tobler from NCGIA Santa Barbara attended for portions of the meeting. 3. MEETING FORMAT 3.1 Preparation Formal preparation for the specialist meeting began in July of 1993 when Paul Densham and Marc Armstrong made a proposal to the NCGIA Board, meeting in Buffalo. A revised and expanded proposal for Approval in Principle was submitted to the Board at their meeting in December, 1993, and Approval in Detail was granted in July, 1994. An open call for the meeting was distributed during April, 1995, to several news-groups (comp.infosystems.gis, comp.groupware, bit.listserv.geograph, news.announce.conferences). Potential attendees were asked to submit a three to five-page position paper and a brief biographical sketch by June 1st, 1995. Each paper was reviewed by the Initiative leaders and members of the steering committee. The position papers were posted on the NCGIA WWW server (http://www.ncgia.ucsb.edu) and participants were asked to read the papers before arriving in Santa Barbara for the specialist meeting. 3.2 Working group formats Participants were not asked to prepare a formal presentation for the meeting; instead, they were asked to prepare for a mixture of plenary and small working group sessions by reading the position papers submitted by the other participants and considering these in light of their own particular areas of expertise. Appendix B contains the meeting schedule. The small working groups discussed issues identified in the plenary sessions. Each group focused on a different issue, or set of issues, and participants chose the one they attended. The selfselection process for these groups worked well, with most of the groups having a balanced membership. Each group selected a spokesperson to report their discussions and findings to the larger group. To help present their results, participants had access to DOS and Macintosh word-processors, laser printers, overhead transparencies, and other, more traditional display media and materials. After the first morning, plenary sessions were devoted to working groups' reports and discussion of them. Each plenary session was chaired by a meeting participant to help direct the form and content of the session and to prevent the initiative leaders from unduly guiding the discussion. 4. DEVELOPING A RESEARCH AGENDA 4.1 Sunday small groups 4.1.1 Tool development (models and computation) Presented by Joe Ferreira This session started by trying to identify the classes of problems in which CSDM can be used and to map these problems to appropriate tools. The set of problems identified ranged from 3
specific to general and included: discrete spatial choice and the need to represent values and preferences; managing uncertainty and error; generation of alternatives and the expansion of the choice set; information filtering and management; accommodating multiple value systems; providing for information demand and data browsing; interacting spatial decisions; resistance to decision-making through consensus building; education about the problem or decisionmaking procedures; and, optimizing service delivery. Mapping of problems to tools proved difficult and a related mapping of tools to a four-way classification of space and time (same vs. different on both dimensions) was begun. Sub-topics were identified for a number of problems and discussion then moved to a consideration of whether there were any grand themes in these problems. Several were identified, including spatial search, representation issues, generating and analyzing alternatives, process management, and the need to decompose the problem context to achieve the desired mapping to tools. 4.1.2 Human computer interaction Presented by Rachel Jones This group met to discuss how a possibly disparate set of users would be able to interact with software in a collaborative setting. The group felt that research should focus on the human dynamics of collaboration, rather than the technology per se, because while the technology will change rapidly, the dynamics of human behavior will not. The first issue that was presented concerned the level of intervention that would be appropriate in a particular context. By intervention, it is meant that the system would possibly provide a context-sensitive structure that enables users who are otherwise unfamiliar with a system to navigate through it. Three levels of intervention were specified. The first, and most simple, is to replicate a path the user is guided along a deterministic sequence of steps. The second is to present alternatives to the user who selects from among them. The third is to provide a critique of the process. A second issue addressed is related to configurability. Different individuals, as well as different groups, have different views of a problem and its representation. One way to consider configurability is to specify a set of generic operations that would encompass the types of operations, information access and user tasks that need to be supported by the system. If this list is compiled and made available it can be structured hierarchically to provide different ÒdepthsÓ of intervention. This presumes, however, that an analysis of the tasks required to accomplish goals has been conducted. The group decided that task analyses would prove useful in accomplishing the goal of supporting intervention. A taxonomy of usage patterns is required that is organized around the topology of time and space (same-place and same-time to different-place and differenttime). Some of the most difficult problems result from ÒsmallÓ changes: moving from two people working together on a map in one office to working on the same map in different offices, for example. Task analysis would also help to identify a series of primitives - generic operations that support information access and user tasks. When working on a map, for example, people often want to show or highlight some information, add or remove information, or otherwise manipulate the map's content. The group also recognized that there are user and organizational characteristics that might color the process in which tasks are attempted. Finally, the group considered the effect of roles. Different roles, such as facilitator or mediator would need to be supported in a way that would best enable them to accomplish their tasks. One of the roles of participants, for example, is to understand a problem so that it can be defined and alternatives generated and evaluated. A key element in this process is learning that enables users to understand their problem better. One group member recounted 4
how when a group of people were shown an aerial photograph of their town, they were amazed at the amount of green space that they saw; they had never before seen such a display and it changed their perception of the problem. 4.1.3 Problems and processes (institutional issues and use) Presented by Mike Shiffer This group attempted to come to terms with the institutional contexts in which CSDM systems might be used. In large part, the group was stymied by a lack of context: it was not evident what processes must be supported. Who should be involved in a decision is contextdriven and cannot be discussed in a generic sense; indeed, even the set of tools that is made available for use is contextually-conditioned. Any system has embedded within it an implicit and explicit character - its Òspirit.Ó Furthermore, a system has an embedded political structures that it supports. Discussion of this issue raised several questions: 1. What types of conflict resolution tools are made available to users? 2. Is a majority vote the exclusive way to resolve deadlocks, or does the system accommodate plurality or vetoes? This group also grappled with the issue of structure. How much structure is needed to facilitate support without restricting it? What skills are assumed on the part of the user to use tools and develop appropriate decision-making strategies? 4.2 Monday a.m., small groups 4.2.1 How does the problem context constrain tool design? Presented by Tom Pederson The group started by acknowledging that a single problem formulation can be addressed by groups in a variety of contexts and that this might affect how the decision process is structured. Thus, a group of friends might proceed in a very different manner to one in which all the members are strangers. To support groups with varying characteristics, systems must be designed to accommodate a range of constraints. Such constraints can be placed in three classes: environmental, procedural and structural. Whilst environmental constraints define the context of the decision process, procedural constraints determine how the process evolves and structural constraints define the capabilities of a CSDM system's tools. These three types of constraints interact. An attempt was made to try and decompose the three types of constraint into their constituent elements. It was recognized, however, that this would require picking specific examples of CSDM and decomposing them in a comparative analysis to see what is common and what is unique to each case. Further discussion focused on using the three types of constraint as the axes of a ÒconstraintÓ space. The labels of the axes were refined to reflect the group's idea that the space is better thought of as an ÒinteractionÓ space that captures more of the richness of CSDM. Thus, the dimensions were relabelled as: institutional (environmental), activity (process), and physical setting (structural). 5
The group identified four researchable questions: 1. How do we identify promising cells in the space for study? 2. How do we identify paths of interest (trajectories) and match them to problem types? 3. Can we highlight cells where ÒspatialÓ is especially important, or we are uncertain about its importance? 4. How do we identify the technical developments that are likely to yield the biggest Òbang-for-the-buckÓ across the full range of cells to show where tool development efforts are best directed? 4.2.2 Multiple representations Presented by Jim Proctor Discussion in this session began with an attempt to develop a group understanding of what was being meant by the term Òmultiple representationsÓ. A number of different aspects were discussed, including views versus models, internal versus external, interests versus positions. The group did not develop a definitive answer to ÒWhat is a representation?Ó but concluded that there are mental (including psychological, social, cultural and cognitive aspects), visual and computational perspectives. A second fundamental question, then, was ÒHow to represent?Ó Should we use just maps or should we include language, databases, tables, graphics and GIS models? After setting this framework, the group quickly developed the following research questions: 1. Given two formal models (such as GIS models), can the similarities and differences be identified independent of process? In other words: are there are measures for information equivalence, or for computational equivalence? 2. Can we represent different interests in a common data space? 3. What level of semantics is necessary to represent interests? 4. What dimensions of representations are most important for comparison of stakeholder interests and positions about locational conflicts? 4.2.3 Process intervention and empowerment Presented by Steve Carver This group considered two issues and their interaction: process intervention and differential empowerment. The first issue addresses the problem of agency. The way in which software is written, the types of tasks supported and the level of access that individuals have to different data will all condition and shape the nature of discussion. The group considered the idea that software and the manner in which systems are used force designers to face and make complex trade-offs between simplicity and complexity, and flexibility and structure. For example, if the system is structured and participants take issue with the structure, then the system will be viewed unfavorably. If, however, a multiple-level system were available, and users could change between levels of structure, this additional flexibility would contribute to usability.
6
The act of participation in decision-making processes provided one motivation for the discussion of empowerment. Two aspects of access were considered: access to technology in a public decision-making context and what might be called Òconceptual accessÓ - in the sense that individuals who are unfamiliar with computer use and with geographical concepts would be disadvantaged relative to others who have more specialized training in these areas. There is a possibility (a likelihood even) that an Òinformation underclassÓ could arise as a consequence. In fact, the willingness of individuals to engage in a debate would be affected if they view themselves as likely losers in a technology-supported debate. The group identified a series of researchable questions: 1. Can adaptive user interfaces effectively be applied to CSDM problems? 2. Can users be profiled to structure CSDM systems in appropriate ways? 3. What is the role of human and software agents within CSDM for intervention and empowerment? 4. To what extent do GIS, spatial analysis, and the Internet provide appropriate tools for empowerment? 4.2.4 Metrics for evaluation Presented by Brenda Faber The group attempted to define approaches that could be used to evaluate the success of implemented CSDM environments. These metrics were stratified into metrics that can be used to measure the degree of participation, and the quality of the solution and the process that generated it. Discussion of metrics of participation focused on how to measure the number of participants as well as the amount of participation by each person. While metrics of solution quality measure the quantitative differences between pairs of alternatives, metrics of the quality of solution processes must include factors such as the number and type of deadlocks, user satisfaction, and the degree to which participants evaluated a range of nontrivial solutions. The group identified the following research questions: 1. Does CSDM create better informed stakeholders (who have a shared, consistent understanding of the issues being addressed), attract more participants, and retain more participants? 2. Does CSDM result in greater access to and use of information by each person? 3. Does CSDM result in decisions with an improved level of quality (outcomes)? 4. Does the use of CSDM expand the number of non-trivial alternatives that are generated?
7
4.3 Monday p.m., small groups 4.3.1 Spatial data manipulation techniques Presented by Steve Frysinger Because this group was large, it divided into two subgroups that reconvened prior to the plenary session to synthesize their discussions. The first idea that was discussed concerned the use of existing strategies for collaboration as analogies that could be developed into computer-mediated processes. Blackboards, for example, enable people to write over the top of someone else's material and gestures, which are effective ways of communicating, are often lost in computer-supported decision-making contexts. Because it is often useful to employ graphical Ògestures,Ó such as circling an area to draw attention to it, either to indicate agreement or disagreement, the idea of a spatial markup language was advanced. Theories of argumentation were proposed as a mechanism to frame discussion about the kinds of actions that might need to be supported in CSDM environments. The provision of different types of bargaining tools, for example, might be appropriate in different contexts. One questions that arises is "What role could agents play in negotiation?" Agents would need to be trained to help a user clearly advocate their particular approach to problem-solving. One topic of discussion that emerged from both groups was the maintenance of audit trails that support the reconstruction of the sequence of actions and activities that led to a particular outcome. These audit trails would need to be time-stamped to determine when different actions were taken and might prove useful during discussions about why particular results are judged to be superior to others. The group identified the following researchable questions: 1. Can we use existing systems as analogies to support the development of CSDM software? 2. How do we represent differences among problem representations? 3. Can advocacy agents and bargaining tools be designed to help us advocate our own approach and understand what we are willing to give up in order to keep something else? 4.3.2 Generation of alternatives Presented by David Bennett A commonly-adopted strategy for addressing semi-structured problems is to generate and evaluate a number of alternative solutions, or solution processes. Thus, a computersupported system must facilitate the generation of alternatives. The group discussed the metaphor of genetic evolution to describe the process in which certain activities, processes and solutions are judged to be ÒfitÓ given other possible paths. Given a particular starting point, a solution or solution process could be perturbed to mimic a new generation in a genetically mixed population. This perturbation could be viewed as a mutation. If this process is allowed to advance through several generations, ÒfitnessÓ can be evaluated at each step. Only those elements that are judged to be most fit at each step are further perturbed and allowed to propagate. In this way, fruitful and promising paths to solutions could be generated.
8
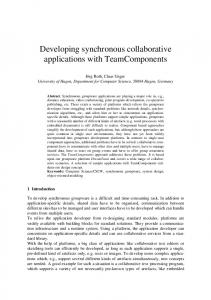
This group identified four researchable questions: 1. Can metaphor be used as a research strategy? 2. Does a genetic algorithm mimic a collaborative agreement process? 3. Can a collaborative agreement process elicit a merged or reconciled set of preferences? 4. Can algorithms which enhance diversity improve the quality of the adopted solution? 4.3.3 Evaluation of representations Presented by Seymour Mandelbaum This session began with each participant briefly stating his or her definition of Òrepresentation.Ó It became apparent that the resulting definitions needed a cognitive framework - finally expressed by Mike Shiffer in the following diagram. Each of the four corners of the diamond identify different aspects of representation, each aspect is linked to the adjacent one through some transformation process (indicated by the uni-directional arrows). Thus, it seems possible to evaluate representation from many different perspectives. Each aspect is individually rich in research opportunities while the links between adjacent corners also provide fruitful areas for research. World view - theoretical representation of representations Meta issues
Influence on shared Effects understanding
Representation
Process of Techniques creating representations
Artifacts Representational tools (simulation, ...)
A number of research questions were identified: 1. How do the design of IS and collaborative processes variously impact the address to multiple representations (address was defined to mean articulation, or translation)? 2. How can stakeholders' satisfaction with the representation of their interests be measured? 3. How can GIS and spatial data be used to enable or restrict multiple representations? 9
4. Do the unique aspects of spatial information systems hinder us or help us to merge multiple individual representations? 5. What are the aspects of maps that can be manipulated to influence a collaborative process? (We need to study the link between artifacts and effects.) 6. To what extent do stakeholders/groups learn from each other in this process of plural representation? 7. How do we represent collaborative processes? 8. What is the impact of different representations on multiple users? 9. What are the aspects of participants' interests that can be represented by different techniques? 4.4 Tuesday a.m., small groups 4.4.1 Technology and innovation barriers Presented by Rene Reitsma The group considered two barriers that must be overcome to improve the use of CSDM software. The first barrier is latency that can be divided into two types. The first concerns system performance: if response times increase as complex models are developed and used, then the number of alternatives that can be considered in a same-time, same-place context is reduced. This could lead to decreased user satisfaction with the system. The second type of latency considered centers on the issue of tool preparation. The group discussed the idea of successive refinement of models: it may be possible to use Òquick-and-dirtyÓ models in the earliest stages of a continuous process of decision-making but later on, as the decision-process unfolds, effort can be focused on the development of those models that show the most promise. Marginal cost was suggested as one mechanism for determining the relative suitability of tool preparation and use. The second barrier discussed by the group was distance. Participants raised the issue of asynchronicity of use and discussed a possible environment in which individuals could enter and leave the decision-making process that would take place in a shared environment. The metaphor of a MUD (multi-user dungeons) game was discussed in this vein. 4.4.2 Theory Presented by Thomas Gordon This group examined the ways in which alternative theoretical frameworks could be brought to bear on CSDM problems. Three main theoretical stances were discussed: economics and decision theory; argumentation theory and dialectics; and adaptive structuration theory. The group also considered the environment in which these theoretical frameworks would be used and noted that there are two key dimensions: the availability or otherwise of resources; and the degree to which the goals of a CSDM problem are well-defined. The location of any given problem in the space defined by these two axes will help to indicate the suitability of the different theoretical approaches for that problem. The group then returned to a discussion of the attributes of argumentation theory and suggested that it is well-suited to a broad range of CSDM problem types. 10
4.4.3 Joe's cube Presented by David Coleman The group began by examining the initial formulation of ÒJoeÕs Cube.Ó The cube arose from a desire to provide a means to map tools to problem contexts. The cube has three axes: physical setting, environmental setting and procedural setting. The group discussed at some length what each of these axes represented. The physical setting was the most clearly defined axis since the four elements are clearly distinguished: same-time, same-place; same-time, different-place; different-time, same-place; and different-time, different- place. The environmental setting axis was expressed in the context of a coupling index that ranges from Òtightly coupled,Ó representing a small group of people with similar goals working on a clearly defined project, to Òloosely coupled,Ó where there is a large group with dissimilar goals working on a problem which is multi-faceted. The procedural axis is the most problematic to refine. Beginning with a simple idea of the axis representing the progression of decisionmaking from preparation, to review, analysis, evaluation and decision, the group visualized a possibility that this axis might in fact be a loop or cylinder. After acknowledging that a decision-making process could move through various levels on the physical and environmental axes, the group visualized a spiral moving through the space within the cube that depicts the decision-making process as it cycles through a number of similar procedural stages. The cube gradually evolved into a conceptual framework within which it would be possible to examine a number of different problem domains. Thus defined, the cube allows CSDM problem contexts to be decomposed in such a way that similarities and differences between them can be compared once the cells have been filled with appropriate tools or techniques. It may be necessary to refine the definitions of the axes differently for different domains. At the end of the session an effort was made to use the cube to examine the very simple, and pertinent, spatial collaborative problem of a group of people trying to decide which restaurant to choose for dinner. The group frequently returned to the question of the spatial dimension and wrestled with how it should be expressed within the cube. One suggestion was to impose a fourth dimension to represent the spatial domain, but it was not possible to conceive how that would prove useful. No conclusive spatial aspect of the cube could be identified. The group concluded that although the cube may be useful in many collaborative decision-making studies, it would nevertheless be useful if constrained solely to CSDM problems. A set of relevant research questions were posed: 1. Can this model (or some other model) of an interaction space be used to help us map the problem context to the tools? 2. What techniques can be employed to define the elements along the axes, especially the procedural axis? Could ethnographic studies help? 3. Can we study, compare, and contrast the patterns of cells filled in the cube when the same model is applied in different problem domains? 4. How can we define the unique spatial components of the cube and its cells? Is it simply problem specific? 5. What do the cells contain?
11
4.4.4 Invention decomposition Presented by Doug Johnston This group discussed several themes that are essential to the development of systems that are well-received by users. The first, function, assumes that individuals are using a system in a same-time, different-place mode. In such cases, communication bandwidth plays an important role. Users may require concurrent access to spatial objects and they may need to annotate and highlight salient aspects of these objects. In such environments a process of spatial argumentation must be supported. This may take place in either geographical space or attribute space. Certain bookkeeping activities were also considered to be essential to the successful implementation of systems: an archival storage and access mechanism, for example. Finally, the group considered the potential impact of information overload on participants and suggested that filtering mechanisms be developed. 4.4.5 Breakdown, failure and disaster Presented by Mike Shiffer This group examined the nature of adverse outcomes on system use. They first considered technical problems that can erode confidence in a system. Clearly, an experience such as a system crash might lead users to view a system as Òtainted.Ó More subtle impacts, such as the effect of extreme latency on system use, were also considered to be important technical problems that must be treated. The second class of problems considered centered on the idea of process and the development of trust that is fostered among users and with the use of the system to address problems. The group also considered issues such as anonymity and the role(s) that the facilitator should play during the decision-making process. Finally, user interface and system complexity were considered once again because overly complex software would discourage use and lead to failure. 4.5 Tuesday p.m.: Toward a synthesis During the final lunch break, five groups met to individually consider the synthesis of the meeting discussions and to formulate a set of relevant research questions. These questions have been grouped below under two headings: research into tool development and research into tool use. Participants also made some suggestions about the role of NCGIA in fostering and supporting CSDM-related research. 4.5.1 Research into tool development 1. How do we best take advantage of what has been done in cognate fields to improve CSDM environments? 2. What is the role of user needs and requirements analyses in CSDM research? 3. What spatially-related functions are required to support CSDM? 4. How can we tailor a system to an individual's needs? Are information filters, advocacy agents and other features required to support a range of users? 5. How can we tailor a system to a particular group to take into account the effects of location, group makeup, and other factors?
12
6. How can we use hypermedia to aggregate opinion and plans and best present commonalties and differences amongst alternatives? 4.5.2 Research into tool use 1. What is the nature and meaning of representation in CSDM? 2. What dimensions can best be used in comparative studies to assess the effectiveness of CSDM software? 3. How does a particular problem formalization and CSDM system implementation affect the decision-making process? 4. Which forms of intervention are appropriate in different contexts? 5. What are the distinct roles of the participants within a CSDM framework? 4.5.3 Research infrastructure Participants expressed a need for an NCGIA-supported World Wide Web site that will act as a repository for information on the Initiative's research program and that will maintain links to sites that host descriptions of CSDM-related research conducted by others. 5. PRODUCTS OF THE INITIATIVE 5.1 Products of the Specialist Meeting The primary product of the Specialist Meeting is the research agenda. Other items have been identified as potential products of the Initiative. 5.1.1 Bibliography While there was some discussion that the bibliography be organized within the framework suggested by Lew HopkinsÕ summary contexts, the group preferred that it be based on keywords. Participants will be sent the list of appropriate keywords and asked to code their own position paper references and other relevant references before submitting them to NCGIA for incorporation into a master bibliography to be published as a technical report 5.1.2 Closing conference The group strongly recommended that the initiative leaders begin working on the establishment of a ÒI-17 closing conferenceÓ to be held in about 2 years time. This meeting may be similar in organization to a NATO ARW. Papers offered for presentation at the meeting will be referred in their entirety and collected into a formal published book. The conference is to be presented now as a challenge to meeting participants to encourage them to move forward on research issues identified here and to be prepared to demonstrate to their colleagues progress they have made since this meeting. 5.1.3 WWW homepage for I-17 The group requested that the homepage for I-17 be maintained and updated to provide for continued collaboration between meeting participants. The homepage may provide a number of services including: 13
· a draft of the meeting report; · links to participantsÕ relevant homepages; · a hot-linked version of the bibliography; · calls for papers for relevant conferences at which meeting participants may wish to present I-17 related papers; and · a draft proposal for a closing conference (this document is to be made available via the I17 homepage in order that meeting participants can assist the initiative leaders in identifying and obtain funding for the closing conference). 5.1.4 Book and journal articles The group was not supportive of the idea of a book arising immediately from this meeting but agreed that discussion between meeting participants to develop joint papers should be encourage. 5.1.5 Conference sessions Several conferences were identified as likely places for papers on CSDM. Participants will cooperate through the I-17 WWW homepage to develop potential paper topics. Before the end of the specialist meeting, a special session was organized for the next International Conference on Integrating GIS and Environmental Model. 5.1.6 Critique of the meeting as a collaborative effort It was suggested that one or more participants of the meeting with relevant experience in the area be enlisted to write a very brief critique of the meeting as a collaborative effort. Participants felt that such a review would be an interesting byproduct of the Specialist Meeting forum. 5.2 Papers prepared to date 5.2.1 Refereed journals Armstrong, M.P. (1994) Requirements for the development of GIS-based group decision support systems. Journal of the American Society for Information Science 45(9): 669677. Armstrong, M.P. (forthcoming) Is there a role for high performance computing in GIS? Journal of the Urban and Regional Information Systems Association. Densham, P.J. and G. Rushton (forthcoming) Providing spatial decision support for rural service facilities that require a minimum workload. Environment and Planning B. 5.2.2 Book chapters Armstrong, M.P. and P.J. Densham (1995) A conceptual framework for improving human-computer interaction in locational decision-making. In Nyerges, T., D.Mark, R. Laurini, and M. Egenhofer (eds.) Cognitive Aspects of Human-Computer Interaction for Geographic Information Systems. Kluwer, Dordrecht: 343-354. 14
Densham, P.J. and M.P. Armstrong (1995) Human-computer interaction considerations for visual-interactive locational analysis. In Nyerges, T., D. Mark, R. Laurini, and M.Egenhofer (eds.) Cognitive Aspects of Human-Computer Interaction for Geographic Information Systems. Kluwer, Dordrecht: 179-196. Densham, P.J. (forthcoming) Visual interactive locational analysis. In Longley, P., and M.Batty (eds.) Spatial Analysis: Modeling in a GIS environment. GeoInformation International, Cambridge 5.2.3 Conference proceedings Armstrong, M.P. and P.J. Densham (in press) Toward the development of a conceptual framework for GIS-based collaborative spatial decision-making. Proceedings of the Second ACM Workshop on Advances in Geographic Information Systems, Gaithersberg, MD Armstrong, M.P. and P.J. Densham (1995) Cartographic support for collaborative spatial decision-making. Proceedings of the 12th International Symposium on Automated Cartography (Auto-Carto 12), Bethesda, MD: 49-58. Densham, P.J. and M.P. Armstrong (1994) A heterogeneous processing approach to spatial decision support systems. In Waugh, T.C., and R.G. Healey (eds.) Advances in GIS Research: Proceedings of the Sixth International Symposium on Spatial Data Handling, Volume 1. Taylor and Francis, London: 29-45. 6. SUMMARY During the course of the specialist meeting, participants developed a research agenda for CSDM which centers around 2 major themes: tool development and tool use. Research questions that relate to tool development can be grouped into those concerned with assessing and defining the tool requirements of individuals and groups, those that seek to exploit developments in cognate fields, and those that focus on the peculiarly spatial aspects of CSDM. In the case of tool use, research questions can be grouped into those that examine representation, those that seek to assess the effectiveness of CSDM software, and those that are concerned with the roles of users and mediators during CSDM and how they relate to different forms of CSDM software. One of the outcomes of the specialist meeting is that a cadre of researchers have discussed the impediments to the widespread adoption of CSDM and have developed a common understanding of the magnitude and relative importance of these impediments. This shared understanding provides a starting point for research under the aegis of the Initiative. Many of the participants were working on parts of this agenda before the specialist meeting, others have indicated that they will adopt elements of it in their own research. A WWW server is planned to help these researchers coordinate their work and to be informed of what others are doing. It is important to note that the formal termination of the initiative (currently planned for the summer of 1997) will not signal the end of research on CSDM. Rather, the research carried out during the life-span of the initiative will further refine the research agenda and make it accessible to a wider research community.
15
6.1 Related research activities at University of California at Santa Barbara At UCSB, a small working group has been formed to continue work on topics related to this research initiative. This working group has defined six major research areas in Collaborative Spatial Decision Making resulting from discussions at this meeting. Most of these research areas are not unique to the spatial domain, but their solutions in the spatial domain require modification of existing models and development of new models and model interfaces. 6.1.1 Assess the usefulness of existing representations of spatial information for representing the spatial aspects of the interests of participants in multiparty decision making Using a spatial decision support system to model and analyze spatial problems requires an adequate representation of the objectives and interests of the participants of the problem. This requires a sophisticated understanding of the geographical conceptions of the problem that are inherent in participantsÕ interests. While one representation may be appropriate for one group and their interests, it may not adequately represent others. If the representations of the interests that are used in various models or presentations of information are not consistent with all participants' individual conceptions and across the decision space, then the results of models and decision support systems will not contribute to resolving disputes or producing collaborative decisions. Research is needed to identify typical spatial conceptualizations of problems for classes of spatial problems and for typical stances in these problems. Evaluations of the effectiveness of different existing methods of representing these conceptualizations can provide useful input to the design of spatial decision support systems and models for collaborative decision making. 6.1.2 Modeling with multiple data sets, multiple models, and multiple problem representations In a computing environment designed to support collaborative decision making between several groups, often there is not complete agreement upon the data set to be used and the model to be employed. Thus it may be necessary to apply a model to any of a number of different data sets or to use any data set in all models. Thus a computing environment must be available to support multiple models and data sets, plus an interface which can aid in comparing alternatives, measuring differences between them, and presenting/viewing such alternatives. For a spatial CSDM example, consider a situation in which one group in a decision process would like to use a median location model to locate ambulance stations in an urban area, while another group insists on the use of a maximal covering problem. While both groups agree to use the same data set, two different models will be employed. In order to communicate between groups, one modelÕs output (say sites and weighted distance) needs to be compared in terms of the other model's objective (coverage within some distance standard). Although this sounds simple, negotiation would require generating and presenting compromise solutions. To do that would require one of two techniques: 1) a multiobjective model which supports both objectives, or 2) a methodological bridge which can systematically integrate two independent models with weights and structural conditions which can be used to identify compromise solutions. The first approach requires that the integrated model exists in the first place and that all integration is done in advance and has been anticipated. The second approach has never been attempted or theoretically scoped out. 6.1.3 Generating alternatives A major need in the support of collaboration in spatial decision making is the capability to generate alternatives that achieve specific objectives or have specific spatial qualities. 16
Frequently, however, decision makers are not able to specify all their objectives completely, thus some objectives remain hidden or private. Brill, Hopkins and others have argued that when hidden objectives are exposed, solutions which were once considered inferior can now be considered noninferior. This argument leads to a natural conclusion: since it is probably impossible to elicit all objectives from groups of decision makers, it is important to be able to generate both noninferior solutions and close to noninferior solutions. Techniques that support collaborative decision making must be capable of generating close-to-optimal alternatives, of searching for good compromise solutions, and of searching for solutions that differ spatially but are not very different in performance. Collaborative decision making involves generating feasible alternatives among many individuals or groups. It is often difficult to formulate problems to include feasibility factors such as political aspects, human perceptions, safety factors, aesthetics, etc. Some process of visualizing, evaluating, and adjusting model generated alternatives is required to develop a feasible group consensus. Techniques need to be developed to intelligently explore the decision space of spatial problems and to look for good (feasible) solutions to ill-defined problems. 6.1.4 Revealing preferences and objectives Economists often infer the relative value of various objectives of a decision maker by determining which weights yield an optimal choice similar to that made by the decision maker, or by asking a decision maker to choose between a series of pairwise comparisons. Understanding which objectives are important, whether voiced or not, can be important in reaching an accord. Clearly, systems which can help identify underlying preferences or objectives can aid collaboration and negotiation. Consider the following example: suppose a decision maker had selected a specific route for a highway alignment. According to an analysis based on tradeoff of objectives, it is clear that the decision maker is interested in ensuring that a specific town is close to the route. Using this information, it is then possible to generate tradeoffs in the route selection based on total vehicle miles traveled by others vs. the total vehicle miles traveled by people in this specific town. The decision maker may then see the cost of meeting his desired goal (getting close to a specific town) as a function of the cost to all others. Without identifying what objectives are present or the relative importance of those objectives, it may be impossible to tease entirely rational designs or negotiate a best compromise in a collaborative decision making setting. An important research objective is to look at alternatives for capturing decisions and revealing preferences in spatial problems, and to test various approaches in prototypes. 6.1.5 Problems of presenting multiple solutions and visualizing differences The presentation and comparison of alternative solutions in many spatial decision support systems is poorly conceived at best. Few examples exist where the interface design had an emphasis on the presentation of differences between alternative solutions. Thus, not only is it important to be able to study a given solution, but also to be able to spatially compare different solutions in terms of both objective and decision space attributes. Example designs and prototypes should be developed to test approaches which might be useful to accomplish this task. 6.1.6 Using animation to examine sensitivity to change and to examine change over time Animation can provide a tool for viewing how a solution changes as a result of changing model parameters. After a model is solved, it is often important to understand how sensitive a given solution is to the original model parameters. Often this is done by systematically changing the 17
modelÕs parameters to see if changes result in the same solutionsÑa process which can be very time consuming and produce results which are difficult to compare. Currently, for most spatial optimization models, there is no automatic way in which to generate and view such demonstrations of model sensitivity. Animating sensitivity analysis can aid in the understanding of input data error and uncertainty, and may allow complex spatial models and their solutions to be viewed in a form which may help reveal specific nuances (e.g. why is this area never chosen). Given that some model solutions are temporal as well (spanning up to 20 decades), animation may also be an important tool for viewing how a solution changes over time. Insight into temporal change may provide some important common ground for a group of decision makers who are considering a number of different solutions. To address some of these research themes, the following research is planned at UCSB: 1. Identify and formalize the geographic conceptions of problems inherent in the interests of participants in multiparticipant decision situations. This may use a variety of methodologies including experimental techniques, ethnographic techniques and other methods for analyzing text or discourse. Initially, research will focus on land use debates because they pose the biggest problem in terms of divergence in the conceptions of the problem. Content analysis techniques will be used on records of a land use debate to identify the geographic concepts that are important in this debate. Analysis of experimentally derived protocols may provide additional data. 2. Analyze common representations of spatial information that are used in SDSS to determine their efficacy in addressing the interests of participants in debates. This will require formalizing the types of information that are explicit or implicit in representations of spatial information. These formalizations will be compared to the concepts identified in the analysis of the land use debate (this will use a knowledge representation language such as Conceptual Graphs) and tested for their ability to represent the participants' interests. These analyses should lead to the identification of needed extensions to common representations. 3. Develop a prototype for generating spatial alternatives in a spatial decision support system. The major objective will be to develop and test a method for generating alternatives, a graphical user interface to present alternatives, and a method to spatially direct searches for feasible alternatives. Such a tool can be used in collaborative situations to provide comparison and examination of similar solutions. 6.2 Related research at State University of New York at Buffalo The following work is proposed by Marc Armstrong (University of Iowa) and Paul Densham (University College London, UK) who are working in collaboration with the NCGIA at SUNY Buffalo. 6.2.1 The cartography of collaboration Collaborative spatial decision-making environments in which group members individually and collectively pursue solutions to ill-structured problems have a unique set of cartographic visualization requirements. Group members normally have varying levels of education, disciplinary backgrounds, and familiarity with computing, as well as different stakes in, and degrees of familiarity with, ill-structured problems. Consequently, we can expect that group members will articulate different types of questions and will have considerably different perspectives on the way that these questions should be addressed. The purpose of our work 18
is to develop a cartographic framework that supports the design, construction and use of maps in CSDM. The central principle in this framework is that each map created by an individual as part of a solution to a problem can be decomposed into a collection of atomic objects - a path through a network can be decomposed into a series of nodes and links, for example. These objects are then placed into an accounting framework that supports summary operations on the objects and enables group members to determine the level of agreement among geographically- distributed components of alternative solutions. 6.2.2 The role of intelligent agents in CSDM The range of tasks and types of applications that need to be supported in CSDM environments is characterized by great diversity, since they are often constructed from a number of different software modules. This interoperability problem in CSDM is a difficult one to treat, however, because great differences exist among the user interfaces of software modules and each module typically has unique data flow requirements. Software agents represent one attempt to circumvent such interoperability problems. Agents also may actively assist users who may be unfamiliar with the operation of software. The purpose of this work is to articulate a vision of how agents can be used to support decision-makers and to develop a conceptual framework for the roles of agent- based computing in CSDM environments. 6.2.3 Visual interactive modeling The lack of structure inherent in many complex spatial problems makes it difficult for individuals to understand the relationships among different components of a problem. Consequently, individuals require tools that help them to explore and understand problems as well as resolve them. In many settings, human-computer interaction is enhanced if each user can articulate their ideas by interacting directly with graphical representations of their problem. When faced with a decision about where to locate a school, for example, users could drag the symbol for the school to different locations on a map and watch the system enumerate and display in real time the concomitant changes in enrollment, age structure, gender and ethnic ratios, and distances traveled; an alternative approach is to specify some criteria for selecting a location and invoke an optimizing spatial search procedure. In such a context, a visual interactive modeling environment provides analytical capabilities that are invoked using map windows and linked tabular views that help groups of decision-makers to understand and reconcile depictions of spatial pattern with statistical reports about locational configurations. The purpose of the work proposed under this heading is to take a fresh look at the design, representation and implementation of spatial models. More specifically, we intend to extend earlier work on the design and implementation of modelbase management systems (MBMSs) into the domain of CSDM to meet the challenge of providing flexible modeling tools for group use. We will build substantially upon research carried out under I- 6 (Spatial Decision Support Systems) and that described above on the cartography of collaboration and the role of intelligent agents.
19
20
APPENDIX A. LIST OF PARTICIPANTS Initiative Leaders
Steering Committee
Marc P. Armstrong Department of Geography The University of Iowa 316 Jessup Hall Iowa City IA 52242 phone: (319) 335-0153 fax: (319) 335-2725 email:
[email protected]
Joseph Ferreira Massachusetts Institute of Technology 77 Mass Avenue, Room 9-516 Cambridge MA 02138 phone: (617) 253-7410 fax: (617) 253-3625 email:
[email protected]
Paul J. Densham Department of Geography and Centre for Advanced Spatial Analysis University College London 26 Bedford Way London WC1H OAP U.K. phone: 44-171-387-7050 ext. 5502 fax: 44-171-380-7565 email:
[email protected] Karen K. Kemp NCGIA Department of Geography University of California, Santa Barbara Santa Barbara CA 93106-4060 phone: (805) 893-7094 fax: (805) 893-8617 email:
[email protected]
Britton Harris Department of City and Regional Planning University of Pennsylvania 127 Meyerson Hall Philadelphia PA 19104-6311 phone: (215) 848-4846 fax: (215) 898-5137 Timothy Nyerges Department of Geography University of Washington Box 353550 Seattle WA 98195 phone: (206) 543-5296 fax: (206) 543-3313 email:
[email protected]
Participants David A. Bennett Department of Geography Southern Illinois University, Carbondale Carbondale IL 62901-4514 phone: (618) 453-3022 email:
[email protected] Steve Carver Department of Geography Leeds University Leeds LS2 9JT U.K. phone: 44-113-233 3318 fax: 44-113-233-3308 email:
[email protected]
David Coleman Laboratory for Geographical Engineering Department of Geodesy and Geomatics Engineering University of New Brunswick Fredericton NB E3B 5A3 Canada phone: 506-453-5194 fax: 506-453-4943 email:
[email protected]
21
Joseph Delotto Geographic Information Systems Group Network Planning & Engineering Systems Lab NYNEX Science & Technology,Inc. 500 Westchester Ave. Room 2F-13 White Plains NY 10604 phone: (914) 644-2933 fax: (914) 644-2237 email:
[email protected] Brenda G. Faber CIESIN/TERRA 1201 Oakridge Drive, Suite 100 Fort Collins CO 80525 phone: (970) 282-5488 fax: (970) 282-5499 email:
[email protected] Steven P. Frysinger College of Integrated Science and Technology Integrated Science and Technology Program James Madison University Harrisonburg VA 22807 phone: (540) 568-2710 fax: (540) 568-2761 email:
[email protected] or
[email protected] Francois Golay Swiss Federal Institute of Technology Spatial Information Systems DGR GR-Ecublens Lausanne CH-1015 Switzerland phone: 41 (21) 693 57 81 fax: 41 (21) 693 57 90 email:
[email protected] Thomas F. Gordon GMD, KIT-KI, Schloss Birlinghoven Sankt Augustin 53754 Germany phone: (49 2241) 14-2665 email:
[email protected] Jon Gottsegen NCGIA Department of Geography University of California, Santa Barbara Santa Barbara CA 93106-4060 phone: (805) 893-8652 fax: (805) 893-8617 email:
[email protected]
22
Lewis Hopkins Department of Urban and Regional Planning University of Illinois, Urbana-Champaign 907 1/2 West Nevada Urbana IL 61801 phone: (217) 244-5404 fax: (217) 244-1717 email:
[email protected] Piotr Jankowski Department of Geography University of Idaho Moscow ID 83843 phone: (208) 885-6452 fax: (208) 885-2855 email:
[email protected] Douglas M. Johnston National Center for Supercomputing Applications University of Illinois, Urbana-Champaign 4115 Beckman Institute 405 N. Mathews Avenue Urbana IL 61801 phone: (217) 244-5995 fax: (217) 244-4568 email:
[email protected] Rachel Jones LUTCHI Research Centre Department of Computer Studies Loughborough University Loughborough LE11 3TU U.K. phone: 44-1509-222789 fax: 44-1509-610815 email:
[email protected] David Lemberg Department of Geography University of California, Santa Barbara Santa Barbara CA 93106-4060 phone: (805) 968-8734 fax: (805) 893-8617 email:
[email protected] Seymour J. Mandelbaum Department of City and Regional Planning University of Pennsylvania Philadelphia PA 19104-6311 phone: (215) 898-6492 fax: (215) 898-5731 email:
[email protected]
Alex T. Pang Computer and Information Sciences University of California, Santa Cruz Santa Cruz CA 95064 phone: (408) 459-2712 fax: (408) 459-4829 email:
[email protected] Dimitris Papadias NCGIA Department of Spatial information Science and Engineering Univesity of Maine, Orono Orono ME 04469-5711 phone: (207) 581-2127 email:
[email protected] Thomas W. Pederson Graduate School of Fine Arts University of Pennsylvania 316 Meyerson Hall 210 South 34th Philadelphia PA 19104-6311 phone: (215) 898-7458 fax: (215) 898-9215 email:
[email protected] James D. Proctor Department of Geography University of California, Santa Barbara Santa Barbara CA 93106-4060 phone: (805) 893-8741 fax: (805) 893-3146 email:
[email protected]
Susan Suchocki Claremont Graduate School 130 E. Ninth Street Claremont CA 91711-6190 phone: (909) 621-8209 email:
[email protected] Steve J. Tomlinson Department of Environmental & Geographical Sciences Manchester Metropolitan University John Dalton Extension Oxford Rd Manchester M1 5GD U.K. phone: 44-61-247-6209 fax: 44-61-247-6344 email:
[email protected] William Wallace CIESIN/TERRA 1201 Oakridge Drive, Suite 100 Fort Collins CO 80525 phone: (970) 282-5480 fax: (970) 282-5499 email:
[email protected] Jeff Wang Lockheed-Martin Service Group NESC/U.S. EPA Scientific Visualization Center P.O. Box 14365 86 Alexander Drive, MS24/ERC1 Research Triangle Park NC 27709 phone: (919) 541-7662 fax: (919) 541-0056 email:
[email protected]
Rene F. Reitsma CADSWES University of Colorado, Boulder Campus Box 421 Boulder CO 80309 phone: (303) 492-4828 fax: (303) 492-1347 email:
[email protected] Michael J. Shiffer Department of Urban Studies & Planning Massachussetts Institute of Technology 77 Massachusetts Ave. Room 9-514 Cambridge MA 02139 phone: (617) 253-0782 fax: (617) 253-3625 email:
[email protected]
23
24
APPENDIX B. SPECIALIST MEETING AGENDA Saturday, September 16th, 1995 4:30 7:30
-
Demonstrations and reception Adjourn for dinner
Sunday, September 17th, 1995 7:30
-
Breakfast
8:30
-
Opening plenary session Welcome and charge to the meeting Introductions and opening positions Discussion of agenda
12:00 1:30 4:00 5:00
-
Lunch on the hotel patio Small group discussion sessions Plenary to present group discussion Adjourn for dinner
Monday, September 18th, 1995 7:30
-
8:30
Breakfast
12:00 -
Short plenary Small group and plenary sessions as appropriate Lunch
1:30 5:00
-
Small group and plenary sessions as appropriate Adjourn for dinner
7:00
-
Dinner at Acapulco Restaurant, 1114 State Street
Tuesday, September 19th, 1995 7:30
-
Breakfast
8:30 12:00 -
Small group and plenary sessions as appropriate Lunch
1:30 4:00
Final plenary Close the meeting
-
25
26
APPENDIX C. INITIATIVE PROPOSAL TO NCGIA BOARD Collaborative Spatial Decision-Making Request for Approval in Detail PROJECT SUMMARY Many spatial problems are intrinsically complex and require an interdiciplinary approach to their solution. Consequently, individuals often collaborate on developing solutions to these problems, working as members of a committee or task force. It is in supporting this collaboration that existing spatial decision support systems are weakest: they are not designed explicitly to provide tools that enable groups to develop and evaluate alternative solutions to complex spatial problems. The purpose of this initiative, therefore, is to extend current conceptual frameworks for spatial decision support systems (SDSS) to help groups of decision-makers generate tractable solutions to ill-defined spatial problems. A specific point of emphasis will be placed on integrating SDSS with new computer supported cooperative work environments. Such environments enable groups of people to work together by providing a set of generic tools that handle many of the tasks that are required of group enterprises: exchange of textual, numerical and graphical information; and group evaluation, consensus building and voting. To be credible in supporting group problem-solving and decision-making, collaborative spatial decision-making (CSDM) systems must exhibit certain characteristics. Three focal areas for research are: first, how to encapsulate knowledge in SDSS to assist decision-makers in formulating alternative solutions to their problem; second, how to improve decision-makers' interaction with spatial analysis tools; and, finally, how to provide decision-makers with mechanisms for evaluating alternative solutions to a problem. Ties to the NCGIA's Research Agenda This proposed Research Initiative will contribute to the following areas identified in the NCGIA's Renewal Proposal to NSF: 1.2 1.5 2.2 2.4 3.1.1 3.1.3 3.3.2
Data Models for Geographic Information Knowledge Representation Exploratory Spatial Analysis Spatial Models Human-Computer Interaction Spatial Decision Support Systems Visualization Tools
Initiative Leaders Paul Densham (Geography, SUNY-Buffalo) Marc Armstrong (Geography, Iowa) Frank Davis (Geography, UC-Santa Barbara)
27
Proposed Core Planning Group Mike Batty * Britton Harris * Joe Ferreira * Peter Nijkamp Jay Nunamaker Tim Nyerges Jack Dangermond (* indicates that we have approached this person and that they have given their consent.) Disciplines to be Involved Geography, Computer Science, Operations Research, Management Science, Planning, Psychology Potential Center Participants Batty (Geography, SUNY-Buffalo) Buttenfield (Geography, SUNY-Buffalo), Calkins (Geography, SUNY-Buffalo), Mark (Geography, SUNY-Buffalo), Church (Geography, UC-Santa Barbara), Couclelis (Geography, UC-Santa Barbara), Golledge (Geography, UC-Santa Barbara), Lanter (Geography, UC-Santa Barbara) Onsrud (Survey Engineering, Maine) Pinto (Survey Engineering, Maine) Timetable Specialist Meeting: To be held immediately before GIS/LIS '94 (Phoenix, November, 1994). Closing Session: To be held at GIS/LIS '96. PROJECT DESCRIPTION 1. INTRODUCTION The broad adoption of GIS technology has been fueled, in part, by its ability to support interdisciplinary approaches to spatial problem-solving. The traditional layered view of spatial data supported by GIS provides a means through which thematic data coverages can be integrated in a common spatial framework to support analyses conducted from different disciplinary perspectives. With such a repository of layered information in place, a host of powerful analytical operations can be brought to bear on spatially referenced data (e.g., Tomlin, 1990). GIS technology has been especially successful when these operations are applied to problems that are well understood -- problems with clearly defined questions and measurable outcomes. Many spatial problems, however, are not so straightforward. Consequently, spatial decision support systems (SDSS) have been developed to address illstructured problems with spatial query, modelling and analysis, and display capabilities (Densham, 1991; Guariso and Werthner, 1989). 28
A mismatch exists, however, between the widespread single-user model of GIS and SDSS use and the group-based approach to decision-making that is often adopted when ill-structured public policy issues are addressed. SDSS-based spatial analysis and display methods must be expanded to encompass group decision-making processes, and new tools must be developed that will enable group members to generate, evaluate, and illustrate the strong and weak points of alternative scenarios and come to a consensus about how to proceed toward a decision. 2. OBJECTIVES The five major objectives of the proposed Research Initiative on Collaborative Spatial Decision-Making are to: 1. examine the body of theory on the design, implementation and use of computer supported cooperative work (CSCW) environments and evaluate its utility for GIS/GIA; 2. identify impediments to the development of highly interactive, group-based spatial modelling and decision-making environments; 3. develop methods for eliciting, capturing and manipulating knowledge bases that support individual and collective development of alternative solutions to spatial problems; 4. develop methods for supporting collaborative spatial decision-making (CSDM), including methods for managing spatial models; and 5. extend capabilities for supporting multicriteria decision-making in interactive, CSDM environments. 2.1 Computer supported cooperative work environments Researchers in computer supported cooperative work (CSCW) have been concerned with the development of ways in which group members can interact to achieve goals using computer hardware and software (groupware) in much the same way that group business communication now takes place. Such interaction can be structured along both locational and temporal dimensions. In the temporal dimension, groupware may be applied either synchronously or asynchronously. In asynchronous mode (Greif and Sarin, 1987), group members use the system at different times, and post messages informing other members about what they have done and the current status of the decision process. In a synchronous application, on the other hand, the group meets and uses the system simultaneously, again, normally in a decision room (see Nunamaker et al., 1991). At present, this type of synchronous groupware is most commonly used. Collective decision-making activities can be supported by enabling each member of a group to share a common view of a problem as they would when looking at a diagram on a chalkboard. Though this process is especially effective in decision room environments in which the participants are in close proximity (Desanctis and Gallupe, 1985), it can be extrapolated to environments in which the participants are dispersed if high bandwidth communication technology is available (see Newton, Zwart and Cavill, 1992). Stefik et al. (1987) describe a decision room environment in which each participant in a group views the current state of the problem they are attempting to solve; in such WYSIWIS (What You See Is What I See) environments, each group member has a display (or views a collective display) that can be altered by other group members to reflect different views of a problem, 29
and these modifications are then propagated to other displays. Several steps in the decision process have been observed when a WYSIWIS interface is supported (Stefik et al., 1987). The first is a free-form stage in which rough ideas are put before the group using a variety of computer tools (e.g. typing, drawing). In the second stage, ideas are sorted and evaluated as the plan begins to take shape. During this stage there is greater chance for conflict because specific aspects of alternatives are discussed, evaluated and possibly discarded. During the final stage, a plan is formalized and articulated through the system. These stages parallel closely those observed when an SDSS is used to solve a locational problem. 2.1.1 Group use of spatial decision support systems When decision-makers use an SDSS they become involved in the process of seeking a solution, and they often generate and evaluate several scenarios that result from the application of models that employ different criteria or constraints. In this iterative process, they typically pass through several stages: · The first stage (strategizing) involves the formulation of an initial solution process, in which decision-makers acquire background knowledge about the geographical characteristics of the study area and variables in an analysis. During this stage, decisionmakers addressing a locational problem may require maps that show, for example, the distribution of demand, the existing service system and the transportation network in a study area, as well as tables that report measures of efficiency within the existing service system. · During the second stage (exploration), decision-makers begin to explore the problem by generating alternative solutions. Group members may choose several to explore the solution space of a problem in many ways. They may, for example, choose to vary systematically one or more dimensions of the problem identified in the first stage (e.g. by increasing the number of facilities to be located) or they may choose to examine maximally dissimilar solutions along the same, or different, dimensions. · In the third and final stage (convergence), decision-makers narrow the focus of the analysis and evaluate competing alternative solutions. At this point, the group may fracture into factions, each advocating a particular solution or even a particular solution strategy, and discussions are often conducted about the relative merits of alternatives. Though we will focus on each of these stages and develop principles to guide the development of CSDM environments, we will place a specific emphasis on the second and third stages of group use of spatial decision support systems. 2.1.2 Scenario specification Using locational decision-making as an example, the crux of the group decision-making process is the generation and presentation of alternative scenarios to group members. Each scenario that arises from suggestions made by members of a group is created from a sequence of actions. Consider, for example, the following sequence of steps that are performed when constructing a prototypical scenario: 1. compute distances between locations, 2. compute shortest paths, 3. apply optimization software, and 30
4. create maps and tables. Each of these steps may be decomposed into a set of additional tasks, each of which may be the subject of group discussion (e.g. choice of a distance metric or objective function). The specification and creation of a scenario, therefore, normally requires that several computational steps be concatenated in a way that is satisfactory to one or more group members to produce a single desired result. Moreover, the decision-making style employed by SDSS users (successive refinement) means that these steps will need to be taken repeatedly as users generate and evaluate scenarios. Because of this, group SDSS software should enable users to produce and evaluate scenarios in both their intermediate and final forms. Existing systems, however, do not provide adequate support for groups to participate in these activities. 2.1.3 Scenario evaluation When numerous scenarios are generated by group members, a mechanism must be established to provide them with a way of discriminating between alternatives. An effective system would provide at least three ways for making comparisons: statistical, visual and using methods of multi-criteria decision-making (MCDM). In each case, the process of comparing and evaluating scenarios can be supported most effectively in environments that permit decision-makers to evaluate collectively the alternatives under consideration by the group. 2.1.4 Conflict resolution Because decision processes and methods vary among individuals, group decision support tools must not only enable group members to specify their preferences, but they must also enable them to highlight differences and similarities among alternative scenarios and resolve conflicts that will inevitably arise. Additional work also should determine the kinds of tools that are most effective in promoting discussion and in persuading opinion when problems are confronted by groups. In CSDM, a scenario can be supported or objected to by other members of the group using statistical evidence (e.g. the value of an objective function), maps that illustrate the advantages or limitations of a scenario, knowledge about the problem domain and study area, or even intuition. Since haggling and discussion about the merits of scenarios are important aspects of decision-making, especially when there is no clear single ÒoptimalÓ solution, the system must provide a way for decision-makers to interact with, and to redesign, alternatives. In addition to a standard set of mapping and report generation tools, a free-form sketching facility would enable users to annotate and highlight specific aspects of a map or table to bring out salient problems or advantages of specific locational configurations in a scenario. When users are so empowered, solutions are no longer viewed with suspicion. At present, however, there is insufficient knowledge about the kinds of drawing tools that are best applied to highlight the salient characteristics of scenarios and differences among them. Ultimately, when different positions are articulated by group members, an agreed upon process of resolving deadlocks must be implemented. This process itself may occur in stages and Nunamaker et al. (1991) describe several tools that can be used. Electronic questionnaires, for example, can be used to determine the degree and nature of disagreement among group members. A group matrix tool can be used to build consensus by enabling individuals to place their questionnaire responses in a group context. In a shared workspace, users are able to alter their responses in a matrix; these alterations are broadcast to other group members. Because these alterations are visible, group matrices are useful for promoting discussion about different positions. A person who holds a position contrary to others, but who may not have good support for it, also may decide to move with the consensus view when group matrix 31
information is made available to them. Finally, different types of voting strategies (e.g. majority, plurality) can be used in cases where complete consensus cannot be established. 2.2 Impediments Several impediments must be overcome before effective CSDM environments can be implemented. Research must be conducted into the design of user interfaces for the groupware tools described in the previous section. New technology and algorithms also must be developed and applied to support interaction and to meet the increased computational demands that will be created by group-based modeling, communication and display of spatial information. 2.2.1 User interfaces The design of user interfaces that will effectively support group decision-making and enable individuals to resolve conflicts promises to be a challenging task. Designers concerned with single-user systems are finding that appropriate metaphors for interfaces (e.g. desktop, rooms) are difficult to specify for geographical domains (e.g. Kuhn, 1991; Kuhn, 1992; Mark, 1992). In addition to metaphors, interface designers must concern themselves with the set of tasks that must be accomplished by users. Task analysis (Rasmussen, 1986) and knowledge elicitation procedures (Greenwell, 1988) can be used to determine these required activities so that appropriate options are made available in a logical and consistent sequence for system users. The ultimate goal of these research and development activities is to provide interfaces that enable users with no prior collaborative experience to work together to solve complex locational problems. For example, specific facility locations could be selected by pointing, and their positions could be dragged to show how an alternative configuration of supply would affect reassignment of demand. The magnitude and location of demand also could be altered, thus permitting decision-makers to evaluate the impact of development plans under different assumptions of growth or decline of demand for services. Other structures or metaphors will need to be developed for group SDSS applications. A WYSIWIS system holds considerable promise in locational decision-making contexts, because maps are an essential and often requested SDSS decision aid (Armstrong et al., 1991; 1992). Decision-makers, for example, often wish to create maps that show an existing service system and the relationship between supply locations and demand for service. Solutions provided by spatial models (e.g. location-allocation) also are more easily interpreted when viewed as maps (Harris, 1988; Armstrong et al., 1992). Furthermore, maps serve as an effective and data-dense mechanism for exchange of locational scenarios, and consequently, they can serve as the basic ÒtokenÓ of interchange among locational decision-makers as they evaluate and compare scenarios and serve as an effective mechanism for promoting discussion of alternative results. They enable the outcome of a decision process to be modified by unmodeled aspects of the decision. Additional research, however, must be conducted to determine the kinds of map displays that are most effective in communicating spatial information to groups, and whether different kinds of maps are most effective during different stages of group decision-making. 2.2.2 System response Decision-makers must be provided with the means to interact with problems in near-real-time so that they may visualize the effects of making adjustments to the parameters that define the solution space of a problem. Currently, locational models are so computationally intensive (Armstrong and Densham, 1992) that near-real-time interaction is precluded except for trivial 32
or small problems. Instead, the state-of-the-practice is to create scenarios in what amounts to batch mode because realistic problems require several minutes of execution time, even on the current generation of high-end workstations. Research must be performed to determine how computer architectures can be exploited to improve performance to a level that is required to support true interactive modeling and design of service systems in a group SDSS environment. Such capabilities can be supported by multi-processor systems, in which different processors are assigned specific tasks (e.g. modeling with alternative criteria) that ultimately lead to the creation of a completed scenario. Alternatively, a single locational problem can be decomposed into a set of independent constituent parts to improve solution times through parallel processing (e.g. Armstrong and Densham, 1992). The use of coordinated ensembles of processors (Carriero and Gelernter, 1990; Karp et al., 1993) appears to be especially promising for parallel processing of locational problems. Note, however, that such ensembles will require greatly improved network bandwidth to be effective. Myers (1993) describes one ensemble, as a ÒmetacomputerÓ that requires a one gigabit-per-second network to link heterogeneous computational resources. When response times improve to permit real-time interaction, users will be able to manipulate directly two (or perhaps more) parameters or constraints much like a driver simultaneously releases the clutch and presses the accelerator in an automobile with a manual transmission (Armstrong, Densham and Lolonis, 1991). For example, in many analyses the imposition of a maximum travel distance constraint will lead to infeasibility of solutions when there are too few facilities to serve demand. By being able to visualize and evaluate the interplay between these two parameters and how it affects solutions (in this example the size and location of unserved areas), decision-makers will gain new insight into the nature of trade-offs in multiobjective decisions. 2.3 Knowledge-based systems Although decision-makers are knowledgeable, they typically are not experts in methods of spatial analysis and decision analysis. Consequently, a CSDM environment must actively help decision-makers employ its often complex analytical and evaluative capabilities (Armstrong et al., 1990). One way to provide this assistance is to incorporate knowledge in a CSDM system. Environmental knowledge describes the problem domain. While some environmental knowledge can be captured and represented within a system - including spatial relationships and patterns of spatial interaction - other forms of environmental knowledge are brought into the decision-making process by individuals - an understanding of the local political milieu, for example. Procedural knowledge is domain-dependent knowledge which can be used to restrict the solution space that will be searched. Computer systems that successfully exploit procedural knowledge often are called ÒintelligentÓ and increasingly are used in diagnostic tasks ranging from medicine to automobile maintenance. In a spatial context, procedural knowledge can be used to select a general problem-solving strategy or a specific analytical approach. Structural knowledge is used to reduce the amount of computation required when an algorithm is applied to a particular problem. Structural knowledge consists of representations of the spatial relationships which are being analysed; exploiting this structure can reap large savings in computation. To build knowledge-based CSDM environments, we must answer four questions:
33
· How is environmental, procedural and structural knowledge elicited from decision-makers and experts in GIS/GIA? · How is this knowledge represented within a CSDM system? · How is this knowledge used to assist decision-makers? · What kinds of knowledge are required specifically for supporting group interaction as opposed to individual decision-makers? In a CSDM system, procedural and structural knowledge can be used to help decision-makers select from the analytical methods and spatial models incorporated in the system. This knowledge also can be used to organize the representation and storage of spatial modelling capabilities. 2.4 Collaborative spatial modeling Complex spatial problems often contain aspects that are poorly defined. This lack of structure makes it difficult for individuals to understand the relationships among different components of a problem. Individual decision-makers often adopt problem-solving strategies that are consistent with their experiences, problem-solving style, and organizational context. Furthermore, a decision-maker may find that their objectives for a solution conflict with each other and with the objectives of other decision-makers. Consequently, individuals may wish to investigate different aspects of the problem using their own problem-solving strategies. Consider, for example, a decision-maker who wants to know the effects of relocating a school. Systems that support analyses of this type can be very difficult to use because they are oriented more towards the expert locational analyst than the knowledgeable decision-maker. Human-computer interaction would be enhanced greatly if each user could articulate their ideas about alternative locations by interacting directly with graphical representations of their problem, such as dragging the symbol for the school to different locations on the map and watching the system enumerate and display the changes in real time. In visual interactive modelling environments of this kind, tabular views linked to map windows will help groups of decision-makers understand and reconcile depictions of spatial pattern with statistical reports about locational configurations. Supporting visual interactive modelling for groups requires a fresh approach to the design, representation and implementation of spatial models. One approach is to develop a model base management system (MBMS) that enables users to access spatial modelling capabilities and to combine them in flexible sequences (Densham, 1991). In a MBMS, models typically are reduced to some set of atomic components which can be stored, manipulated, and recombined to yield the original algorithms. If they can be made independent of each other, model atoms can be combined in new ways. The ability to combine atoms in a flexible manner greatly extends the capabilities of the model base. Moreover, defining procedural knowledge for atoms is much simpler than for whole algorithms. The design and implementation of MBMS for CSDM environments raises several questions: · Of the numerous approaches to the design and implementation of MBMSs developed in Operations Research and Management Science, which approach should be used in a CSDM system? · How do we provide users with access to the contents of the model base via a graphical interface (Densham, 1993)? · How do we provide real-time interaction with model solvers? 34
2.5 Evaluating alternative solutions CSDM systems provide capabilities that enable individual decision-makers to place different degrees of emphasis on the various components of a problem and to generate a large number of alternative scenarios. For example, changing the weighting strategies applied to the individual layers in a GIS yields numerous different results in an overlay operation. Decision-makers require methods for evaluating their own scenarios and for comparing them with those generated by other decision-makers. A large and mature literature exists on the application of methods of decision analysis and multi-criteria decision-making. Although this literature addresses the use of methods in both individual and group decision-making contexts, it has largely been ignored by the developers of GIS and SDSS software - a few notable exceptions include Carver (1991) and Eastman et al. (1993). The incorporation of these methods in CSDM systems raises a series of fundamental questions: · Which methods of MCDM have been used in different spatial decision-making contexts and which are appropriate for individual and/or group use? · Which types of human-computer interfaces are most appropriate for supporting individual and group evaluation of scenarios? 3. PLANS FOR THE INITIATIVE 3.1 Progress with the Initiative to date The initiative is at an early stage of planning: approval in principle was granted at the June, 1993, Board Meeting. 3.2 Suggestions for substantive research activities following the Specialist Meeting We have identified four areas of research for which substantive results are required to support the development of CSDM environments. We anticipate that these four areas also will be identified at the Specialist Meeting. These four areas are: the development of a metaplanning capability; strategies for the design and implementation of a MBMS; the design and implementation of components for a group-based user interface; and the identification, selection and incorporation of methods for resolving spatial conflicts. 3.2.1 The metaplanner In a CSDM environment, methods for representing procedural and structural knowledge are required to make the system accessible to a diverse group of users. While some of this knowledge will be generic, other types of knowledge will be domain-specific requiring the selection of several application areas for study. We intend to continue our work in locational and environmental modelling (Armstrong et al., 1991; DePinto et al., 1994; Honey et al., 1991; Malanson et al., 1993) but other areas may be identified at the Specialist Meeting. A key aspect of the metaplanner will be its scenario management capabilities. There are two components to this capability. First, maintaining information about the lineage of a scenario's development (Lanter, 1991) (which we refer to as intra-scenario management) and, second, tracking group responses and modifications to a scenario when it is made available to the group (inter-scenario management).
35
3.2.2 Modelbase management systems Several strategies have been developed for the construction of MBMS. In a CSDM environment, two levels of decomposition must be considered. First, decomposition of individual models and algorithms at the atomic level is required. This decomposition identifies those elements of models and algorithms that are held in common and can be shared. A second level of decomposition is required for heterogeneous processing environments because individual components of the modelbase must be matched to the most appropriate architecture in the available suite (Densham and Armstrong, 1993). While these two types of decomposition are not independent, decomposition to the atomic level must be completed before suitability of an appropriate architecture can be determined. 3.2.3 User interfaces Methodologies for the design of user interfaces include task analysis (Rasmussen, 1986). Task analysis is used to decompose a user's actions into a set of modular elements that can be design the commands and options made available in the user interface. Though some of these user actions will be generic, other actions will be specific to a particular situation. Several application areas will be studied to determine which user actions are performed repetitively across different application areas and, consequently, should be included in all CSDM environments. An allied question relates to cartographic displays: which types of display transcend particular applications and should be considered core displays for CSDM environments? 3.2.4 Spatial conflict resolution We have identified a nascent literature on the integration of methods of MCDM with GIS and SDSS. We will survey this literature and the literatures of the decision sciences to determine which methods of MCDM hold particular promise for use in CSDM environments. 3.3 Research infrastructure Research into CSDM environments and their constituent parts requires a laboratory in which to develop and evaluate prototypes. At NCGIA Buffalo, networks of Sun Workstations, IBM compatible PCs, and Macintoshes are available; IBM RS 6000 Workstations and IBM compatible PCs can be used for this purpose at The University of Iowa and at NCGIA Santa Barbara. We have worked with several programming tools that can be used to build CSDM environments at the most basic level: PCS-Linda is a parallel processing environment for networks of PCs, Sun and RS 6000 versions are available; Mosaic is a distributed multi-media development tool for systems running X Windows available from NCSA (Macintosh and Windows versions also are available); all three sites also have access to ARC/INFO which now has the capability to display the same image on multiple networked workstations. Technology is changing rapidly and the selection of an appropriate environment would be premature at this juncture. REFERENCES Armstrong, M.P., Densham, P.J. and Lolonis, P. (1991) Cartographic visualization and user interfaces in spatial decision support systems. Proceedings of GIS/LIS Ô91, Volume 1, Bethesda, MD: American Congress on Surveying and Mapping, pp. 321-330. Armstrong, M.P., De, S., Densham, P.J., Lolonis, P., Rushton, G. and Tewari, V. (1990) A knowledge based approach for supporting locational decision-making. Environment and Planning B: Planning and Design, 17: 341-364. 36
Armstrong, M.P., Rushton, G., Honey, R., Dalziel, B.T., Lolonis, P., De, S., and Densham, P.J. (1991) A decision support system for regionalizing service delivery systems. Computers, Environment and Urban Systems, 15 (1), 37-53. Armstrong, M.P. and Densham, P.J. (1992) Domain decomposition for parallel processing of spatial problems. Computers, Environment and Urban Systems, 16 (6), 497-513. Armstrong, M.P., Densham, P.J., Lolonis, P., and Rushton, G. (1992) Cartographic displays to support locational decision-making. Cartography and Geographic Information Systems, 19 (2), 154-164. Carriero, N. and Gelernter, D. (1990) How to Write Parallel Programs: A First Course. MIT Press, Cambridge, MA. Carver, S.J. (1991) Integrating multi-criteria evaluation with geographical information systems. International Journal of Geographical Information Systems, 5(3), 321-339. Conklin, J., and Begeman, M.L. (1988) gIBIS: A hypertext tool for exploratory policy discussion. ACM Transactions on Office Information Systems, 6 (4), 303-331. Densham, P.J. (1991) Spatial decision support systems. In D.J. Maguire, M.F. Goodchild and D.W. Rhind (eds) Geographical Information Systems: Principles and Applications, Longman, London, pp. 403-412. Densham, P.J., and Armstrong, M.P. (1993) A Heterogeneous Processing Approach to Spatial Decision Support Systems. Manuscript available from the authors. DePinto, J.V., H.W. Calkins, P.J. Densham, J. Atkinson, W. Guan and H. Lin (1994) Development of GEOWAMS: an approach to the integration of GIS and watershed analysis models. GIS and Civil Engineering, forthcoming. DeSanctis, G., and Gallupe, B. (1985) Group decision support systems: a new frontier. Data Base, 16 (2), 3-10. Eastman, J.R., Kyem, P.A.K., and Toledano, J. (1993) A procedure for multi-objective decision making in GIS under conditions of competing objectives. Proceedings, EGIS'93, 438-447. Greenwell, M. (1988) Knowledge Engineering for Expert Systems. Ellis Horwood, Chichester. Greif, I., and Sarin, S., (1987) Data sharing in group work. ACM Transactions on Office Information Systems, 5 (2), 187-211. Greif, I. (1988) Computer-Supported Cooperative Work: A Book of Readings. Morgan Kaufman Publishers, San Mateo, CA. Grudin, J. (1990) Groupware and cooperative work: Problems and prospects. In Laurel, B. (ed.) The Art of Human-Computer Interface Design. Addison-Wesley, Reading, MA, pp. 171-185. Guariso, G., and Werthner, H. (1989) Environmental Decision Support Systems. John Wiley, New York, NY. Harris, B. (1988) Prospects for computing in environmental and urban affairs. Computers, Environment and Urban Systems, 12 (1), 3-12. Honey, R., Rushton, G., Armstrong, M.P., Lolonis, P., Dalziel, B.T., De, S. and Densham, P.J. (1991) Stages in the adoption of a spatial decision support system for reorganizing service delivery regions. Environment and Planning C: Government and Policy, 9 (1), 51-63. Karp, A.H., Miura, K., and Simon, H. (1993) The 1992 Gordon Bell prize winners: Judges summary. IEEE Computer, 26 (1), 77-82. 37
Kaplan, S.M., Carroll, A.M. and MacGregor, K.J. (1991) Supporting collaboration processes with ConversationBuilder. ACM SIGOIS Bulletin, 12 (2&3), 69-79. Kuhn, W. (1991) Are displays maps or views? Proceedings of the Tenth International Symposium on Computer-Assisted Cartography. American Congress on Surveying and Mapping, Bethesda, MD, pp. 261-274. Kuhn, W. (1992) Paradigms of GIS use. Proceedings of the Fifth International Symposium on Spatial Data Handling. IGU Commission on GIS, Columbia, SC, pp. 91-103. Lai, K., Malone, T., and Yu, K. (1988) Object Lens: A ÒspreadsheetÓ for cooperative work. ACM Transactions on Office Information Systems, 6 (4), 332-353. Lanter D.P. (1991) Design of a lineage-based meta-data base for GIS. Cartography and Geographic Information Systems, 18 (4), 255-261. Laurel, B. , ed. (1990) The Art of Human-Computer Interface Design. Addison-Wesley, Reading, MA. Malanson, G.P., Armstrong, M.P. and Bennett, D.A. (1993) Fragmented forest response to climatic warming and disturbance. In press, Proceedings of the Second International Conference on Integrating Geographic Information Systems and Environmental Modeling, Breckenridge, CO, September. Mark, D.M. (1992) Spatial metaphors for human-computer interaction. Proceedings of the Fifth International Symposium on Spatial Data Handling. IGU Commission on GIS, Columbia, SC, pp. 104-112. Myers, W. (1993) Supercomputing 92 reaches down to the workstation. IEEE Computer, 26 (1), 113-117. Newton, P.W., Zwart, P.R. and Cavill, M.E. (1992) Networking Spatial Information Systems. Bellhaven Press, New York, NY. Nunamaker, J.F., Dennis, A.R., Valacich, J.S., Vogel, D.R., and George, J.F. (1991) Electronic meeting systems to support group work. Communications of the ACM, 34 (7), 40-61. Press, L. (1992) Dynabook revisited- portable computers past, present and future. Communications of the ACM, 35 (3), 25-32. Rasmussen, J. (1986) Information Processing and Human Machine Interaction: An Approach to Cognitive Engineering. North-Holland, New York, NY. Stefik, M., Foster, G., Bobrow, D.G., Kahn, K., Lanning, S., and Suchman, L. (1987) Beyond the chalkboard: Computer support for collaboration and problem solving in meetings. Communications of the ACM, 30 (1), 32-47. Tomlin, C.D. (1990) Geographic Information Systems and Cartographic Modeling. Prentice Hall, Englewood Cliffs, NJ.
38
APPENDIX D. OPEN CALL FOR PARTICIPATION NCGIA invites participation from active researchers in the First Specialist Meeting of a new research initiative on collaborative spatial decision-making (CSDM). The meeting will be held September 17-20 1995 in Santa Barbara CA, and will focus on identifying impediments to the development of highly interactive, group-based spatial modeling and decision-making environments. The meeting will help the NCGIA develop an agenda for research to be conducted under this 2-year research initiative. Recognizing that the primary determining factor in the design of collaborative decision support systems is the nature of the decision problems and of the means which are available to attack them, five cross-cutting research topics have been identified for discussion: 1. The development of a metaplanning capability: methods to elicit, capture and manipulate knowledge bases that support individual and collective development of alternative solutions to spatial problems. 2. The design and implementation of methods to improve decision-makers' interaction with spatial analysis tools, including modelbase management systems, visualization and display tools, and group-based user interfaces. 3. The provision of mechanisms that enable decision-makers to evaluate alternative solutions to a problem. 4. The identification, selection and incorporation of methods for resolving spatial conflicts in interactive, CSDM environments, including multicriteria decision-making. 5. The characterization of CSDM processes, including but not limited to the specification of task models in various domains such as environmental, transportation, natural resource, economic development, emergency management, and other high priority subject domains; and investigations which elucidate the use of CSDM technology in various CSDM subject domains. The Steering Committee invites submissions from researchers specializing in any of these topical areas who wish to participate in the meeting, for which funding is being provided by the National Science Foundation through NCGIA. Participation is particularly encouraged from: · researchers with interest in linkages between GIS and group-based decision-making; · researchers with international links; and · researchers who can provide specific examples of the strengths and weaknesses of GIS in CSDM research. Up to half of the 32 participants at the meeting will be selected through this open call. Preference will be given to researchers at U.S. institutions. Submissions must be received by June 1, 1995, and should consist of a three to five page position paper on the uses and impediments to greater use of GIS in one or more of these topical areas, based on personal experience in CSDM research. (It is anticipated that participants will revise and expand these papers after the meeting for inclusion in an edited volume.) Submissions must also include a short biography describing the author's professional 39
experience and interests relevant to research in this area. This biography should be no more than 1 page. Unless other arrangements are made with NCGIA, submissions should be made by email using plain ASCII text. Anyone planning to submit a position paper by the June 1 deadline should notify the NCGIA of their intent to do so as soon as possible. This will help the steering committee ensure that all interested communities are represented.
40
APPENDIX E. POSITION PAPERS The following papers were submitted by the participants in the meeting in response to the call for papers.
41
Collaborative Spatial Decision Making for Ecosystem Management David Bennett, Department of Geography, Southern Illinois University-Carbondale, Carbondale, Illinois 62901-4514
[email protected] Introduction Ecosystem management is a relatively new management paradigm designed to balance the needs of human and biotic systems (Salwasser, 1994). The U.S. Forest Service, for example, indicates that ecosystem management seeks to "balance goals for the land" including "diversity of plants, animals, and biological communities" with "goals for the people: the prosperity... health and vitality of the people who depend on the land for their livelihoods" (USFS, 1992). This paradigm has received considerable attention in the western United States where large tracts of land exist in public control. The application of this approach to multiple-owner landscapes in the mid-west, however, presents unique challenges because of the need to explicitly consider a large number of public and private decision makers who possess overlapping objectives. An automated environment that supports collaborative spatial decision making (CSDM) would appear to be particularly well suited to ecosystem management in such landscapes because there is often a need for consensus building and compromise and because of the analytical tools that can be brought to bear on the challenges of resource management. A careful consideration of this issue, however, illustrates the limitations of our conceptual and technological understanding of CSDM. The Case of the Cache River Watershed Consider, for example, the complicated set of resource planning activities that are occurring in the Cache River watershed in southern Illinois. This watershed is largely privately owned and contains an internationally significant cypress/tupelo wetland (a RAMSAR site). There is considerable concern that this unique wetland community is threatened by agricultural land use practices. In this watershed there are three general classes of decision makers who impact land use pattern and, thus, the wetland. These classes are: 1. Farmers who: 1) want to retain full control over their land (private property rights issue); 2) want to maximize farm revenue; and 3) have concern for erosion control. 2. Conservationist (public and private) who want to conserve the ecological vitality of the wetland community. 3. Regional economists who are looking for ways to diversify and bolster the weak regional economy of this area through: 1) agricultural; 2) industrial; and 3) recreational opportunities. To help address issues of natural resource management The Nature Conservancy (TNC) and the Natural Resource Conservation Service established the Resource Planning Committee (RPC). This committee, comprised wholly of individuals who reside within the watershed, is charged with the responsibility of prioritizing natural resource problems and identifying feasible solutions. A support committee has also been established to provide technical advise to these individuals. My role on this committee is to provide information on how GIS and SDSS technologies can be used to help understand and solve natural resource related problems in the Cache River watershed. In addition, I am participating in a TNC-funded research project that will investigate the impact of alternative resource policy and management scenarios on the economy, hydrology, and ecology of Cache River watershed. Collectively, these planning and 42
research activities directly address many of the issues relevant to ecosystem management in multiple- ownership landscapes and indirectly address many of the challenges associated with the development of CSDM for ecological problem solving. To be successful, an ecosystem management plan must represent a consensus of all decision making classes. Before we can design a CSDM system that can support this kind of consensus building we must understand how policy and management initiatives effect interrelated human, biological and physical processes through time and space. To gain this understanding we must identify and model key system processes and inter-system flows. Key processes, as defined here, determine how human and bio-physical systems behave and inter-system flows determine how these systems interact. To completely support the decision making classes identified above and help individuals evaluate how well alternative management scenarios meet their objectives it is necessary to construct models that predict how land management practices will change given alternative policy scenarios and then to trace the effect of these decisions through economic, sociologic, hydrologic, and biologic systems. TABLE 1. Characteristics of Human and Bio-physical Systems Process Characteristic
Human System
Bio-physical System
Temporal pattern
More Discrete
More Continuous
Spatial pattern
More Discrete
More Continuous
Spatial Model
More Object Based
More Field Based
Response time
1-10 years
100-1000 years
Response type
Active/Proactive
Passive/Reactive
Interaction
Weakly linked
Strongly linked
Behavioral pattern
More probabilistic
Probabilistic and deterministic
Model of behavior
More knowledge-base
More math-based
Flows between systems
More aspatial
More spatial
Flow "Currency"
$, cultural, policy restrictions
Matter/energy
These systems, however, operate over different spatio-temporal scales (see Table 1). For example, the decision making process of individual farmers is driven more by economics, public policies, and peer pressure than, the rate at which soil moves across a field, the rate at which species disperse, or even the spatial pattern of soil productivity. Decisions based on these socioeconomic factors influence landscape structure at a particular point in time and for a particular tract of land; i.e., they are spatially and temporally discrete. Furthermore, these
43
decisions are made relatively frequently (e.g., seasonally or annually) and, as such, changes in the socioeconomic system can quickly effect the form and function of an agricultural landscape. Bio-physical subsystems are, on the other hand, driven by continuous processes that govern the storage, transport, and use of energy and matter, and often are formed by events and processes that set the ecological stage for millennia. Because human and biophysical processes operate over multiple spatio-temporal scales the links between these systems are often indirect. Yet, an understanding of how these linkages operate through space and time is imperative to the success of ecosystem management. Limitations of Existing Technologies The inability of GIS technology to adequately represent dynamic spatial systems is well documented. GIS software packages lack adequate spatial modeling capabilities (Nyerges, 1993; Bennett and Armstrong, 1993), spatial analytical tools (Goodchild et al., 1992), and spatio-temporal data structures (Langran, 1993) to represent such systems. Spatial decision support systems (SDSS) overcome some of these issues by incorporating modeling and analytical tools needed to address domain specific problems (Densham, 1991). However, these systems do not possess the modelbase management capabilities needed to support the simulation of processes operating over different spatio-temporal scales. Furthermore, both GIS and SDSS suffer from what Armstrong (1993) refers to as the "GIS bottleneck" that limits the utility of these technologies in collaborative decision making environments. To understand how this bottleneck can be overcome we must better understand how groups arrive at decisions. Toward a Theory of Collaborative Spatial Decision Making Rao and Jarvenpaa (1991) discuss theories that help explain why group-based decision support systems may or may not be effective (theories of communication, minority influence, and human information processing). Armstrong (1994) presents three stages that decision makers must progress through to solve complex semi-structured problems (strategizing, exploration, and convergence). However, if we are to design a CSDM environment to assist groups reach consensus on complex spatial problems we need a theory, or perhaps a set of domain dependent theories, that informs us about how decision makers interact. Furthermore, to be useful this theory must map into the relatively restricted domain of computers. A potential starting point for the development of such a theory is Minski's (1986) "society of mind" model. Minski models the human mind as a set of competing and collaborating agents each of which is designed to complete a specific task or objective. Agencies are formed as individual agents collaborate to perform complex tasks. Agents within agencies are ordered hierarchically; some agents performing the role of coordinator and/or facilitator that call upon others to carry out simple deterministic functions. Memory in Minski's society of mind is represented as the sequence of agents that were activated to perform a particular task (referred to as a knowledge-line or, more simply, k-line). This notion of a society of mind seems well suited to our CSDM problem. It is easy to conceptualize decision makers as a society of complex interacting agents. Classes of decision makers (e.g. farmers, environmentalist) form agencies that works toward a common goal. Classes that possess similar goals could even form super-agencies through compromise and collaboration. These human agents will need access to models and data to determine how effective alternative management scenarios are in meeting their goals. A CSDM system, therefore, needs automated agents that: · store, manage, access, analyze, and display data, · store, manage, access, execute, analyze, and display models, 44
· evaluate, compare, and display differences between competing scenarios; and · coordinate, facilitate, and document the decision making process. By structuring the CSDM as a "society of decision making" we can develop conceptual models for specific CSDM systems by defining a network of interacting human and automated agents. Furthermore, these models would provide a relatively straight forward path to implementation through the design and construction of automated intelligent agents (Edmonds et al., 1994). Note that the rudiments of this approach exists in the CSDM literature. Armstrong (1994) discusses the need for agency in the design of CSDM user interfaces and user communication technologies and Armstrong's (1993) trace function is analogous to Minski's k-line. A Conceptual CSDM Model for Ecosystem Management in the Cache River Watershed Differences in the way human, biological and physical subsystems behave through time and space presents a significant challenge that must be addressed if CSDM is to be applied to ecological problems. For our Cache River watershed example we can envision three classes of human agents that represent farmers, conservationists, and regional economists. In addition, automated agents will be needed that: 1) link policy to changes in land use pattern; 2) calculate the economic impact of these changes on farm income and the regional economy; 3) simulate the flow of water and sediment through the watershed; and 4) simulate the long term response of the cypress/tupelo swamp to changing hydrologic conditions. Emerging technologies that may prove useful in the implementation of this hypothetical system include: agent-oriented programming (Shoman, 1993; Anderson and Evans, 1994), modelbase management (Bennett, 1994), scientific visualization, genetic algorithms (Dibble and Densham, 1993), and distributed/parallel processing (Armstrong and Densham, 1992). Consider, for example, a ring of workstations (distributed processing), one workstation for each decision making agency, and a central workstation the provides a forum for debate and compromise. Each agency submits potential solutions to this forum, or takes out contributions from other agencies that it believes can be modified to help further their goals. This "debate" machine could store and manage commonly held resources such as data and models. Agencies would work in parallel, somewhat in isolation but collaborating with other agencies through the central "debate" machine and through inter-agency communication utilities (implemented as automated intelligent agents that coordinate and facilitate the use of white board and message posting technologies). Each agency would have an agenda (i.e. a set of objectives) that can, in part, be evaluated as a set of metrics that they are trying to maximize or minimize (e.g. multiple objective functions). This agenda could be modified as new information is provided or alliances emerge between collaborating agencies. An agency's agenda would be considered met when all metrics fall within a predefined range. The consensus building process would begin when agencies select initial solutions. Each agency would then request automated agents to: 1) calculate all metrics relevant to all groups and then contribute this knowledge to a collective pool (cooperative system); or 2) calculate just those metrics important to itself (uncooperative system). Some of these metrics would be derived from the simulation of spatial processes. Differences in spatial and temporal scale that exist among these processes must be reconciled by "coordinating agents" that are part of a larger agency of modelbase managers. Note that the way in which this coordination occurs is an important topic for future research. Through an iterative process initial solutions evolve to more acceptable states. This process could proceed through a generate and test approach or, conceivably, feasible solutions could evolve through the application of genetic algorithms (see e.g. Dibble and Densham, 1993). Scientific visualization could enhance the users ability to perform quick qualitative assessments of the impacts that management scenarios have on the
45
ecosystem and it could improve inter-agency communication At an even higher level of agent complexity we could envision broker-agents that analyze potential solutions and recommend options, data, and models to agencies that may be able to make use of them. This would require machine learning to develop associations between specific modifications and concomitant outcomes (i.e. a broker-agent learns inductively about what works for what situations and acts in an unbiased manner to provide that knowledge to individual groups). Conclusions The CSDM model is well suited to ecological problem solving because of the need for compromise and consensus building. The implementation of a system capable of supporting CSDM could be as straightforward as electronic conferencing that provides a WYSIWIS (What You See Is What I See) environment for sharing maps, tables and graphs or, in theory, as complex as the virtual world described above. While WYSIWIS technology exist and can be implemented today, to develop more sophisticated CSDM we must extend our knowledge of group decision making processes, applicable enabling technologies, and in some cases, the systems that we are trying to manage. References Anderson, J., Evans, M. 1994. Intelligent agent modelling for natural resource management. Mathematical Computer Modelling, 20(8):109-119. Armstrong, M.P. 1993. Perspectives on the development of group decision support systems for locational problem solving. Geographical Systems, 1:69-81. Armstrong, M.P. 1994. Requirements for the development of GIS-based group decision support systems. Journal of the American Society for Information Science, 45(9):669-677 Bennett, D.A, Armstrong, M.P. 1993. A modelbase management system for geographical analysis. In Proceedings of GIS/LIS '93 ,Volume 1. Bethesda, MD: American Congress on Surveying and Mapping, pp. 48-57. Bennett, D.A., 1994. An Extensible Geographical Modeling System for the Development of Dynamic Watershed Models. Dissertation, The University of Iowa, Iowa City, Iowa. Densham, P.J. 1991. Spatial decision support systems. In Geographical Information Systems: Principles and Applications edited by . D. Maguire, M.F. Goodchild, and D. Rhind. Wiley, New York, NY. Dibble, K., Densham P.A., 1993. Generating interesting alternatives in GIS and SDSS using genetic algorithms. In Proceedings of GIS/LIS '93 ,Volume 1. Bethesda, MD: American Congress on Surveying and Mapping, pp. 180-189. Edmonds, E.A., Candy, L., Jones, R., Soufi, B. 1994. Support for collaborative design: Agents and emergence. Communications of the ACM, 37(7):41-47. Goodchild, M., Haining R., Wise, S. 1992. Integrating GIS and spatial data analysis: problems and possibilities. International Journal of Geogaphical Information Systems, 6(5):407-423. Langran, G. 1993. Time in Geographic Information Systems. Taylor and Francis, London. Minski, 1986. The Society of Mind. Simon and Schuster, New York, NY. 46
Nyerges, T., 1993, Understanding the scope of GIS: Its relationship to environmental modeling. In Environmental Modeling with GIS edited by M.F. Goodchild, B.O. Parks, and Steyaert, Oxford University Press, New York, pp. 75-93. Rao, V.S., Jarvenpaa, S.L. 1991. Computer support of groups: Theory-based models for SDSS research. Management Science, 37(10):1347-1362. Salwasser, H. 1994. Ecosystem management: Can it sustain diversity and productivity? Journal of Forestry, 92:6-11. Shaham, Y., 1993. Agent-oriented programming. Artificial Intelligence, 60:51-92. USFS, 1992. Chief's Directive fo Regional Foresters and Station Directors. U.S. Department of Agriculture, Washington, D.C. Biography David Allan Bennett, Ph.D. in Geography, University of Iowa, 1994. Assistant Professor, Department of Geography, Southern Illinois University-Carbondale, 1993-present. Research Interests: For the past five years my research activities have focused on the representation of dynamic spatial systems within GIS technology. The core of this research has dealt with the integration of modelbase management systems with traditional methods of representing spatial features. The product of these efforts is a framework for the representation of complex spatial systems that helps users conceptualize and implement dynamic simulation models within the context of GIS. More recently my attention has turned to the development of spatio-temporal data structures designed support the capture, display, and query of simulation results and to the development of decision support systems for ecosystem management. Pertinent Research Projects: The Nature Conservancy. 1994. Principle investigator for "Ecosystem Function and Restoration in the Cache River Bioreserve", with K. Flanagen, S. Kraft, B. Middleton, D. Sharpe, J. Beaulieu, R. Beck, and C. Lant. The objective of this study is to investigate the impact of alternative resource policy and management scenarios in the Cache River watershed. This project is being studied from an ecosystem management perspective and, thus, considers the impact that these scenarios have on both human and bio-physical systems. GIS and SDSS technologies are being used to address these issues. Experience and knowledge gained from this project will be used to drive CSDM research. Selected Publications (other than those cited in the position paper) Bennett, D.A. In review, A framework for the integration of geographic information systems and modelbase management. Submitted to the International Journal of Geographic Information Systems. Bennett, D.A. and Armstrong, M.P., In review. An inductive knowledge-based approach to terrain feature extraction. Submitted to Cartography and Geographic Information System.
47
Bennett, D.A, Armstrong, M.P., and Weirich, F., In press. An object-oriented modelbase management system for environmental simulation. In GIS and Environmental Modeling: Progress and Research Issues edited by M.F. Goodchild, B.O. Parks, and L.T. Steyaert. Bennett, D.A and Armstrong, M.P. 1994. An object-oriented geographical modeling environment. In Proceedings of the Object-oriented Simulation Conference. Malanson, G.P., Armstrong, M.P., Bennett, D.A. In press. Fragmented forest response to climate warming and disturbance. In GIS and Environmental Modeling: Progress and Research Issues edited by M.F. Goodchild, B.O. Parks, and Steyaert.
Applying Collaborative Production Approaches to GIS Data Collection and Electronic Chart Production David J. Coleman and Rupert Brooks Department of Geodesy and Geomatics Engineering University of New Brunswick Fredericton, N.B., CANADA 1. Introduction Digital mapping and charting processes have traditionally been sequential in nature and were originally designed in an environment where work was completed in a single location. As contract production became more prevalent, this system was extended to permit shipping of the source materials between locations via courier. Until recently, wide-area telecommunication services were regarded as being too slow, complicated and expensive to be considered seriously in support of inter-office workflow and production processes. Recent developments in spatial data processing and broadband data communications may provide users hundreds of miles apart with access to the same equipment and data at -- in some cases -- comparable levels of performance. When considered in combination with emerging groupware products and new approaches to computer-supported cooperative work (CSCW), these developments may offer a new approach to the collaborative production of digital maps and nautical charts -- enabling some processes to be conducted concurrently rather than sequentially. This paper introduces the rationale and activities involved in research efforts now underway in applying collaborative production technologies and groupware tools to selected problems in digital data production, quality control and distribution. After describing some of the problems and concepts under examination, the authors conclude with a brief description of the research currently underway. 2. Communications Issues in Digital Mapping and Charting Digital mapping and charting production cycles contain many potential bottlenecks which may delay the final delivery of data to customers. From field data collection and original production through inspection, correction, initial distribution and recurrent updating, the
48
process is largely sequential in nature [Coleman and McLaughlin, 1988]. While intended to produce a reliable product as quickly as possible, the data handling processes involved were originally designed in an environment where work was completed in a single location and complete sets of source materials were shipped in bulk from one unit to another -- usually in the same building. As contract production has become more prevalent in government digital mapping and charting programs in Canada, this "process" has been extended to permit shipping of the source materials between locations -- either across town or even across the country. Until recently, the materials were typically shipped by courier, since the bulk transfer of digital spatial data files via telecommunication networks has been regarded as being either too slow, too expensive, too complicated or too untrustworthy for routine use ([Craig et al., 1991,] [Newton et al., 1992]). Situations are increasingly arising where the data is collected by a supplier in one location, checked by staff in a different city, returned to the supplier (or perhaps even the field crew) for correction or verification, returned to the central office and then distributed to suppliers in various centres (from [Coleman, 1994b]. Depending on the situation, source materials associated with each chart may travel tens, hundreds or even thousands of kilometres during the various production, distribution and updating processes. This is happening at a time when digital map and chart providers are under increasing pressure to bring their original and updated products to market in shorter time frames than ever before. Recent developments in computer hardware technology and broadband data communications promise to change this situation, with new higher-speed communication services providing users hundreds of miles apart with access to the same equipment and data at -- in some cases - comparable levels of performance [Coleman, 1994a]. These new services offer promise to individual users who may wish to use wide-area networks to display, manipulate and transfer large data files stored on remote systems. As well, these services may offer a new approach to the collaborative production of digital maps and charts -- enabling some processes to be conducted concurrently rather than sequentially. 3. Collaborative Production and Computer Supported Cooperative Work (CSCW) Hardware, software and procedures to support collaborative production -- or, more specifically, computer-supported cooperative work (CSCW) -- have been discussed for more than thirty years (e.g., [Englebart, 1963], [Chapanis, 1975]). Particularly since the advent of computer networks, CSCW research has accelerated and a number of researchers have attempted to place these developments in some kind of framework (e.g., [Licklider et al., 1978]; [Grief et al., 1985]). CSCW has now reached the level of notoriety where collections of proceedings are available on the subject (e.g., [Baecker, 1993]; [Coleman, 1993]). In the corporate world, shared access to corporate resources and innovative new approaches to collaborative production using "groupware" tools like Lotus Notes(TM) are now being investigated [Marshak, 1993]. Significantly, behavioral research into the social and organizational interactions between members of a workgroup (e.g., [McGrath, 1984]) is now being applied in a corporate network setting ([Grudin, 1990], [Sproull et al., 1991]). Whether we are dealing with operations in a single location (i.e., on a local area network) or multiple locations (i.e., across a WAN or LAN interconnect service), improving production throughput times will depend in large part on three things: 1. shortening the "production float" -- the transportation, storage, handling and "sitting" time(s) consumed when files are moved from one location (or one stage of production) to another; 49
2. streamlining existing methods or adopting alternative approaches to product development; 3. improving communication to ensure: (a) a common understanding of the product requirements between the producer and the inspector; and (b) that each product ultimately meets stringent product specifications. Collaborative production supported through broadband networks will help support (1) and (3) immediately and -- over the longer term -- may support changes to the production processes as well. While authorities may disagree on the strict inclusion of electronic mail as being a form of "groupware", it is clear that e-mail has already made a major contribution to facilitating production by improving communications within and between "wired" workgroups in many organizations. However, collaborative production supported through broadband networks depends on more than just electronic mail. Specifically: · Such a concept implies the use of a shared "database" or collection of files, and should permit the definition of group members' roles, task status reporting & tracking, and gateways to electronic mail and other sources of data. · Such systems should permit the organization of correspondence, comments, reports, etc. associated with a project or product and should support the management of multiple versions of objects (e.g., images, vector-based charts, video and sound). · Finally, preliminary research has already indicated that such systems should give two or more remote users the capability to simultaneously view the same file, modify or add comments to specific entities where necessary, and communicate via voice, video and/or e-mail while making these changes [Coleman, 1994b]. The development and implementation of such capabilities will be predicated on an integrated collection of tools and functions which might include the following: · Mail, audio and perhaps even desktop video communication between Inspector, Production Supervisor(s) and technician(s); · High-speed file transfer between production, inspection and distribution facilities; · Network management tools which permit the access and viewing of files stored on remote servers/networks (mostly available already through tools like NFS and AFS); · Simultaneous viewing and manipulation of the same file by two or more different users in different locations; · Electronic "Markup" of entities requiring further attention either during individual or "shared" sessions (i.e., analogous to attaching "post-it" notes or comments to a hardcopy map sheet); · Software which enables two users to share control of the same workstation; i.e., controlling the workstation of a remote user and seeing what that user sees. Many of these capabilities already exist in some form from a variety of hardware and software vendors. However: (1) the level of integration is low -- individual capabilities are scattered among a wide variety of packages; (2) they have not been customized to meet the specific needs of users in digital mapping and charting environments; and (3) the performance and limitations of these tools in geomatics applications across wide-area networks is still to be determined.
50
4. Research Program Objectives and Components Research now underway by the Geographical Engineering Group at the University of New Brunswick is re-examining the requirements of selected digital map and nautical chart production, quality control and updating processes as mapping organizations and their suppliers take fuller advantage of forthcoming broadband communications technology. The overall research program includes the following stages: 1. Preliminary research (now underway) which: (a) examines the characteristics, strengths and weaknesses of existing sequential production models; (b) develops a prototype collaborative production model (or models) for digital map and chart production in selfcontained and distributed operational environments; and (c) identifies hardware-, software- and operational constraints to collaborative production; 2. Specification and development of prototype software which enables collaborative production, inspection and correction of digitized chart files in a wide-area network environment; 3. Performance testing of these software packages across a broadband, wide-area network service (in comparison with stand-alone and LAN-based systems) to begin identifying optimal approaches to collaborative production and delivery; 4. Identification and classification of collaborative production tasks which: (a) absolutely require broadband connection to be carried out; (b) may be acceptably completed across lower-speed services now enjoying widespread usage; and/or (c) those which may be temporarily redesigned to be handled on lower-speed links; and Stages 1 and 2 are now underway. Individual components of this research are currently being supported by the Natural Sciences and Engineering Research Council of Canada (NSERC), the Atlantic Canada Opportunities Agency (ACOA), The Champlain Institute, as well as a variety of private firms. 5. Collaboration with Industry and Government Programs Early research in two projects (still underway as of August 1995) has provided valuable input to date. These two projects are described briefly below. ChartNet The ChartNet Project is a multi-million dollar effort entailing the development and integration of a suite of software packages to permit the collaborative production, inspection, management and distribution of electronic nautical charts across broadband communication networks [Coleman, 1994c]. Led by Nautical Data International of St. John's, Newfoundland, the team involved in the development of ChartNet Stage 1 included Compusult Ltd., Universal Systems Ltd., ORACLE Canada, IDON Corporation, the Canadian Hydrographic Service (CHS), Environment Canada, the Canada Centre for Marine Communications and the University of New Brunswick. The first stage of the ChartNet project focused largely on developing and implementing a more data-driven approach to electronic chart compilation and management. However, as part of this stage, Universal Systems Ltd. did develop a special electronic whiteboard module for its CARIS GIS software. This module provides separate users on the same LAN or WAN the ability to view the same GIS graphics file simultaneously for purposes of joint markup and comment. Rather than simply viewing the same static image, the users can share (or, rather, trade) control of the display and tracking functions in order to permit zooming and panning to
51
specific portions of the vector digital map image. While only one user holds control over final edit or revision, both users may "mark" specific features or items of interest on the display for further review or comment. This software module is now installed and undergoing advanced testing at the offices of Nautical Data International in St. John's and at CHS Headquarters in Ottawa. Quality Control in NBGIC Topological Structuring Project The New Brunswick Geographic Information Corporation (NBGIC) is committed to bringing its entire province-wide 1:10,000 digital mapping coverage to a common level of topological structuring and consistency during the 1995/96 government fiscal year. Rather than performing the work in-house, the residual editing and substantial re-processing involved will be completed through a series of production contracts to GIS service firms. In addition, all processing, file inspection and verification activities comprising the Project's Quality Control are being contracted to a separate independent consulting firm. There are very stringent penalty clauses associated with late delivery of the files from both the contractors to the Inspector, and from the Inspector to NBGIC. With over 1800 separate files to be received, inspected, assessed and either approved or passed back to one of the contractors for re-work, the prospects of encountering delays due to disorganized handling, learning-curve difficulties, poor inter-organization communications or unnecessary duplication of effort are significant. The conventional workflow and handling procedures developed for this project are based in part on a previous province-wide effort involving inspection and correction of DTM coverage. While this project is now underway, members of the Research team have been examining procedures with a view to streamlining (or even totally redefining) selected processes which could be handled within single LAN, over a proprietary LAN-Interconnect service or across the Internet. Preliminary findings indicate that many of the workflow improvements may be achieved through the use of a shared server, improved file "check-in/checkout" procedures, and a common project bulletin board. Enhanced WWW and Lotus Notes server -based systems are both being investigated over the coming year and findings will be reported in a future paper. 6. Concluding Remarks While groupware products and CSCW approaches clearly represent a significant advancement in the larger industrial community, their effective application to problems in geomatics data collection and management requires further study and testing. Further research into collaborative production in GIS could have a significant impact on the streamlining or even outright redefinition of future production, quality control and updating activities in major mapping and charting organizations around the world. By examining the re-engineering of generic mapping processes to take advantage of new broadband communications services, such investigations tie together current developments and interest in geographic information systems, broadband communications and spatial data infrastructure. References Baecker, R.M. [1993]. Readings in Groupware and Computer-Supported Cooperative Work: Assisting Human-Human Collaboration. Morgan-Kaufman Publishers, San Francisco, CA. USA.
52
Chapanis, A. [1975]. "Interactive Human Communication". Scientific American, Vol 232, No. 3, pp. 36-42. W.H. Freeman and Company. Coleman, D.J. and J.D. McLaughlin [1988]. "The Shift to Digital Mapping: Points of Impact on Management." Journal of Surveying Engineering, Vol. 114, No. 2, pp. 59-70. May. American Society of Civil Engineering. Coleman, David D. [1993]. Groupware 93: Proceedings of the Second Conference. D.D. Coleman, ed. Morgan-Kaufman Publishers, San Francisco, CA. USA. Coleman, D.J. [1994a]. "Geographic Information Systems Performance in a Broadband Communications Environment". Unpublished Ph.D. Dissertation. Department of Surveying and Spatial Information Science, University of Tasmania, Hobart, Tasmania, Australia. February. Coleman, D.J. [1994b]. Internal Workshop Summary: "ChartNet Workshop on Collaborative Production" Summary prepared for the Canadian Hydrographic Service and Nautical Data International, Ottawa, Ontario, in support of a CANARIE-funded project on application of broadband networks to electronic chart production. July. Craig, W.J. and P. Tessar and N. Ali Khan [1991]. "Sharing Graphic Data Files in an Open System Environment." URISA Journal, vol. 3, no. 1, pp. 20-32. Spring. Englebart, D. [1963]. "A Conceptual Framework for the Augmentation of Man's Intellect." in Vistas in Information Handling, Vol. 1, P. Howerton, ed., pp. 1-29. Spartan Books, Washington, D.C. Grief, I. and S. Sarin [1987]. "Data Sharing in a Work Group." TOOIS, Vol. 5, No. 2, pp. 187211. April. Grudin, J. (1990). "Groupware and Cooperative Work: Problems and Prospects." In Readings in Groupware and Computer Supported Cooperative Work Assisting Human-Human Collaboration. Ed. Baecker, Ronald M. Morgan Kaufman Publishers Inc., San Mateo, California. P. 97 Licklider, J.C.R. and Vezza, A. [1978]. "Applications of Information Networks". Proceedings of the IEEE, Vol. 66, No. 11, pp. 1330-1346. Marshak, D. [1992] "The Notes Phenomenon: The Industry Reacts to Lotus Notes". Office Computing Report, Vol. 15, No. 12, pp. 3 - 24. Patricia Seybold Group, Boston, Massachusetts, U.S.A. December. McGrath, J. E. [1984]. "Methods for the Study of Groups." In Readings in Groupware and Computer Supported Cooperative Work Assisting Human-Human Collaboration. Ed. Baecker, Ronald M. Morgan Kaufman Publishers Inc., San Mateo, California. P. 200. Newton, P.W. and P.R. Zwart and M. Cavill [1992]. "Inhibitors and Facilitators in HighSpeed Networking of Spatial Information Systems." in Networking Spatial Information Systems, P.W. Newton, P.R. Zwart and M.E. Cavill, eds. Belhaven Press, London. Sproull. L. and S. Kiesler [1991]. Connections: New Ways of Working in the Networked Organization. MIT Press, Cambridge, MA., U.S.A.
53
Biographical Sketches David J. Coleman, Ph.D., P.Eng. Rupert Brooks Department of Geodesy and Geomatics Engineering University of New Brunswick P.O. Box 4400, Fredericton, N.B. CANADA E3B 5A3 David Coleman is Director of the Geographical Engineering Laboratory at UNB. He obtained his Ph.D. in Surveying and Spatial Information Science from the University of Tasmania (Australia) in 1994, where his research dealt with determination and prediction of GIS performance across broadband wide-area networks. Prior to returning for post-graduate studies in Tasmania and at UNB, he held senior executive-level positions in the mapping and GIS industry in both Canada and the United States over a 15-year period. He may be reached by E-mail at . Rupert Brooks is a senior undergraduate student in the process of completing his B.Sc. thesis in Surveying Engineering and, as of September, 1995, enjoying his first month of marriage. His Internet E-mail address is .
54
Collaborative Spatial Decision-making in Cellular Network Management Joseph DeLotto & Greg Theisen Nynex Science and Technology, Inc. Geographic Information Systems Group Network Planning & Engineering Systems Lab 500 Westchester Ave., White Plains NY 10604 Introduction Cellular communications is a highly fertile subject matter domain for the study of Collaborative Spatial Decision-making (CSDM) processes. The Cellular industry has both sophisticated spatial analysis requirements and, in general, large and complex organizational structures. These factors, combined with a highly developed computing and communications infrastructure, create an environment where CSDM can have a significant business impact. The goal of our work is to assess the potential benefit that techniques from collaborative work can contribute to our existing spatial analysis environment. This paper will outline a task model for CSDM in Cellular network management, and present a software environment of existing spatial databases and associated applications that can serve as a starting point for the creation of ’cellular groupware’ for spatial decision-making. While the emphasis is on the problem domain, strategies to create group based spatial decision tools are suggested as a result of our initial experience. Spatial Decision-making in Cellular Communications Where is the greatest demand for cellular service? How will radio signals behave in different geographies? Where should new technologies or services be deployed to maximize their cost-effectiveness? These are examples of the types of questions commonly encountered in the cellular industry. To answer these questions, telecommunications companies are making increasing use of GIS and spatial decision support systems (Ding et al, 1995). While these tools have contributed significantly to individual productivity, they have not been used to foster collaborative problem solving or increase organizational learning. Almost every facet of building and operating a cellular network depends on a spatial decision process. Planners need to know where, when, and how much subscribers will use their phones so that they can determine how capacity should be distributed across a service area. Marketing departments need to know both where service is offered, and who within that service area is likely to be a potential subscriber. Engineers must model potential network configurations to insure that the appropriate signal quality is provided to areas identified by planners. The illustration below is a generalized view of the functional organizations responsible for operating the network, and the primary flow of information among them. Obviously, the organization encompasses a broad range of spatial decision problems which no single GIS application can support. Individual departments, such as engineering, represent large-scale work environments in their own right. The engineering department at Nynex Mobile has over 200 engineers in a number of functional subgroups, located at multiple offices throughout the Northeast. All departments use some type of GIS-based tools in their analysis and reporting. Individual departments are highly independent, and tend to collect a variety of spatial data on an ad hoc basis. This data is used to produce maps showing the distribution of some feature or the result of an analytical model. Maps are used as a static representation of a feature, to be shown in meetings or included in a report, rather than as a dynamic model of the decision space. The challenge for system designers is to allow decision-makers to make more effective use of spatial data both within and between departments. Within departments, the problem is similar to other large-scale technical project management studies
(Gronbxk et al, 1992). This case presents a conventional notion of collaborative work where individuals contribute towards a larger group goal. To address the use of spatial data between departments is to apply the notion of collaborative work to the exchange of information and ideas among multiple functional groups within an organization. From a social perspective it may be viewed as another case of individuals, in this case department managers, using collaborative methods to solve problems. From the perspective of designing tools that allow participants to exchange ideas in a spatial context, it presents a problem of creating generalized spatial representations of functions conducted by that department. The rest of this paper addresses the current methods used to facilitate interdepartment spatial decision-making, An Example Using Existing Applications To explore the collaborative use of spatial data and analysis for the activities outlined above, we have created a software environment from existing GIS applications. Two key objectives of the environment were to encourage the concept of a map as dynamic workspace, and to promote a common spatial database which allows easy exchange of spatial information among users. The architecture of the environment is shown in figure 2. The core of the environment is the Signal Quality System (SQS), which provides the central database for spatial and network data. SQS is primarily an engineering tool, so it contains highly detailed data on network parameters and activity. SQS is based on a shared database which allows users to access data on the actual state of the network and create their own views of the network. These ’cellular views’ represent a snapshot of an actual or proposed network configuration, and are made up of both spatial and aspatial data. A cellular view has a multi-layer geographical representation composed of both raster and vector data which are linked to relational data about individual network components. They can be compared to other cellular views, or referenced by external applications for non-engineering purposes.
GIS applications in other departments, such as operations or regulatory, can access a common spatial database as well as cellular views created in SQS by various users. The object of collaboration is now the cellular view, and although the view cannot be edited by multiple users, other applications can derive new data or relate other attributes to it. The multi-layer view can replace a map as the media for exchange of information between departments. Advantages and Disadvantages of Using Existing Applications The environment described above is an attempt to introduce some concepts of groupware to a spatial analysis problem by building on existing GIS applications. This pragmatic approach satisfies the broad definition of groupware as "the computer-based systems that support groups of people engaged in a common task (or goal) and that provide an interface to a shared environment." (P. 40, Ellis et al., 199 1). Even though it is based on existing computing infrastructure rather than some formal model of communication, it provides an initial platform to experiment with further system design. We have tried to leverage the inherent ability of maps as a communication tool to provide a starting point for the development of CSDM support. However, simply providing a map interface does not promote collaborative work. Collaborative tools must promote greater interaction in actual work situations. We have attempted to do this by providing application specific user interfaces, a user-modifiable spatial modeling environment, and easy access to data and applications through a variety of communication protocols. One obvious weakness in this approach is the lack of support for simultaneous interaction between workers at different sites. Spatial data may be created and viewed by a single user from any location, but there is no capability for a user to modify or suggest changes to another user’s data set. A WYSIWIS map editing capability where all users interactively provide input would provide the ideal solution for this purpose. Existing applications also lack strong versioning procedures to track various stages in the decision process. Multiple cellular views can be created and compared in user workspaces, but no meta-data about these are maintained by the applications. Lastly, the retrieval and processing of spatial data is still slow, and will have to be vastly improved to be useful for interactive decision making capability. Future directions There is clearly room to improve the way that spatial data and analysis are utilized in the design and operation of cellular networks. The component GIS functionality already exists or is readily available, but the systems are not designed to support group use. Before further development can occur several issues need to be explored, including: • Exchangeable units of data must be identified for the cellular domain. We have used the concept of the cellular view successfully, but it is primarily an engineering concept. Is there a more generalized spatial representation that can represent the interests of other departments? • Group visualization tools need to be incorporated into applications, so that map representations can be viewed and edited simultaneously. • Spatial databases must be better integrated into the MIS infrastructure so that they are a common resource for all functional groups. Collaborative methods will become even more necessary as cellular operators establish national footprints over the next several years and support organizations are distributed geographically. GIS applications are a vital component in network management, and will have to provide some level of groupware functionality.
Bibliography Ding, Y., Boguchwal, L., DeLotto, J., Fischman, G., and Theisen, G., "GIS Supports the Design, Planning and Engineering of Wireless Communication Networks" Proceedings forthcoming, Geoinformatics’95. Hong Kong. May 25-28 Ellis, C.A., Gibbs, S.J., and Rein, G.L. "Groupware: Some Issues and Experiences", Communications of the ACM, Vol. 34, No. 1, January, 199 1. pp. 38-58 Gronbxk, K., Kyng, M., and Mogensen, P. "CSCW challenges in large-scale technical projects - a case study", Proceedings ACM 1992 Conference on Computer-Supported Cooperative Work (1992), ACM Press, pp. 338-345 BiograRhy Joseph DeLotto is a Member of Technical Staff in the Planning and Engineering Laboratory at Nynex Science and Technology. His research interests are in radio propagation modelling, spatial data models, and the geography of telecommunications. Greg Theisen is a Member of Technical Staff in the Planning and Engineering Laboratory at Nynex Science and Technology. He has worked on several wireless planning projects, including the Signal Quality System (SQS), a GIS based planning and engineering tool. Current research interests are cellular demand forecasting and wireless technologies.
Extending Electronic Meeting Systems for Collaborative Spatial Decision Making: Obstacles and Opportunities Brenda G. Faber Senior Research Analyst CIESIN 1201 Oakridge Drive, Suite 100 Fort Collins, CO 80525 (970) 282-5488 (970) 282-5499 (FAX)
[email protected] Introduction This paper discusses considerations for the development and application of collaborative Geographic Information Systems (GIS). A collaborative GIS is a geographic information system which has been extended from a traditional single-user tool to incorporate group interaction with geographic data sets. A collaborative GIS provides an interactive, real-time environment for resource managers, policy specialists, scientists, and citizen groups to debate land allocation issues. One approach to implementing a collaborative GIS system is to create a "GIS extension" to a commercially available electronic meeting software package. Such a system allows meeting participants to work individually or in groups to construct various geographic scenarios electronically. The scenarios are collected and combined via the electronic meeting system local area network. Implications can be modeled and discussed as scenarios are suggested. Decision rationale for final recommendations are recorded automatically using electronic meeting software functionality. This paper is a collection of recommendations and observations based on experience in prototyping collaborative GIS systems within an electronic meeting system environment. Collaborative Spatial Decision Making Using Single-User GIS A commercially available, single-user GIS can be a powerful tool for supporting group deliberation on land-resource issues. A skilled technical facilitator, using a large or projected workstation display, can assist a group in exploring various scenarios and trade-offs through real-time GIS analyses. However, there are obstacles inherent in this approach: · To be successful requires that the GIS technician accurately understand and interpret comments from the group; · Use of a single-workstation display limits meeting participants' ability to study or highlight areas of individual concern; · Use of a single-workstation display does not allow negotiators to discuss or build upon solutions developed by other group members; · Decision rationale, arrived at verbally, is difficult to retrieve for subsequent public inquiry and regulatory review; · The opinions of more outgoing or assertive participants may have disproportional influence on the analysis;
61
· Other barriers, such as a history of litigation, may also exist that prevent participants from speaking openly. The Power of Electronic Meeting Systems In the corporate world, a practice that is growing in popularity is the use of electronic meeting systems (EMS). An EMS is a type of Group Decision Support System (GDSS) or "groupware" which supports electronic exchange between meeting participants. Each participant uses an electronic input device (numeric keypad or personal computer) to submit votes or comments. The EMS system software has a client/server LAN architecture with a file server collecting all data generated by participants. The system summarizes participant input for immediate display back to the group. This framework makes it possible for participants to present their opinions or positions quickly, efficiently, and with parity. Typical activities supported by commercially available EMS's include: · Voting (Yes/No, Multiple Choice, 10-Point Scale, etc.) · Issue Prioritization · Criteria Evaluation · Group Writing · Electronic Brainstorming · Project Analysis · Surveys and Questionnaires EMS's have been shown to enhance both productivity and efficiency in business meetings. It is the author's position that this proven collaborative architecture offers an excellent foundation for incorporating selected GIS capabilities for collaborative spatial exchange. The extended system not only allows teams to share textual and numeric data, but provides the ability to annotate, share, and analyze spatial information as well. Considerations for Extending EMS Architecture for Spatial Exchange The following are considerations for adding a geographic framework to the EMS environment. Note that the recommendations given are based on experience in developing collaborative GIS systems for same-time/same-place (face-to-face) meetings within a resource negotiation context. Design Considerations Most EMS packages are designed for business meetings. Thus, the majority of EMS interfaces have been purposefully designed to be simple and intuitive (assuming the lowest common technical denominator for executive participants). It is important to carry this premise forward when adding a spatial component to the EMS. The collaborative GIS developer should assume that participants will be GIS novices and may even be unfamiliar with a computer keyboard. A critical design objective when implementing a spatial addition to an EMS should be to create a seamless and consistent extension to the existing software. This will minimize confusion for novice users. Where possible, existing communications protocols and user interface appearance should be incorporated into the new function. EMS products which support initiation of other applications from within the EMS environment offer a convenient method for maintaining this consistency.
62
In addition, collaborative GIS extensions should reflect the most basic principles of electronic exchange: · simultaneous input, allowing everyone to state their position or opinion at once; · anonymous input (if desired), which can minimize the effects of dominant personalities and pre-established group hierarchies; · summarized display of all input for group review; and, · automatically generated meeting documentation, available for review at any time. Finally, a collaborative GIS system design should have a high degree of flexibility, such that it can be easily customized for a client's particular data set and application. Functional Considerations Experience in developing and customizing collaborative GIS systems for clients has resulted in the following recommendations for a core set of spatial functionality within a collaborative GIS framework: · Data Import Tool--allows for importing most GIS data formats onto the collaborative GIS platform; · Geographic Exploration Tool--allows negotiators to interactively explore supporting data via a simple menu interface. Data may include geographic data layers, economic statistics, policy statements, photographs, etc. Participants customize presentation of the geographic data to fit their own perspective (e.g., overlay selected landmarks, zoom into particular regions, highlight areas of interest). Thus, the negotiators are no longer dependent on GIS technicians for data review and access; · Geographic Proposal Tool--allows for graphical submission, compilation, and tracking of geographic proposals via annotated data layers. Each participant constructs geographic proposals by using a computer mouse to "trace" regions on various data layers. From a technical standpoint, each set of traced regions constitutes a data layer of digitized polygons which graphically captures the participant's perspective or position. It is important to emphasize that the outcome of this activity is a new GIS data layer generated by each participant. Data layers can be combined and analyzed for immediate display to the group. Negotiators no longer have to wait weeks for analysis results. The implications of various scenarios can be modeled and discussed during the meeting as they are generated. · Geographic Prioritization Tool--makes use of electronic voting/prioritization utilities to establish land management priorities as weighting factors for subsequent geographic analysis and modeling. Participants first use an EMS voting application. For instance, they might rank the importance of land characteristics or score objectives based on a multicriteria land-use objective. The resulting combined scores from this exercise are then applied as weighting factors for any number of GIS analysis techniques. · Database Link to Spatial Changes--provides the capability to track decision rationale for changes made to data layers during a negotiation session. If a database of initial issues is available, map changes can be linked to the appropriate database record(s) to document how each issue was addressed. A map change can be retrieved by clicking on an issue in the database, or conversely, the prompting issue can be retrieved by clicking on an area of the map. In addition, map changes negotiated by the group are tagged with a rationale statement with captures the essence of the discussions leading to the decision. This ensures that a record of decision rationale is maintained and is readily accessible for public inquiry and regulatory review.
63
· Geographic Negotiation Tool--a hybrid tool which evolved while prototyping collaborative GIS systems. Involves the use of a whiteboard to encourage participant interaction and collaboration. Data layers displayed on a facilitator's workstation are projected on a whiteboard using a video display device. Then, in a method similar to the Geographic Proposal Tool described above, participants work together to propose landuse scenarios by interactively tracing/erasing areas with marker pens. This encourages the group to collaborate verbally to generate a group proposal. Once the group agrees on a proposal, the meeting facilitator captures this work by tracing the pen marks overlaying the projected display with a mouse. A full array of analysis techniques can now be applied to combine and analyze this data for further discussion; · Geographic Modeling Tool--supports scenario gaming within a resource negotiation session. This might include simulation models or quantitative models. For example, construction of a reservoir may have profound effects on an encompassing watershed. An interactive modeling tool would allow reservoir designers and stakeholders to experiment with placement/capacity of the reservoir in terms of potential impacts to the surrounding watershed habitat. Note that models incorporated into the system must be simple and interactive. Complexity of the models must be balanced with overall meeting objectives and limitations. Results should allow negotiators to assess high-level physical, economic, and/or political implications without bogging the meeting down in complicated details or excessive processing times; · Data Export Tool--translates data back to the format of the client's database, including generated data layers, databases, and model results. Observations From Facilitating Collaborative GIS Sessions The following are observations assembled from a number of collaborative GIS workshops. Explanations for these effects and their implications to collaborative GIS development need to be explored in greater detail. · A common facilitation error is to over use the electronic exchange mechanisms. For example, often there is a tendency to assume that the collaborative GIS tools will produce the "answer". Though the tools may make the negotiation session more efficient or effective, no solution is ever achieved without good old-fashion verbal debate. Collaborative GIS tools are best used as an occasional supplement to verbal debate, to stimulate discussion and focus the group on critical issues. · Visual cues and landmarks are critical for orienting participants to the GIS data layers. Lack of adequate overlays showing familiar landmarks will inevitably disrupt the meeting and cause frustration among participants. · It appears that groups have a much lower tolerance for computer response time than is typically acceptable for individuals working with single-workstation applications. Even the smallest amount of dead meeting time, while processing a computation, causes participants to become fidgety and restless. Though in our applications no single computation took over 3 minutes, participants visibly began to lose interest as the pauses continued to occur with each change iteration. Our meeting facilitators tried to compensate for this effect by moving to a new issue while the previous change is processing, or by processing changes during breaks or overnight. However, this seems to defeat the intrinsic value of the collaborative GIS which supports reviewing and discussing a change as it is recommended. This observation may have significance for further development of collaborative GIS systems with resource gaming capabilities.
64
· Applying and displaying a change, as it is recommended, appears to be a very significant step in establishing group consensus. It is common for groups to modify or reverse a decision, once they are able to view an applied change. · The ability to individually interact directly with the data (select a coverage, zoom, overlay landmarks, etc.) seems to strengthen participant ownership of the negotiated results. Being able to touch the data themselves seems to give some participants a greater sense of control of the process. Along these lines, Colorado State University Psychology Department is currently conducting research to determine if the use of collaborative GIS systems increases the perception of "voice" (i.e. active individual contribution) in the resource negotiation process. Existing research in social justice indicates that increased perceptions of voice are correlated with increased perceptions of fairness, and with acceptance of both favorable and unfavorable process outcomes. Opportunity for Future Development - Distributed Collaborative GIS While the collaborative GIS systems described in this text are designed specifically for face-toface negotiations, a demand is growing for a similar mechanism to support remote landresource negotiations. For example, a land management plan may require public input from local land managers, coordination support from regional agency representatives, and policy input from governing bodies at the state or national level. Work needs to be done on characterizing distributed land-resource negotiation tools. These tools would encompass many of the capabilities of a collaborative GIS, but must be customized to operate in a distributed mode. Conclusions The proven collaborative architecture of commercially-available Electronic Meeting System software offers an excellent foundation for incorporating selected GIS capabilities for collaborative spatial exchange. The spatially extended system not only allows teams to share textual and numeric data, but provides the ability to annotate, share, and analyze spatial information as well. Experience and thoughtful implementation can result in a collaborative spatial decision support system providing an interactive, real-time environment for resource managers, policy specialists, scientists, and citizen groups to debate land allocation issues. Biography Brenda Faber is a Senior Spatial Systems Research Analyst with the Consortium for International Earth Science Information Network (CIESIN). Brenda is currently representing CIESIN as a visiting scientist at the Terrestrial Ecosystems Regional Research and Analysis (TERRA) Lab in Fort Collins Colorado. Brenda holds M.S. degrees in Image Processing and Electrical Engineering and a B.S. degree in Mathematics. Experience in collaborative spatial decision making: · applied research in use of groupware technologies for quantification of stakeholder values and preferences · applied research in conceptual modeling and data visualization · conceptualization and development of the TERRA Active Response GIS (AR/GIS), integrating electronic meeting system software with GIS capability · customization and application of the AR/GIS system to: · Clayoquot Sound, Vancouver, B.C. - land allocation simulation 65
· Arapaho-Roosevelt National Forest - Forest Plan Revision Process · City of Scottsdale - City Information System prototype · IBM technical manager of GIS research group - developing GIS temporal analysis for terrestrial change prediction Related Publications: Faber, Brenda G., W. Wallace, J. Cuthbertson, Advances in Collaborative GIS for LandResource Negotiation, The Proceedings of the GIS'95 Ninth Annual Symposium on Geographic Information Systems, Vancouver, B.C., March 1995, GIS World, Inc., Vol 1, p p 183-189. Faber, Brenda G., W. Wallace, and H. Sargent, Use of Groupware Enabled GIS for Land Resource Allocation Issues, Proceedings of the Sixth International Symposium on System Analysis and Management Decisions in Forestry, Pacific Grove, CA, September 1994. Faber, Brenda G., R. Watts, J. Hautaluoma, J. Knutson, W. Wallace, L. Wallace, A Groupware-Enabled GIS, The Proceedings of the GIS /94 Symposium, Vancouver, B.C., February 1994, pp 551-561.
Collaborative Environmental Decision-Making: An Integrative Approach Dr. Steven P. Frysinger AT&T Bell Laboratories As the complexity of our environmental management problems has increased, so has the need to apply the information management potential of computing technology to help environmental decision makers with the difficult choices facing them. Environmental information systems have already taken many forms, with most based upon a relational database foundation. Such systems have helped greatly with the day-to-day operations of environmental management, such as chemical and hazardous waste tracking and reporting, but they have two critical shortcomings which have prevented them from significantly improving the lot of environmental scientists and planners tackling more strategic decisions. Traditional environmental information systems (1) ignore the crucial spatial context of virtually all environmental management problems, and (2) offer little or no support for the dynamics of environmental systems. Fortunately, a relatively new category of system, called an Environmental Decision Support System (EDSS), shows real promise in both of these areas. Environmental Decision Support Systems are computer systems which help humans make environmental management decisions. They facilitate "Natural Intelligence" by making information available to the human in a form which maximizes the effectiveness of their cognitive decision processes. The most effective EDSSs are focused on specific problems and decision makers. This sharp contrast with the general purpose character of such software systems as Geographic
66
Information Systems (GIS) is essential if we are to put and keep EDSSs in the hands of real decision makers who have neither the time nor inclination to master the operational complexities of general purpose systems. Indeed, it can be argued that most environmental specialists are in need of computer support which provides everything that they need, but only what they need. The development of environmental policies and generation of environmental management decisions is currently, to a large extent, an "over the counter" operation. Technical specialists are consulted by policy and decision makers (who may or may not have a technical background), to assist in gathering information and exploring scenarios. Because of the inaccessibility of data and modeling tools, decision makers must consult with their technical support personnel with each new question, a time-consuming and inefficient process. Since environmental decisions typically involve at least two parties (e.g. the regulator and the regulated), this process is further degraded by traditional non-interactive technical negotiating methods. If the data and analytical tools could be placed within reach of the decision makers, they would be able to consult them more readily, and would therefore be more likely to base their decisions upon a technical foundation. Negotiating parties could collaborate on the refinement of modeling assumptions and approaches, encouraging the development of a mutuallyagreeable compromise among technical alternatives. This is the premier reason why Environmental Decision Support Systems, of a sort described in part herein, are necessary if we are to achieve a higher quality in our environmental management decisions and obtain more protection with our finite resources. The focused nature of EDSSs dictates a software architecture which facilitates the development of sibling systems embracing different decision problems with an essentially common user and data interface. Environmental Decision Support Systems address a problem domain of remarkable breadth. The character of environmental decisions, and the fundamental issues surrounding them, are central to the design of a successful EDSS. To understand environmental management decisions, we must first identify the decision makers. The stereotypical image of an environmental manager is a technically trained agent of a governmental regulatory body, and many decision makers indeed fit this description. However, these individuals also have their counterparts in the regulated arena (such as industrial environmental engineers). Furthermore, critical environmental decisions are made in the context of policy formation, and therefore involve both elected and appointed officials, as well as the members of the public whom they represent. Naturally, the level of expertise these individuals possess in any given technical area is highly variable. Nonetheless, all of them can and do make critical environmental decisions; it is therefore incumbent upon the toolbuilders including EDSS architects - to craft systems and processes which help to bridge the gap between technical expertise and the decision maker, so that the benefits of this expertise may be realized. Environmental decision makers are clearly a diverse group of people faced with a diverse group of problems. The breadth of their problem domain, in fact, defines the need for eclectic individuals with tools to match. The diversity of these characteristics of the problem domain make effective environmental decision support extremely challenging. Because of these factors, it is not practical to contemplate a generic decision framework for environmental management. Even if it were possible to capture all of the elements necessary to consider the great variety of decisions to be undertaken, the system so built would be virtually unusable. The environmental manager is already confronted with a vastly complex problem
67
space; one of the first jobs of the decision support system is to simplify this space, offering them everything that they need to make the decision at hand - but only those things. Therefore, while our definition of EDSS includes the integration of multiple supporting technologies (such as modeling and GIS), we further restrict this definition to stipulate that EDSSs are focused on a particular decision problem and decision maker. Thus, they are not general purpose tools with which anything can be done (if only you knew how to do it). Rather, they are particularly tailored to the problem facing the analyst, and offer a user interface which is optimized for this problem. The focused nature of such EDSSs improves the user's interface to the computer system, allowing the user to concentrate on the problem at hand and the information and tools needed to solve it. It also dictates a software architecture that facilitates the development of sibling systems embracing different decision problems with an essentially common user and data interface (Frysinger et al 1993a, Frysinger et al 1993b, Frysinger 1995). Such a family of focused EDSS siblings offers user interface simplicity, in that the siblings share interaction style, organization, and fundamental approaches (where appropriate), while maintaining the focus each sibling has on its particular decision problem. Environmental management is fundamentally about risk. Risk, in turn, may be regarded as the probability that an adverse outcome will occur in persons exposed to a hazard (Paustenbach 1989). The hazards in question may relate to the threat of loss or perturbation of portions of our natural environment - ecological risk - or to (more direct) threats to human health and quality of life. Risks may be described in terms of several other properties or characteristics besides the human/ecological dichotomy. Risks may be occupational or visited upon the population at large, and they may be voluntary or involuntary. They may be short-term or long-lasting, and may occur frequently or rarely. They may arise from natural causes or as a result of human actions, and their consequences may include injury, illness, or death, to name a few. Naturally, such categories only represent points on a continuum; some risks are more voluntary than others, for example. Many environmental management actions are taken without explicit consideration of risk. For example, efforts to preserve open space in the course of land use planning rarely involve explicit discussion of the health or ecological risks associated with development. But the very fact that these actions are elected implies some concern for the consequences of not acting. The individuals exerting themselves toward such ends may not have an understanding of the currency of risk assessment, and may be ill-prepared to discuss, much less quantify, the particular variables of the issue. Nonetheless, they are acting in response to an intuitive sense that there is some risk which ought to be mitigated. Environmental Decision Support Systems have considerable potential to help these decision makers to more rigorously account for the risks associated with the decision problem at hand by providing them with tools and information, as well as expertise integrated into the design of the system. The focused approach to EDSS design advocated here dictates the use of a human factors engineering technique, called task analysis, to support the specification of a particular EDSS for a particular problem. As defined in the human factors community, "...task analysis breaks down and evaluates a human function in terms of the abilities, skills, knowledge and attitudes required for performance of the function" (Bailey 1982). The EDSS designer must endeavor to understand the decision problem, and all of the factors which must be considered in solving it. In addition, the "social history" of the problem must be understood, since there will (in general) already be a number of different approaches to solving a given environmental management problem. For a
68
system to support an analyst in arriving at a credible decision, the various competing approaches must be considered, and possibly accommodated. A major stumbling block in task analysis is the fact that very few individuals can accurately explain the way in which they actually arrive at a particular decision. They can tell you how they think they should do it, and they can often develop a post hoc analytical rationale for their decision, but people are generally unaware of the actual process by which they make decisions. Thus, other instruments must be used to understand the decision process, ranging from observation and interview up through controlled experimentation to determine the influence of different variables on decisions. In the environmental area, this is further complicated by the fact that there are often guidelines or regulations dictating the way in which decisions are supposed to be made about a particular problem. These do indeed dictate certain aspects of the process, but often leave a great deal unspecified. For example, the United States' Resource Conservation and Recovery Act (RCRA) requires that a waste facility be monitored by a network including at least one upgradient and three downgradient wells in order to assure that no hazard to the public health results from the facility. However, though the legislature was specific about this detail, they made little effort to assist the manager in deciding where or how many (above four) wells are to be installed. Furthermore, the language of the act would suggest that certainty is required with respect to the detection of leaks, though no reasonable person would argue that this is either theoretically or economically achievable. Considerable interest has been shown in computer-based quantitative decision support for this problem (Frysinger et al 1992, Frysinger and Parsons 1992).
Biographical Sketch: Steven P. Frysinger Research Interests: Environmental decision support systems and information systems, Environmental modeling, Environmental systems engineering, Exposure risk assessment, Remote sensing for environmental analysis, Risk perception and communication, Scientific audification and visualization of spatial and time-series data. Education: · Ph.D. Environmental Sciences (Rutgers) · M.S. Applied Psychology/Human Factors (Stevens) · M.S. Computer Science (Stevens) · B.A. Environmental Studies/Physics (William Paterson) Research and Development Experience: · AT&T Bell Laboratories: Environmental Systems Engineering (1990-Present). · Remote Sensing Systems Research and Development (1987-90). · Systems Engineering and Project Management (1982-1987). · Exxon Research and Engineering Company (Corporate Research): Data Representation Research (1980-1982). · Battery and Solid State Physics Research (1979-1980).
69
· U.S. Environmental Protection Agency (Spills Branch): Analytical Methods Research (1978). Other Relevant Experience: · NCGIA User Interface Initiative (#13) · Chester Township, Morris County, New Jersey: · Chair, Environmental Commission. · Delegate, Black River Well Head Protection Project. · Member, Planning Board. · Black River Watershed Association (BRWA): · Member, Technical Advisory Board. Selected Publications and Presentations: Environmental Decision Support Systems and GRASS: A Sandia Monitor Well Case Study. S.P. Frysinger, R. Cox, P. Davis, and A. Parsons. In G.S. Waggoner (Ed.) Geographic Information Systems: Proceedings of the Seventh Annual GRASS User's Conference;, National Park Service NPS/NRGISD/NRTR-93/13, March 1992, pp. 117-121. A Decision Support System for Evaluating the Performance of a Monitor Well Network.S.P. Frysinger and A.M. Parsons. In Environmental Geotech Symposium (American Society of Civil Engineers) , September 1992. Treatment of Human-Computer Interface in a Decision Support System. A.S. Heger, F.A. Duran, S.P. Frysinger, and R.G. Cox. In IEEE International Conference on Systems, Man, and Cybernetics , October 1992. Hydrological Modeling and GIS: the Sandia Environmental Decision Support System. S.P. Frysinger, R.P. Thomas, and A.M. Parsons. In K. Kovar and H.P. Nachtnebel (editors), Applications of Geographic Information Systems in Hydrology and Water Resources Management - Proceedings of HydroGIS 93 , IAHS Press, April 1993. Auditory Data Representation: A Review with Applications to Spatial Information Processing. S.P. Frysinger. An invited presentation in J. Dorn (Chair), Summer Workshop of the Society of Exploration Geophysicists, August 1993. Environmental Decision Support Systems: An Open Architecture Integrating Modeling and GIS. S.P Frysinger, D.A. Copperman, and J.P. Levantino. In Proceedings of the Second International Conference on Integrating Geographic Information Systems and Environmental Modeling , NCGIA, September 1993. An Environmental Decision Support System for Local Wellhead Protection. S.P Frysinger and C.G. Uchrin. In Proceedings of Decision Support 2001 , September 1994. An Open Architecture for Environmental Decision Support. S.P. Frysinger. International Journal of Microcomputers in Civil Engineering , Vol. 10, No. 2, 1995.
70
System Design Methodologies To Support Collaborative Spatial DecisionMaking Francois Golay Swiss Federal Institute of Technology Spatial Information Systems GR-Ecublens CH-1015 Lausanne e-mail:
[email protected] 1. Context and Summary The new NCGIA initiative 17 addresses Collaborative Spatial Decision-Making (CSDM), and relies principally on "identifying impediments to the development of [...] decision-making environments." It is also recognized that "the primary determining factor of collaborative decision support systems is the nature of the decision problems [...]." These assertions lead us to argue that the spatial character of decision-making is not so special for CSDM as the type of activities to which CSDM applies. As was recently asserted in (Golay and Nyerges 1994) , we consider that land management, including water resources management, land use planning and management, waste management, transportation planning, and environmental impact studies, is a key domain for which decision-making is simultaneously collaborative and spatial. Land management is collaborative because it involves numerous people and organizations, and it is spatial because of the key role of the territory as an integrating factor. Therefore, although CSDM could also apply to other activities, we will narrow the scope of our reflection to land management activities. This position paper will firstly show the dangers that could arise from considering decisionmaking as a purely rational process achieved by a "free individual" (the mechanistic point of view), and from ignoring the reshaping role of the organization of which the decision-maker is part (section 2). As a consequence of this assertion, we have to inscribe a decision-making process within a mechanism to bring to actors within an organization a pertinent institutional knowledge. This shared knowledge is usually called "distributed cognition" (section 3). But what is the organizational context of land management? Do we have to consider the landplanning authority ? Or the transportation planning authority? At the city or at the state level? One understands that the organization of land management is defined as flexible, mostly informal links among groups of actors belonging to different organizations sharing land management responsabilities within a common territory (section 4). Unfortunately, most current system design methodologies do not fulfill the requirements of "distributed cognition support systems". The shortcomings of current methodologies and some new methodological trends pertinent to CSDM support system design are described in section 5. As a conclusion, some issues deserving further research are suggested (section 6).
71
2. From a mechanistic to an organizational view of decision-making Wilson & Wilson (1994) suggest an insightful critical review of the classical decision-making paradigm of Simon (1960), in the light of the more recent organization theory (Mintzberg 1985 for example). It is argued that Simon's classical model of "an heuristic search through a problem or possibility space undertaken by a socially isolated individual" reinforces the mechanistic image of some decision-maker(s) being in control of the organization. It neglects, however, the fact that the organization can act without any manager's decision! From this point of view, the organization has a reshaping, redefining role on managerial decisions, so organizational actions cannot be seen as their pure outcome. Conversely, the filtration of the contextual information through the representation of facts in the problem space could prevent managers from responding adequately and creatively to the actual situation. In other words, the reductionism of the approach implies the loss of criticism on the part of decision-makers. To improve this situation, Wilson & Wilson (1994) suggest a "reflexive learning" approach to decision-making, where the purposefulness of suggested decisions should always be questioned and verified through a critical review within the organization. (Etzioni 1989) suggests, under the name of "humble decision-making", the conscious use of classic decisionmaking heuristics to prevent reductionism. The suggested "organizational view" of decision-making does not imply, however, that an organization would itself be able to make decisions. "Organizations do not think or learn, people do" (Simon 1991) . But the ultimate goal is to create a decision-making environment in which organizational members can regard and understand the organization in new ways (Wilson and Wilson 1994) . 3. Distributed cognition to support decision-making Some authors define this "added value" by the organization to individual cognition as "distributed cognition". "Organizational cognition is a distributed cognition" (Boland, Tenkrasi et al. 1994) . (Norman 1994) asserts that distributed cognition provides "situation awareness" among members of an organization. Distributed cognition is more precisely defined by Boland as "the process whereby individuals who act autonomously within a decision domain make interpretations of their situation and exchange them with others with whom they have interdependencies so that each may act with an understanding of their own situation and that of others." Distributed cognition is based on "rich representations" made by individuals through a synergetic combination of action, dialogue and self-reflexion. This process is called by Boland "hermeneutic inquiry". It allows an individual to acquire a better global understanding of the world through an interplay known as the hermeneutic circle. It relies on social interaction, which is a very effective way of learning (Golay and Nyerges 1994) . In a system to support distributed cognition, the focus should not be on the individual as a decision-maker, but on the individual as a conversation maker (Boland, Tenkrasi et al. 1994) . It should support the ongoing sense-making dialog among organization members. We could suggest that, at the cognition level, a "Distributed Cognition Support System" is to a Decision Support System what, at the information level, an Information System is to Information Processing:
72
Information-oriented
Cognition-oriented
Individual
Information Processing
Decision SS
Organizational
Information System
Distributed Cognition SS
An information system allows the members of an organization to share information that can be processed and aggregated by an individual, whereas a Distributed Cognition Support System allows the members of an organization to share cognition that could be enhanced and appropriated by a Decision Support System. We have to point out that, in this paradigm, "Small-group decision-making" has, in its classic sense, to be classified as a Decision Support System, and not as a Distributed Cognition Support System. Its aim is actually to support discrete group decisions, and not the continuous sense-making process (Boland, Tenkrasi et al. 1994) . But where should we classify CSDM support systems? 4. Organizational context of land management activities The two above sections (2 and 3) have referred to an abstract "organization". This is not problematic at all for most fields of activity: a financial company, a transportation firm, a tax administration, etc. But what is the organizational context of land management ? Land management activities are shared by numerous different organizations acting within one unique territory. This territory is source of many causal relations among (spatial) entities (Prlaz-Droux 1995) . As an example, rain falling on a street flows to the next sewer pipe, so that transportation planning has to be coordinated with utility planning ("Coordination is managing dependencies between activities" (Malone and Crowston 1994). One can thus easily understand that the organization of land management is not a fixed one, but is defined (and constantly redefined) as flexible, mostly informal links among groups of actors belonging to different organizations sharing the responsibility of land management within a common territory. These groups of actors, however, can be seen as some type of cross-institutional organizations, to which the organization theory should fully apply (Pornon 1995) . They can particularly be considered as "a Community of inquirers, or a recognized group [...], for whom the evolving image of contingent truths is significant" (Boland, Tenkrasi et al. 1994) ; in other (and more simple) words: the distributed cognition paradigm applies. If land management activities have to be coordinated, this coordination is often conflictual, due to the different world-views and values of land managers (Golay and Nyerges 1994) . Therefore, negotiation mechanisms (Jelassi and Foroughi 1989) have to be used to bring them to cooperate. Can a negotiation support system be classified as a Distributed cognition support system? The importance of effective social interaction within the negotiation process hints at a positive answer. And is a negotiation process CSDM? 5. Methodological consequences for CSDM As was asserted in (Golay and Nyerges 1994) , most current information system design methods (as for example Information Engineering (Martin 1989) or Merise (Tabourier 1986) ) suffer from several gaps related to their lack of social and behavioral science roots. These
73
methods do not deal very well with dispatching roles between actors and machine. They are also highly normative, and therefore have little flexibility for dealing with human purposefulness (Wilson and Wilson 1994). These gaps are especially critical for the design of systems such as Spatial Decision Support Systems, Distributed Cognition Support Systems or CSDM Support Systems, because of the highly social context in which they are generally used. Some authors have already suggested new approaches to design computer systems matching those requirements: (Rasmussen, Mark Pejtersen et al. 1990) suggest a highly flexible design process aiming to associate agents of the organization to cognitive tasks to be done. (Turk 1992) proposes a Cognitive Ergonomics Analysis Methodology where cognitive task allocation between users and software plays a central role. (Zachary 1988) proposes a design method for Decision Support Systems which emphasizes the role of the human decisionmaker; this method facilitates the application of naturalistic decision processes by the human expert and entrusts the machine with the information processing tasks for which the human brain is limited. Finally, (Boland, Tenkrasi et al. 1994) proposes designing principles for information technology supporting distributed cognition, which rely on a strong epistemology of cognition, sociology and decision-making. However, we do not have any clue as to which method to use for which type of problem or system. When should we promote an approach based on the paradigm of distributed cognition? And when an approach based on the paradigm of decision-making? 6. Some issues for further research From my point of view, a research program on this issue should be based on a typology of CSDM scenarios. The appropriateness of each method could then be tested on each scenario. Finally, an suitability matrix could be built, and further developments decided upon in order to fill in eventual gaps in the matrix. Another problem with land management applications of CSDM is to determine the organizational extent of the system. Should a system be designed for one activity? For one organization? For one part of the territory? And how to cope with the causal relations going across the thematic, organizational or spatial limits of the system? Finally, the interactive tools necessary to support social interaction for CSDM should be identified and designed. Among other such tools, we might mention interactive sketching to support map design through social interaction. References Boland, R. J., R. V. Tenkrasi, et al. (1994). Designing Information Technology to Support Distributed Cognition. Organization Science 5(3): 456-475. Etzioni, A. (1989). Humble Decision Making. Harvard Business Review (July-August 1989): 122-126. Golay, F. and T. L. Nyerges (1994). Understanding Collaborative Use of GIS through Social Cognition: "Do You See what I See ?". NATO ARW on Cognitive Aspects of Human-Computer Interaction , Palma de Mallorca, Spain, In Press.
74
Jelassi, M. T. and A. Foroughi (1989). Negotiation Support Systems: An Overview of Design Issues and Existing Software. Decision Support Systems 1989(5): 167-181. Malone, T. W. and K. Crowston (1994). The Interdisciplinary Study of Coordination. ACM Computing Surveys 26(1): 87-119. Martin, J. (1989). Information Engineering . Englewood Cliffs, New Jersey, USA, Prentice Hall. Norman, D. (1994). Things that Make Us Smart: Defending Human Attributes in the Age of the Machine . Reading, Massachusetts, Addison-Wesley. Pornon, H. (1995). Structure des organisations et trajectoires de mise en oeuvre des SIRS. Revue de geomatique (paratre) 5(1): Prlaz-Droux, R. (1995). Conception d'un systeme d'information reference spatiale pour l'amenagement et la gestion du territoire: approche systemique et procedure de realisation. These publie l'Ecole polytechnique federale de Lausanne. Rasmussen, J., A. Mark Pejtersen, et al. (1990). Taxonomy for Cognitive Work Analysis. Ris National Laboratory, DK-4000 Roskilde, Denmark. Simon, H. A. (1991). Bounded Rationality and Organizational Learning. Organization Science 2: 125-139. Tabourier, Y. (1986). De l'autre cet de Merise. Sysetmes d'information et modeles d'entreprise. Paris, Les Editions d'Organisation . Turk, A. (1992). Facilitating Task Analysis for Geographic Information Systems Through a Cognitive Ergonomics Reference Model. 11th Interdisciplinary Workshop on "Informatics and Psychology": Task Analysis in Human-Computer Interaction , Schaerding, Austria, Wilson, F. A. and J. N. Wilson (1994). The Role of Computer Systems in Organizational Decision Making. The Information Society 10(3): 173-180. Zachary, W. W. (1988). Decision Support Systems: Designing to Extend the Cognitive Limits. Handbook of Human Computer Interaction. Elsevier Science Publishers. Short biography Francois GOLAY, 1958, is a Swiss Professor for Spatial Information Systems with the Swiss Federal Institute of Technology, Lausanne (EPFL). He graduated as a Surveyor, and was during 8 years researcher and lecturer in GIS/LIS at the EPFL. He got his PhD with a doctorate thesis on "Modeling of Spatially Referenced Information Systems and of their specialized domains of use: methodological, organizational and technological aspects". He was then during 3 years senior-consultant by SIT-Conseil, a GIS consulting company in Geneva, Switzerland. He was in charge of the business analysis group, and realized many studies for state and city administrations in the field of GIS planning and GIS application design.
75
He was elected as a Professor at the EPFL at the beginning of 1994. Last year, he spent 8 months as a visiting scholar at the University of Washington, working with Prof. Nyerges on social aspects of GIS design and use. His research interests are going mostly to: · Methods for planning and design of Spatial and GIS applications · Improvement of GIS usability for land management activities · Organizational impacts and integration of GIS. These research directions are strongly linked to CSDM: · Improvement of GIS usability implies a better suitability to the type of activity in which they are used (decision-making, negotiation support, etc.) · Organizational integration and institutional issues are particularly important for CSDM · The design methods have to be improved to take social interaction and organizational integration in account
76
Zeno: a WWW System for Geographical Mediation Thomas F. Gordon Artificial Intelligence Division Institute for Applied Information Technology (FIT) GMD - German National Research Center for Information Technology Abstract. The central task in practical problem solving is to identify and choose among alterative courses of action. Computer science has failed to provide adequate tools for supporting rational, effective and fair decision-making under the conditions which usually prevail. Especially, computer science has yet to develop models of rational decision-making in groups which adequately take into consideration resource limitations or conflicts of interest and opinion. This paper provides an informal overview of Zeno, a mediating system for supporting discussion, argumentation and decision-making in groups, which explicitly takes these considerations into account. Also, a new subfield of computer science is proposed, "computational dialectics". whose subject matter is computational models of norms for rational discourse. Zeno is a contribution to this field, based on the thesis that rationality can best be understood as theory construction regulated by discourse norms. Now is the time to shift our view of computers from communications medium to negotiation medium, from knowledge processing to interest processing. Carl Adam Petri 1. GEOMED GEOMED-F is a half year European feasibility project on Geographical Mediation. As a result of this feasibility study, a proposal for a longer term project, GEOMED, is now being submitted. In addition to academic and industrial partners, GEOMED includes four partners who create, disseminate and use geographical information in planning procedures: the cities of Tilburg and Bonn, the region of Tuscany, and the Technical Chamber of Greece. An analysis of these users needs and requirements has shown that a wide variety of planning tasks at the community, regional and state level require access to geographical information of the kind typically represented in maps. The first goal of the GEOMED project is to apply advanced telematics technology to improve the accessibility of geographical information in heterogeneous, distributed GIS systems. Meta-data about the information available in these distributed GIS systems will be used to aid retrieval. Heterogeneous GIS systems will be made interoperable by using converters between proprietary GIS data formats and existing and emerging international standard formats. By "wrapping" basic GIS operations in a common interface, users will be able to access, view and manipulate maps on GIS servers from within email messages and hypermedia browsers. The quality and acceptability of geographical planning decisions depends not only on the availability and distribution of accurate information, but also on the fairness and openness of the planning procedure. When planning the path of a high-speed train system through communities and natural spaces, or the location of site for storing hazardous wastes, for example, the interests and
perspectives of the affected communities and citizens, the responsible regional or federal governments, environmental protection groups and industry representatives are likely to be in conflict. Involving representatives of these diverse interests in the planning process, at the earliest possible stage, can facilitate not only a better, higher quality plan, but also a plan more likely to be accepted by the affected communities, helping to avoid long, expensive delays or even legal battles. Telematics technology has the potential to dramatically reduce the costs of mediation, while at the same time increasing the opportunities for affected organizations and persons to participate in the process. The goal is to make the "information highway" a two-way street. Not only should citizens have improved access to information, they should also have improved opportunities to contribute information and participate in politicial processes. The GEOMED system will provide information, documentation and mediation services: 1. The information services will provide efficient and cost-effective access to geographical information in distributed GIS databases, over wide-area networks. This would include services for finding relevant GIS data, converting proprietary GIS data to standard formats for data interchange, as well as ways of viewing and browsing GIS data from within general purpose electronic mail, conferencing systems, and hypermedia systems, such as the World Wide Web.
2. The documentation services will provide a "shared workspace" for storing and retrieving documents and messages related to particular geographical planning projects. This would provide a convenient way for ordinary users to add information to the hyperspace of documents available on the network. Security and privacy concerns would be addressed here. 3. The mediation services provide assistance to the human mediators of a "round table". By structuring messages, an issue-based information system can be constructed, allowing the efficient, context sensitive, retrieval of prior messages. The rules or "interaction protocol" of the mediation procedure will be modelled so as to assist mediators with providing support to participants about the appropriateness of their messages. This paper will focus on mediation services. The Zeno system described here was designed by GMD, before the GEOMED-F project, and is currently being evaluated and redesigned by the GEOMED consortium. 2 The Rationality Crisis The central task in practical problem solving is to identify and choose among alternative courses of action. A couple must decide which car to buy. The designers of the Dylan programming language had to decide whether its syntax should be more like Lisp or Algol. Volkswagen must decide whether to manufacture the new "Beetle" shown at a recent international automobile show. The editors of the General Anzeiger had to decide whether to put the story about the burning of a housing complex for asylum seekers on the front page or bury it near the back. The Social Democratic Party had to decide whether or not to include an Autobahn speed limit in their platform for the upcoming election. The German parliament had to choose between Bonn and Berlin to be the capital city of the reunited German state. The United Nations and NATO must decide whether or not to use military force in Bosnia. The main purpose and promise of computers and information technology is to improve the procedures for making choices of this kind in industry, government, and other kinds of organizations and groups. The improvement may be in effectiveness, efficiency or, when the conflicting interests of multiple parties are involved, fairness. The different subfields of computer science contribute to this abstract goal in complementary ways. When there is perfect information about a problem, an efficient algorithm or theorem prover may be used to compute or search for a solution. Large data bases make a wealth of relevant information readily available. Knowledge-based systems are useful for tasks where there is sufficient consensus about the knowledge required and the costs of knowledge acquisition and maintenance can be amortized over the expected life time of the system. High capacity networks and hypermedia technology are making it cheaper and easier to disseminate and access all kinds of information, including text, sound, color graphics and video. So-called "virtual reality" systems and other kinds of computer-simulation make it possible to explore and vividly imagine the likely effects of alternative courses of action. Even applications as banal as word processing, spreadsheets, and electronic mail flourish in the end because of their role in the processing and distributing information to be used in making decisions. As useful as these technologies have been shown to be, none of them squarely confronts the problem of supporting effective, fair and rational decision making procedures under the conditions which usually prevail. Either they only deal with a part of the problem, such as providing access to relevant information, or they restrict their attention to special problem solving contexts where certain simplifying assumptions, such as perfect information, can be made. Under what conditions must decisions usually be made? Here are some of the more salient factors: 1. There is both not enough and too much information. For some parts of the problem relevant information which would be useful for making a decision will be missing. For other parts, there will be more information than the persons responsible for making the decision will have time to even retrieve, let alone comprehend. 2. The resources which can be applied to finding a solution are limited. Time, in particular, may be "of the essence": a solution must be found before the issue becomes moot. 3. The expected value of the known alternative decisions is not high enough to make it cost effective to invest substantial resources in implementing a program, knowledge base, or other kind of elaborate computer model to use in helping make the decision. 4. However much information is available, opinions differ about its truth, relevance or value for deciding the issue.
5. Arguments can and will be made pro and contra each alternative solution. 6. Reasoning is defeasible. Whatever choice seems best at the moment, further information can cause some other alternative to appear preferable. 7. Factual knowledge about how the world functions and its current state is not sufficient for making a decision. Value judgments about ethical, political, legal and aesthetic factors must not only also be taken into consideration, but are the critical issues requiring the most attention. 8. Several persons have a role to play in making the decision and will be affected by it. Conflicts of interest are inevitable; support for negotiation and other procedures for achieving consensus and compromise are required. 9. Finally, the persons responsible for making the decision are not proficient in mathematics, logic or any other formal methods for solving problems. Again, this is not a worst-case characterization, but rather a fair and realistic description of the conditions under which decisions must usually be made. Increasing awareness and acceptance of this fact, both among the general public and experts in fields such as philosophy, jurisprudence and mathematics, has led many people to cast doubt on the whole enterprise of rationality. Computer science is built upon a conceptualization of rationality coming increasingly under fire. Preserving a proper role and justification for information technology will depend critically on developing the theory, methods, and applications for assisting individuals and groups to make effective and fair decisions under ordinary circumstances. On the theoretical front, computer science desperately needs to intensify its dialogue with the humanities, including philosophy, law, history, literature and the arts. Effectiveness and fairness are normative concepts. The natural and engineering sciences provide us models of how the world functions and technology for changing the world in sometimes dramatic ways, but they address only the easier half of the general problem of making rational decisions. Knowing what can be done tells us nothing about what should be done. It is the humanities which provides standards and methods for evaluative judgment. Regarding methods, the metaphor of an assisting computer system, the guiding idea of the AC research program at GMD, is a useful starting point. The mediator, moderator or arbitrator of a discussion, debate, brain-storming session, or bargaining meeting is a kind of assistant. He or she is not a principal participant in the discussion, but rather has an ancillary function, such as helping to assure that the speakers abide by the rules of the procedure. A mediator has little or no authority. It is neither cop nor judge. The function of a mediating computer system is not to automatically enforce some formal, and therefore rigid, set of procedural rules for resolving conflicts and deciding issues, but rather to advise the participants about the rules and provide other information about the state of the proceeding. As for applications of this idea, several mediating systems for coordinating the activities of a group have been designed and implemented during the course of the AC program in the Computer Supported Cooperative Work (CSCW) research division of our institute [Kreifelts, et. al., 1991; Kreifelts, et. al., 19931. These systems help groups with such tasks as scheduling appointments and meetings, creating and monitoring plans, and guiding the flow of forms through an organization. Zeno will be a mediating system for assisting the more generic task of discovering and choosing among alternative courses of action. The Zeno system will be able to moderate a discussion or debate about any topic between ordinary persons with no particular technical skills in computer science or logic. Our ambition is to develop a practical system for supporting decision-making in groups under ordinary circumstances. There is a trade-off between ease-of-use and functionality. Supporting deep reasoning requires complex formal logics. Ordinary users cannot be expected to express their positions in formal languages of any kind, and the state of the art of natural language processing has not yet reached the point where the translation to and from a suitable logic can be automated. Finding a good trade-off between ease-of-use and expressiveness which does not require natural language processing is one of the main problems to be addressed by Zeno. We call our current approach lazy formalization. The idea is that the participants in a discussion are free to choose the level of formalization they deem appropriate. In fact, a speaker may use any means of expression desired, formal or informal, textual, graphical, or multimedia. The discussion begins using a logic which is so simple that it can be hidden completely behind an intuitive user-interface.
To give a better idea of the kind of system we have in mind, the next section describes Zeno’s current design, from the user’s perspective. The next section is more theoretical; it discusses a proposal for a new field of computer science research, to be called "computational dialectics", whose subject matter is computational models of norms for rational discourse. This field is founded on a conception of rationality which, we claim, can withstand the criticism and concern of the skeptics. The final section discusses related work. 3 A Tour of the Zeno System The Zeno system will be configurable for different kinds of deliberations about some topic, such as brainstorming sessions, council or board meetings, contract negotiations, design team discussions, and law suits. There will be two interfaces, one to configure the system and another for using a particular configuration to mediate a proceeding. The first interface can be viewed as a high-level programming language for implementing mediating systems. Compiling a program in this language generates a mediating system for a particular type of proceeding. We will have more to say about this "programmer’s interface" later. Let us first take a look at the interface to be used by the persons taking part in a discussion. Figure 1 shows a mock-up of a Motif version of the main window of the Zeno application. It appears to be a cross between an electronic mail program and a hypermedia browser, and indeed it has characteristics of both. The "File" menu includes the usual commands for such things as opening, closing and printing documents. A Zeno document contains references to all the messages registered with the mediator for a particular proceeding or task. To open a document, the user must first log in to the mediator’s machine on the network, providing his or her name and password. The rights of the user to view or send some message may depend on such factors as the type of the proceeding and the role of the user in this proceeding. Several participants can open and modify the same document simultaneously; as messages are only added during the discussion and never deleted, the usual synchronization problems of databases and multiuser text editors do not appear here. However, the rules of the proceeding may have to specify when each kind of speech act is to be legally effective; e.g., at the time it was sent or at the time of receipt by the mediator. Instead of the usual "Save" there is a "Send" command. A user can modify the network of claims and arguments locally, playing "what-if" games to see the effects of alternative lines of argument, before sending his contribution back to the moderator. There will be unlimited undo and redo commands as well as a "Revert" command so as to facilitate this kind of private contemplation. There will also be a "Save As" command for saving a local copy of the document and for exporting it to other file formats. Of particular interest would be the possibility to export an outline of the discussion, or selected parts of it, in the native formats of various word processing, "idea processing" and "presentation" applications. This would be quite useful for writing such things as the "minutes" of the discussion or the justification of a decision. just below the menu bar, in the center of the display, is the title of the proceeding, in this case "Miller vs. Smith", suggesting this may be some kind of legal discussion. In the area below the title is a scrollable transcript of the messages which have been registered with the mediator. These need not be all, or even most, of the messages which have been exchanged by the participants in the proceeding. It is not intended that the Zeno system be used to replace all other forms of communication within a group. On the contrary, it should be used primarily for those speech acts which are to have some kind of official or binding character. This brings us to a problem Zeno, like other CSCW applications, must deal with: How to integrate the system with the other applications, to facilitate interoperability, data exchange and ease-of-use? Presumably most users will already be using some other program for electronic mail. Some may not want to use another system to send messages to a mediated discussion, with yet another set of userinterface conventions and quirks. While a complete solution to this problem will have to await the wide-spread use of distributed object-oriented programming environments, an intermediate approach is possible for the time being. First of all it should be possible to cut and paste data between Zeno messages and other applications, at least for the more popular data formats. Secondly, a simple command language, along the lines of the ones used by network mailing lists, will allow messages to be sent to the mediator using any electronic mail program. Below the transcript in the Figure 1 is some "header" information about the message being displayed, including a short description of the "claim" being made in the message, the name of the sender, the date and perhaps time the message was sent, and a pointer to the message for which this message is a response. The claim can be any unique title for this message. It need not actually be a declarative sentence, although this might be a good practice. In the example, the message claims "This map
shows where Escondido is." and is offered to support the claim of the message contributed earlier by Lynn Bild, who claimed that "Escondido is near San Diego." To the left of the field naming the previous message is a label showing the type of this message, in this case an argument "pro" the claim of the other message. Although the full set of message types will be defined by the designers of a Zeno application, there may be a few "standard" types, such as: Agree. Used to agree with or concede some other claim. Disagree. Used to challenge, question or deny the other claim. Pro. A claim which, if accepted, tends to make the claim of the prior message more likely or probable. Con. A claim which, if accepted, tends to make the claim of the prior message less likely or probable. Alternative. Proposes another solution to the problem, or takes another position with respect to the issue. Utility. Makes an assertion about some effect or consequence of deciding to accept the claim of the prior message. For example, one could claim that a Porsche is a fast car, or that a Volvo is a safe car. Relevance. Questions whether the prior message really is of the type asserted. For example, suppose Judy claims that it will rain next Saturday and Joe then argues that this is unlikely, because he has planned a picnic for then. Rather than arguing about whether or not he has in fact made such plans, Judy might prefer to question the relevance of his plans to her prediction. Refinement. Registers a claim which only becomes an issue if there is a decision to accept the claim of the other message. For example, if it has been decided to buy a Chrysler, this kind of message can be used to propose buying a particular model, such as a Voyager. Comment. Can be used as a "catch-all" message type when none of the other types available seem appropriate, or when the speaker wants to avoid the formal consequences of some other speech act. In some applications, it may also be permitted to send comments, and perhaps other types of messages, anonymously. To compose a message, the user selects its type from the "Argue" menu. Another name may be preferable for some applications, so this will be configurable in the Zeno programming environment. It might be objected that users will not want to take the trouble to label the type of their messages, or would prefer to remain vague or ambiguous about the intended pragmatic effect of some speech act. For example, in a message to the boss criticizing his plan to manufacture horseshoes instead of tires, one might prefer to tactfully couch the warning in the language of admiration and support. A large, bold label of criticism might be counterproductive. This is admittedly a problem, but not an insurmountable one. One can use the innocuous comment label in such cases. Also, as the body of the message is subject to no formal restrictions, the user is encouraged to apply her rhetorical skills, to the best of her ability, here. However there is a better response to this objection. Performative speech acts are often effective only if they have the proper form, regardless of their intended meaning. In business and government, one often has to say the magic words. There are sound reasons for this formality. The interests of the persons affected by a decision will differ; often they are diametrically opposed. The buyer of some product or service would like the price to be low; the seller would like it to be high. Whenever it is in the interest of one party to speak vaguely, so as to hedge his bets by delaying the determination of the message’s performative effect as long as possible, there is probably another party to the transaction with exactly the opposite interest, to have the matter clarified definitely as soon as possible. Consider a letter offering to buy some product from a mail order distributor. The seller would like the assurance that it is indeed a binding offer before sending the goods. The buyer would prefer this question to be decided after the goods have arrived, to be able to inspect them before deciding whether or not to pay. He would like to be able to back out of the deal by arguing that his "offer" was really only an "inquiry". Formal procedures and "bright-line" criteria for categorizing speech acts provide the means to fairly allocate risks and responsibility in such situations. Clear conventions also
dramatically reduce the cost of doing business, by avoiding lengthy and expensive conflict resolution procedures, such as law suits. There is no universally optimal degree of formality, suitable for all kinds of group decision making contexts. In particular, CSCW systems which support only informal modes of communication are biased; they cater to the special interests of only some of the persons affected by the decisions made using the system. The aim in Zeno is remain neutral by providing a configurable environment supporting a wide range of formality. Design choices about this and other aspects of the procedures for making decisions in a group or organization should be made by representatives of the various interests groups affected, through some fair political process. Once a message has been sent, the rights and obligations of the other participants will change, depending on the rules of the proceeding. For example, in a negotiation, an "offer" message may give some other participant the right to "accept" within 30 days. Or the posting of an issue may require position statements to be made within six months, before the issue comes up for vote. One of the main responsibilities of the mediator is to maintain a calendar and agenda of such tasks. There are commands for displaying these documents in the "View" menu. The calendar shows the schedule of dates and times for various activities. One possible service of the mediator would be to remind users of deadlines. The agenda is a prioritized list of issues to be resolved, where the criteria used to prioritize issues or tasks will depend on the application. Returning to Figure 1, below the header information is a scrollable pane for the body of the message. In the example, this is a color map of San Diego. Again, there are no restrictions, in principle, on the kinds of data which may be included in messages. From the perspective of the Zeno’s formal logic, each message is a proposition. As always informal logic, the intended meaning or interpretation of the proposition is ignored when deriving consequences and other kinds of formal properties. However, the persons participating in the discussion will of course be quite interested in the meaning of a message, which will presumably play a dominant role in their contemplations about how best to respond. Propositions in Zeno are situated; they are contextually embedded in a discussion between persons taking place in time. A proposition does not hang in the air, but is stated by a particular person at a particular time. Except of course for the opening proposition, every statement is made in response to some other claim made in the course of a discussion. One must be careful when carrying over arguments and claims made in one context to some other context in this or another discussion. Syntactically equivalent claims in different branches of a discussion are not presumed to be identical. A message may also be a compound document, consisting of a combination of graphics, text and other objects, including hypertext links to other messages and documents. Unlike the message types discussed above, these hypertext links have no particular semantics for the logic of the Zeno system. They may be used in any way a user sees fit and help to reduce the "rigidity" of Zeno’s formal logic. While we are on the topic of hypertext links: as every message except the first is a response to some other message, they form a tree structure. The "Navigate" menu includes the usual commands, familiar from hypertext systems, for browsing this tree. For example, the "Top" command takes the user to the first message of the proceeding; the "Up" command moves to message responded to by the current message; and the "Next" and "Previous" commands cycle through the other responses at the same level. To move to a lower level, there are submenus for each type of response, such as "Pro", "Con", and "Relevance". To perhaps belabor the point: this graphical interface provides an intuitive way to express the elements required by a formal logic (propositions and various kinds of relations between them) without requiring the use of some formal syntax. At the bottom of the window in Figure 1 is the final pane to be discussed; it displays information about the current status of the claim. On the left-hand side there are two sliders, showing the logical status of the claim along two dimensions. The first dimension concerns the quality of the position, relative to the other proposed alternatives. Quality is computed using the utility arguments which have been made for each of the alternatives. (See below.) The other dimension concerns the likelihood, probability or feasibility of the position and is computed using the arguments pro and contra which have been made concerning it. Of course, these sliders can not be manipulated by the user, willy-nilly, to set the value of these parameters. Rather, they are continuously computed by the Zeno system, using a combination of theorem proving and constraint satisfaction techniques.
To the right of these two sliders is a group of buttons showing whether the claim has been accepted, rejected or yet to be decided. The procedure for making this decision will depend on the rules of the particular type of proceeding. Common methods include randomly selecting some alternative, using the best possible alternative computed by Zeno, voting, or granting the responsible manager or authority discretion to decide as he or she sees fit. Notice that the quality and probability measures computed by Zeno have only an advisory character; they may be taken into consideration by the persons responsible for making the decision, but need not determine it. This flexibility is perfectly reasonable. After all, the system is founded on the premise that reasoning is defeasible. The responsible person may have information which for various legitimate reasons he is unwilling to divulge to the group and which tips the scales in favor of some other alternative. Or he may simply prefer to follow his intuitions. Associated with each claim are three other documents: 1) a worksheet for making and viewing claims about the relative weight or importance of the arguments pro and contra this claim; 2) another worksheet summarizing the arguments made about the relative utility of this claim and its alternatives; and 3) a document for recording information about the decision. This latter document may include such things as the name and "signature" of the person making the decision, the date the decision was made, an explanation or justification of the choice, or a tally of the votes for and against each alternative, as appropriate. The worksheet for presenting utility arguments is shared by all alternative positions for some issue. It has two parts. The first part is a list of utility claims which have been decided to apply to each alternative position. For example, when discussing which car to buy, the following utility claims may have been accepted BMW 520i. good chassis, good styling, good interior, good safety, fair fuel economy. Mazda Xedos. good chassis, fair styling, fair interior, good safety, fair fuel economy. Opel Omega. good chassis, good styling, good interior, good safety, fair fuel economy. These claims could be displayed in a table, but this will not generally be the case. A utility claim may be an arbitrary proposition about some effect of choosing the alternative; Factors or dimensions, along which the alternatives would be ranked, need not be first be systematically identified. The second part of the utility worksheet is a list of "constraints" about the relative values of these utility claims. In the car buying example, the following evaluation constraints may have been accepted: • good interior > fair interior • good safety > good interior • good safety > fair fuel economy • fair interior + fair fuel economy > good safety The main purpose of these constraints is to provide an easy, qualitative way to express and argue about preferences and value judgments. It is not necessary here to devise factors and utility functions, let alone assign numeric values to particular properties. Given this qualitative information, constraint satisfaction techniques can be used to rank the quality of the alternative solutions. In the graphical user interface, there will be some intuitive and quick way to go to the message in which it was decided to accept some claim shown on this worksheet. For example, to find out why it was decided to believe that an Opel Omega has a good chassis, one might be able to just double click on that property on the worksheet to begin browsing any arguments there may have been about the quality of the chassis. This applies to the evaluation constraints as well, which are debatable just like other claims. It remains to discuss the "programmer's" interface for configuring Zeno for a particular kind of discussion or proceeding. Some of these discussions will be primarily cooperative, others will be more adversarial. Other factors to consider when drafting the rules of the procedure include its goal and purpose, the types of speech acts required, and the roles of the participants. The rules
of procedure will specify just what speech acts are permitted, obligatory or forbidden in each situation, and at what time, where a situation consists of the messages which have already been registered with the mediator. A configuration also needs to specify what the mediator should do in the case of a violation, or attempted violation, of the rules. However complex the rules, situations are likely to occur which were not anticipated. One way to avoid rigidity when configuring Zeno is to use the legal system as a model. Unlike formal systems, legal rules are not self-applying. Persons must interpret, and reinterpret, the rules in the context of their current situation. In the worst case, a law suit may be necessary to resolve disagreement about the meaning of the rules. In a Zeno application, this strategy could be realized by having the mediator send a private warning to the persons affected, who would then have the option of negotiating a "settlement" or initiating some quasi-legal procedure for resolving the conflict. The language for defining these rules has yet to be designed. It is still unclear whether a simple and convenient graphical user-interface will be possible for configuring Zeno. Arguably, it is not quite so important for this interface to be easy for lay persons to use, as some small number of configurations will be adequate for most purposes. Experts could be hired to help design and implement a custom configuration. On the other hand, it is critically important that every user be able to understand the rules of the proceeding, so as to be able to effectively participate and decide whether or not others are "playing by the rules". 4 Computational Dialectics Zeno is but one project in the field we call "computational dialectics". The subject matter of this field is the design and implementation of computer systems which mediate and regulate the flow of messages between agents in distributed systems, so as to facilitate the recognition and achievement of common goals in a rational, effective and fair way. The term "agent" here is intentionally abstract. An agent may be a person or organization, or some computational entity, such as a process, task or object, in the sense of object-oriented programming. In a complex, distributed system consisting of multiple agents working together, some of the agents will be natural persons or organizations, and others will be artificial agents implemented by programs executing on one or more computers. The field of computational dialectics has its analytic, empirical and normative aspects. The analytical task is to develop models of the structure of discourse and communication tuned to the task of group problem solving and decision-making. This distinguishes the models of dialectical processes from those designed for understanding natural language. The analytical task, as usual, consists in identifying, categorizing and analyzing the formal properties of these models along various dimensions. The empirical aspect involves developing and testing theories of how, in fact, groups of agents use language to make decisions. Finally, the normative aspect of the field is concerned with drafting and justifying principles and norms for regulating communication and decision-making in groups, where individual agents may have incompatible beliefs about the world and competing interests. To be sure, much prior work has been done in this area, if not under this label. It is our hope and goal to bring together researchers who have been working implicitly on this subject in the fringe of other parts of computer science, including distributed systems, distributed artificial intelligence, nonmonotonic logic, case-based reasoning, machine learning, conflict resolution in concurrent engineering, artificial intelligence and law, issue-based information systems and computer-supported cooperative work. Presumably, research in computational dialectics would be more productive if the people interested in this subject would begin to form a research community. As a first step in this direction, we have organized, together with Ronald Loui, a workshop on computational dialectics for the Twelfth National Conference on Artificial Intelligence (AAAI-94). Additional work is needed to reach people outside the Al community. The thesis of the Zeno project, which represents only one position in the field of computational dialectics, is that rationality can best be understood as a theory construction process regulated by discourse norms. The dominant conception of logic in analytical philosophy is limited to the study of the notions of consequence and contradiction given some set of premises. It says nothing about how the premises are or should be constructed. However, by viewing rational discourse as a process of theory construction, a strong connection to logic is preserved. Our aim is to complement logic with norms regulating the pragmatic aspects of constructing and using theories.
5 Related Work Prior work of the CSCW group at GMD on coordination systems was mentioned in the introduction [Kreifelts, et. al., 1991; Kreifelts, et. al., 19931. Again, whereas these systems support the scheduling of meetings, the monitoring of tasks and activities and the flow of forms through an organization, Zeno mediates a discussion about the pros and cons of alternative solutions to a problem. Several others hypertext systems have been constructed for organizing and browsing arguments, based either on the Conklin’s Information-Based Issue Systems (IBIS) model [Conklin and Begeman, 19881 or Toulmin’s model of argument structure [Toulmin, 1958; Marshall, 1989; Schuler and Smith, 1990]. The argument structure designed for Zeno is a synthesis of ideas from these systems. Unlike Zeno and the Pleadings Game, discussed below, these other hypertext systems do not use logical dependencies to constrain or facilitate the further development of the discussion. The goal in Zeno is to achieve the simplicity and ease-of-use of IBIS without sacrificing a solid, logical foundation, by drawing on the results of argumentation systems for nonmonotonic logic [Pollock, 1988; Simari and Loui 1992; Geffner and Pearl, 19921. With the exception of the Pleadings Game, none of these other systems distinguish the roles or interests of the persons involved in the discussion, so the idea of regulating argumentation using discourse norms does not appear. The Pleadings Game [Gordon, 1993a; Gordon, 1993b] is a computational model of a mediator for a particular kind of legal proceeding, the pleading phase of a civil case. Pleading is a two-party adversarial procedure, whose purpose it is to identify the issues of the case. The plaintiff has the burden of defending his claim against various kinds of attacks by the defendant. The Zeno system generalizes the Pleadings Game in a number of ways. Whereas the Pleadings Game is a particular mediating system for one kind of decision-making procedure, the goal of Zeno is to provide a convenient language for specifying a broad range of mediating systems, for both cooperative and adversarial contexts. Another important difference is that the Pleadings Game model has an entirely theoretical purpose, to demonstrate how judicial discretion can be fairly and rationally limited by factors other than the literal meaning of legal texts. The purpose of the Zeno system, on the other hand, is to provide a practical tool for implementing systems which mediate actual discussions between persons. Notwithstanding these differences, both Zeno and the Pleadings Game are based on insights from legal philosophy, especially the normative theories of legal argumentation of H.L.A. Hart [19611 and Robert Alexy [1989]. Hart and Alexy, in turn, both draw heavily on the "speech act" theory of language going back to (late) Wittgenstein. There is an ongoing controversy within CSCW about the suitability of speech-act theory as a basis for computer systems for coordinating human activity in organizations. A recent issue of the CSCW journal includes two articles on this very issue; one by a critic, Lucy Suchman [19941, the other by Terry Winograd [1994], who together with Fernando Flores first introduced the use of speech-act theory to CSCW in the influential "Understanding Computers and Cognition: A New Foundation for Design" [19861. Legal philosophy provides another perspective on this issue, which reveals weaknesses in the arguments of both Suchman and Winograd. Suchman takes the position, closely related to Grudin’s in [19901, that "the adoption of speech-act theory as a foundation for system design, with its emphasis on the encoding of speakers’ intentions into explicit categories, carries with it an agenda of discipline and control over organization members’ actions". In other words, she claims this kind of CSCW system furthers the interests of management at the expense of workers. She proposes instead that CSCW systems be designed with "an appreciation for and
engagement with the specificity, heterogeneity and practicality of organizational life." Winograd counters by arguing, in essence, that a certain amount of rigidity and formality is a necessary evil in large organizations: "When people interact face to face on a regular day to day basis, things can be done in a very different way than when an organization is spread over the world, with 10,000 employees and thousands of suppliers". And further, "The use of explicitness makes possible coordination of kinds that could not be effectively carried out without it." If we identify corporate interests with the interests of management and suppose that these interests conflict with those of employees, then Winograd may be thought to be conceding Suchman’s main point here. However, he goes on to argue that coordination systems can be successful only if they are "grounded in the context and experience of those who live in the situation". To assure this is so, Winograd argues that users should participate in the design of the system. At first glance, there may not appear to be anything new or interesting about this debate from a legal perspective. Surely it is noncontroversial that changes in the rules of an organization, whether or not brought about by the introduction of new
technology, have a political dimension requiring fair procedures for negotiating an acceptable compromise balancing the interests of all concerned. What does make this debate interesting from a legal point of view is its close relationship to an old debate in legal philosophy about the status of legal rules. In the previous century, German conceptualism (Begriffsjurisprudez) adopted a deductive view of legal reasoning. In modern terms, they sought to apply the axiomatic method to the law. The resolution to any conceivable legal dispute was contained, implicitly, in the axioms, waiting to be discovered by a process of deduction. This view depends critically on the "correspondence theory of truth", which underestimates the difficulty of deciding whether the concrete facts of a case should be subsumed under the general terms used in a statute. This is where Hart comes in. Hart recognized that the meaning of laws cannot and should not be fixed at the time of their enactment by a legislature. Rather, the meaning of the law must be continuously reinterpreted and re-evaluated in the context of deciding specific cases, in the courts. Hart noted that the ability of natural language to be imprecise is a feature, not a defect; it allows power to be delegated to the courts to decide issues in the context of concrete cases, when more information is available. This line of reasoning leads to a justification of the division of powers between the legislative and judicial branches of government. Suchman’s main mistake is to conclude that rules framed in terms of general "categories", only serve the interests of a particular class, management. There are at least two problems with this position. The first is that the rights and interests of employees, too, may be protected only by this kind of general rule. The "technology" of the language of laws, rules and agreements is interest neutral. The second problem is that the moral principle of "universalizability" requires norms to be expressed in terms of general categories, rather than concrete situations. This derives from the notion of equality under the law. The tension between equality and doing justice to the "specificity, heterogeneity and practicality of organizational life" is resolved by interpreting and reinterpreting general rules to decide issues raised by concrete cases. Is the formal structure of speech acts in Winograd’s kind of CSCW system like a system of laws? It should be but is not. The problem is that these formal structures have been used to define and create the space of actions, rather than the space of rights and obligations. They have been used to define what is possible, rather than what is ideal. It is not enough to allow users to participate in the design process. Users, too, are not omniscient; they cannot foresee all the possible consequences of an abstract set of norms, divorced from the concrete facts of particular situations. It should be possible to do what is best, and not merely that which is obligatory given a strict, formal interpretation of the rules. Zeno is modelled after the legal system. The formal rules of a decision-making procedure are not used to limit the space of possibilities. Users remain free to take responsibility for their own actions. They may, at their own risk, violate the formal rules. The mediating system is neither the long arm of the law, nor of management. Its job is to advise users about their rights and obligations, not to enforce the rules. Procedures will be provided for resolving disputes about the meaning of the rules, analogous to court proceedings. Acknowledgments Earlier versions of this paper were read by my colleagues Barbara Becker, Gerhard Brewka, Peter Hoschka and Hans Voss. I would like to thank them all here for their constructive suggestions and encouragement. References [Alexy, 1989] R. Alexy, A Theory of Legal Argumentation, Claredon Press, Oxford, 1989. [Conklin and Begeman, 1988] J. Conklin and M.Begeman. gIBIS: A Hypertext Too] for Exploratory Policy Discussion. ACM Transactions on Office Information Systems, 6(4):303-331,1988. [Geffner and Pearl, 1992] H. Geffner and J. Pearl. Conditional Entailment: Bridging Two Approaches to Default Reasoning. Artificial Ingelligence , 53(2-3):209-244, 1992. [Gordon, 1993a] T. F. Gordon.The Pleadings Game: Formalizing Procedural justice, In Proceedings of the Fourth International Conference on Artificial Intelligence und Law, pages 10-19, ACM Press, 1993. [Gordon, 1993b] T. F. Gordon. The Pleadings Game: An Artificial Intelligence Model of Procedural justice. Ph.D. diss., Fachbereich Informatik, Technische Hochschule Darmstadt, 1993.
[Grudin, 1990] J. Grudin. Groupware and Cooperative Work: Problems and Prospects. In B. Laurel, editor, The Art of Human Computer Interface Design, pages 171-175, Addison-Wesley, 1990. [Hart, 1961] H. L. A. Hart, The Concept of Law, Oxford University Press, 1961. [Kreifelts et al., 1991] T. Kreifelts, E. Hinrichs, K. H. Klein, P. Seuffert, and G. Woetzel. Experiences with the DOMINO Office Procedure System. In Proceedings of the Second European Conference on Computer Supported Cooperative Work, pages 117-130, Kluwer, Dordrecht, 1991. [Kreifelts et al., 1993] T. Kreifelts, E. Hinrichs, and G. Woetzel. Sharing To-Do Lists with a Distributed Task Manager. In Proceedings of the Third European Conference on Computer-Supported Cooperative Work, pages 31-46, Kluwer, Dordrecht, 1993. [Marshall, 1989] C. C. Marshall. Representing the Sructure of Legal Argument. In Proceedings of the Second International Conference on Artificial Intelligence and Law, pages 121-127, Vancouver, ACM Press, 1989. [Pollock, 1988] J. Pollock. Defeasible Reasoning, Cognitive Science, 11:481-518, 1988. [Simari and Loui, 19921 G. R. Simari and R. P. Loui. A Mathematical Treatment of Defeasible Reasoning and its Implementation. Artificial Intelligence, 53(2-3):125-157,1992. [Schuler and Smith, 1990] W. Schuler and J. B. Smith. Author’s Argumentation Assistant (AAA): A Hypertext-Based Authoring Tool for Argumentative Texts. In A. Rizk, N. Streitz and J. Andre, editors, Hypertext: Concepts, Systems and Applications, Cambridge University Press, 1990. [Suchman, 1994] L. Suchman. Do Categories Have Politics? The Language/Action Perspective Reconsidered. Computer-Supported Cooperative Work, 2:177-190,1994. [Toulmin, 1958] S. E. Toulmin. The Uses of Argument. Cambridge University Press, 1958. [Winograd and Flores, 1986] T. Winograd and F. Flores. Understanding Computers and Cognition, A New Foundation for Design, Ablex, Norwood, New Jersey, 1986. [Winograd, 1994] T. Winograd. Categories, Disciplines, and Social Coordination. Computer-Supported Cooperative Work, 2:191-197, 1994.
Information Use in the Application of SDSS to Land Use Planning Debates Jonathan Gottsegen University of California, Santa Barbara
[email protected] How does the presentation of spatial information facilitate or inhibit productive discourse in environmental or land use issues? This question is a specific instance of the general application of spatial decision support systems (SDSS) to multiparty decision-making, and it is additionally important with the rapid proliferation of geographic information systems (GIS) to support decision making in environmental agencies and nongovernmental environmental organizations. Answers to the question of the role of information in land use and environmental decisions have significant implications for the way spatial information systems are developed and used. This paper raises issues critical to designing multiparty decision support systems for land use and environmental policy-making and suggests methods for beginning to address these issues. It concentrates on the adoption of information in the social and often contentious environment of land use policy-making and suggests research that will lead to improvements in the design of multiparty SDSS based on a more complete understanding of the factors influencing the adoption of information in such an environment. It derives from my experience in applying GIS to land use planning and from research on information use and decision-making in policy environments. Planners or policy-makers who produce spatial information often presume that additional information will necessarily enlighten the dialogue so that all of the parties in a debate will arrive at a rational resolution of the con-flict. This presumption requires that actors in the policy process behave at least partly according to precepts of rational choice models of decision-making. However, environmental policies are developed through a social discursive process that often seems chaotic and irrational (Hajer, 1993). Policies tend to be the outgrowth of social interaction between opposing sides with different values and views of the issue. This interaction is often antagonistic resulting in highly charged conflict. Thus the practice of policy-making is often a process of conflict resolution and directing the interaction to productive results rather than of model building and rational analysis (Fisher and Forester, 1993). The knowledge that is acted on by decision makers is constructed from values, experiences, affect, and meanings associated with a place as well as objective information. The composite of all of these components has been called "commonsense knowledge" (Kuipers, 1983), and it is this commonsense knowledge that underlies policy debates and decisions. It is becoming accepted among the GIS community that the effectiveness of the traditional approach of presenting scientific information in decision-making is limited by the consideration of other knowledge held by decision-makers. Rushton (1995) has described this more personal knowledge of places in locational decisions as a consideration of geographic space as compared to the solution space of locational models. Thus, even given the same objective information, the response to the information will vary among parties involved in a land use debate because of the different commonsense or geographic knowledge resulting from the involved parties' differing subjective components. Because of the social nature of policy-making, the use of information in the policy process is often indirect (Zwart, 1991), so simply throwing addi-tional data at parties involved in the policy debate will often have no additional benefit (O'Hare, 1987). When considering information systems for resolving land use conflicts, it is essential to understand the discursive nature of the debate and the role of differing beliefs and values in influenc-ing stakeholders'
91
response to information in the policy process. Data provid-ers and analysts must be more aware of how their potential clients respond to the data. They must also develop new models of the role of information in the policy process (e.g. Innes, 1988; Dutton and Kraemer, 1985). Armstrong and Densham (1990) describe SDSS as systems to help decision-makers solve semistructured problems, and several articles have enumerated the necessary functions and components of SDSS (Densham and Rushton, 1988; Densham and Goodchild, 1989). However, there are several important questions that must be answered if the concepts and technology of SDSS are to extended to highly contested multiparty decision environments. Armstrong's (1993, 1994) research agenda for expanding SDSS to multiparty environments concentrates on the technical and conceptual aspects of sharing views of information although he briefly introduces the role for SDSS in conflict resolution. Other practitioners have also begun to take advantage of the dynamic nature of GIS or SDSS to assist in environmental conflict resolution (Godschalk, et al., 1992; Maguire and Boiney, 1994; Brown, et al., 1994). Maguire and Boiney (1994) make the useful distinction between decision analysis and conflict resolution. Following this division, it seems that many SDSS applications concentrate on the decision analysis component. In the area of conflict resolution, both Godschalk, et al. (1992) and Maguire and Boiney refer to concepts of principled negotiation developed by the Harvard Negotiation Project (Fisher and Ury, 1981). These include 1) separating people from the problem, 2) focusing on interests not positions, 3) inventing options for mutual gain, and 4) using objective criteria. It is clear how SDSS can accomplish the first and fourth objectives, i.e. separating the people from the problem and using objective criteria. In addition, the third objective, i.e. inventing options for mutual gain, is the professed purpose of SDSS. However, the means for realizing a focus on interests rather than positions is not evident in the current application of SDSS. Some implementations of SDSS have applied the revealed preference technique to ascertain the interests of the debating parties. This approach presumes that 1) the survey method in terms of perceived values and results of behavior is adequate at eliciting the interests of the parties, 2) that people will behave predictably in the negotiation according to these elicited values, and 3) that information presented in the SDSS will promote a change in the values equally among all of the parties. The first assumption may be less than obvious, but the third is the most problematic. If opposing sides of a debate bring divergent values, experiences and beliefs to a debate, can one set of information that is interpreted according to these divergent backgrounds bring consensus or even support a common foundation for debate on the issue? It is not clear that representing data or alternative practices in one constant way in a SDSS will change the usable body of knowledge on which the stakeholders in a debate base their interests. The three assumptions underlying the common applications of SDSS limit the flexibility required for the systems to be effective in the typical land use policy environment. This flexibility should include creative but structured methods for eliciting negotiable interests of stakeholders and different representations of data that are effective in actually creating socially agreed upon knowledge for the stakeholders in the debate. For instance, Armstrong (1993) alludes to the latter in mentioning other representations of data such as "delta" maps. The need for these aspects of flexible systems is exemplified in the experience of the New Jersey state planning process. This process included cooperation with local government entities in the development of a statewide growth management plan. This involved trading maps in an attempt to define a common database on which growth management zones could be based. However, the maps from the localities reflected only their negotiating positions. For example, the counties' maps often showed no farmland because counties did not want any farmland preservation policies applied within their jurisdictions. In addition to the 92
noncommunicative aspect of the maps, new maps prepared by the State's GIS did not seem to expand the knowledge or willingness to negotiate of the stakeholders in the state planning debate. The maps consistently elicited the same response, i.e.,"On which side of the line is my house?" This example is useful as a caveat regarding the possible limitations that SDSS must overcome, and combined with the argument presented in this paper points to two areas of research: First, what types of representations of data and alternative solutions of the issue are most effective in communicating information to stakeholders in the debate? These representations may be ones most consistent with the commonsense knowledge of the issues and may be more meaningful to stakeholders in a debate than cartographic representations. Delta maps, while informative, are an expansion of traditional cartographic representations; data visualiza-tion through animation is receiving attention and may be useful for SDSS. Representations could also emulate photographs or other ostensibly natural presentations. It is easy to see how these somewhat trivial examples can be integrated technically into SDSS. Other dramatically different methods of representation may be useful as well. The important question is what type of representations communicate information and expand new knowledge effectively. Second, how can such additional representations or manipulations of the data in the database of the SDSS be used to identify the interests of the stakeholders on which productive negotiation can be based. Related to this question is the question of how alternative representations can be used to enhance the comparison and evolution of interests in the negotiation process. Rather than asking stakeholders to state their priorities explicitly, which depends on their abilities to identify these priorities (more possible for experts in the field than nonexpert members of an impacted community) and the validity of these priorities in expressing interests (it is possible that the priorities represent publicly expressed positions rather than true interests), it may be possible that data can be presented in varying ways that transcend public posturing. For example, in the New Jersey state planning process, rather than including the management areas and their policies in the discussion of the mapped data, presenting information regarding easement purchase programs and programs that have protected farmers' agricultural viability may have established the interests of compensation for the value of their land and the economic viability of their farms as bases for negotiation. The research that I propose to undertake will address these two questions by 1) analyzing a typical land use debate to evaluate the responses to informa-tion introduced into the debate and identify the association between interests and spatial knowledge used in the debate, 2) proposing innovative representa-tion mechanisms that may be more compatible with the commonsense conceptions of issue, and 3) comparing the response to the different representations among stakeholders in the debate to determine whether some are more effective in communicating information than others and whether they can be used to illuminate the stakeholders' interests in the debate. Clearly there are numerous ways to accomplish these tasks, and space restrictions limit the detail of my descriptions here. The first task will entail a content analysis of hearing testimony and other dialogue surrounding the issue. The second task will extend current research in spatial data models and visualization, and the third will involve experiments with subjects involved in the debate. The results will be a clearer understanding of the relationship between the use of spatial information and interests in a debate and an expanded set of methods of representing data to promote greater use of information. These methods can then be included in the suite of tools associated with multiparty SDSS.
93
References Armstrong, M. P. 1993. Perspectives on the Development of Group Decision Support Systems for Locational Problem-Solving. Geographical Systems, 1:69-82. Armstrong, M. P. 1994. Requirements for the Development of GIS-Based Group DecisionSupport Systems. Journal of the American Society for Information Science, 45:669-677. Armstrong, M. P. and Densham, P. J. 1990. Database Organization Strategies for Spatial Decision Support Systems. International Journal of Geographical Information Systems, 4:321. Brown, S., et al. 1994. Linking Multiple Accounts with GIS as Decision Support System to Resolve Forestry/Wildlife Conflicts. Journal of Environmen-al Management, 42:349-364. Densham, P. and Goodchild, M. 1989. Spatial Decision Support Systems: a Research Agenda. Proceedings, GIS/LIS `89. 707-716. Densham, P. and Rushton, G. 1988. Decision Support Systems for Locational Planning in Behavioural Modelling in Geography in Planning, R. Golledge and H. Timmermans (eds). pp. 56-90. Dutton, W. and Kraemer, K. 1985. Modeling as Negotiating: The Political Dynamics of Computer Models in the Policy Process. Norwood: Ablex Publishing Corporation. Fischer, F. and Forester, J. 1993. Editors' Introduction in The Argumentative Turn in Policy Analysis and Planning. F. Fisher and J. Forester (eds.). Durham: Duke University Press. pp. 1 20. Fisher, R. and Ury, W. 1981. Getting to Yes. New York: Penguin Books. Godshcalk, D. R., et al. 1992. Using GIS for Computer-Assisted Dispute Resolution. Photogrammetric Engineering and Remote Sensing, 58:1209-1212. Hajer, M. 1993. Discourse Coalitions and the Institutionalization of Practice: The Case of Acid Rain in Great Britain in The Argumentative Turn in Policy Analysis and Planning. F. Fisher and J. Forester (eds.). Durham: Duke University Press. pp. 43 76. Innes, J. 1988. Effects of Data Requirements on Planning: Case Studies of Environmental Impact Assessment and Community Development Block Grants. Computers, Environment and Urban Systems, 12:7-88. Kuipers, B. 1983. The Cognitive Map: Could It Have Been Any Other Way? In Spatial Orientation: Theory, Research, and Application. H. Pick and L. Acredolo (eds.). New York: Plenum. Maguire, L. A. and Boiney, L. G. 1994. Resolving Environmental Disputes: a Framework Incorporating Decision Analysis and Dispute Resolution Techniques. Journal of Environmental Management, 42:31-48. O'Hare, M. 1987. Improving the Use of Information in Environmental Decision Making. Environmental Impact Assessment Review, 1:229 250. Reprinted in Resolving Locational Conflict. R. Lake (ed.). New Brunswick: Center for Urban Policy Research. pp. 209-231.
94
Rushton, G. 1995. Personal communication. Zwart, P. 1991. Some Indicators to Measure the Impact of LIS in Decision Making. Proceedings of the Annual Conference of the Urban and Regional Information Systems Association, 4:77-89. Biography for Jonathan Gottsegen Jonathan Gottsegen is currently pursuing his Ph.D. in Geography at the University of California, Santa Barbara (UCSB). He is affiliated with the NCGIA as a graduate student researcher and has worked on several projects for the NCGIA including a conceptual data model for Intelligent Transportation Systems, the Global Demography Project and the Alexandria Digital Library. He received a Master's Degree in Regional Planning in 1986 at the University of Pennsylvania where he studied GIS and its use in regional planning. After completing his Master's Degree, Jonathan worked for five years with the Office of State Planning in New Jersey implementing a GIS to support statewide growth management. During his tenure with the State of New Jersey and between his work there and entering the Ph.D. program at UCSB, he taught courses in GIS at the university level and to professional planners and consulted for municipali-ties interested in implementing GIS. Jonathan's Ph.D. research is in the area of the use of spatial information in the development of land use policy. The ultimate objective of his research is to enhance to effective use of GIS and its data in policy-making by improving the tools that GIS offers.
The Use of Collaborative Spatial Decision Support Systems David J. Grimshaw School of Computer Studies, University of Leeds, Leeds LS2 9JT Tel: 0113 233 5467 Email:
[email protected] and Mark Howes, School of Psychology, University of Leeds, Leeds LS2 9JT Introduction This paper provides a position statement on one of the research topics identified by initiative 17, namely, the design and implementation of methods to improve decision-makers' interaction with spatial analysis tools, including modelbase management systems, visualization and display tools, and group-based user interfaces." Within this general area the paper is focused
95
on the development and use of visualisation tools. The paper puts forward a research agenda within this area based on a proposal submitted to the EPSRC in the UK. Business problem definition Managers and business people are frequently overloaded with information. As the information explosion continues, with an increasing number of datasets available, there is a demand for the ,,right information at the right time[[perthousand]]. How can complex datasets, some with built in levels of uncertainty, be transformed into useable information to support managerial decision making? This problem is a key issue for management in all organisations. A more specific formulation of this general problem can be given by way of an example. When an automobile manufacturing company wishes to rationalise its dealer network it has to model the attractiveness of potential and actual locations, taking into account the population characteristics, competition, the road network and other topographic characteristics, and so on. Similar problems, involving retail companies in location decisions, or banks in merger and acquisition deals all share a reliance on modelling complex fuzzy spatial data. These locational aspects of business strategies might include the merger of two distribution networks, the planning of a new distribution network or the optimisation of an existing distribution network. The use of geographical information systems (GIS) and more specifically spatial decision support systems (SDSS), is widespread in industries such as retailing, financial services, and automotive manufacturing. Many commercially available GIS software packages lack the kinds of spatial analysis and modelling required by business users. In cases where the spatial models are developed as a one-off application for a focused business application, feedback from users suggests that they are used less than their potential. How can users benefit from more sophisticated models at a time when the availability and cost of data is exploding rapidly whilst ensuring that greater understanding is derived from the modelling process? The problem is a significant one in terms of the potential benefits to the research users. It has been estimated by Frost and Sullivan (1994) that the growth in worldwide markets for geographical information systems will grow to US$3.8 billion by 1999 - a compound growth rate of 21% per annum. At the level of the individual firm, or local economy the impact of locational decision making, for example the estimated benefits of improving the location of a supermarket, is in the order of [[sterling]]30 million. Research background This research proposal explores the above significant business problem by building on the earlier work of the Usable Spatial Information Systems (USIS) project funded by the ESRC and carried out at the University of Loughborough. Examining organisational type, the Loughborough researchers, Davies and Medyckyj-Scott (1993) noted that organisations differed significantly in the suitability of their GIS for their tasks. Commercial organisations, being more recent users of GIS, were thought not to have the functionality and tailored user interfaces that, for instance, utilities had. Spatial interaction models have been used for the past 25 years or so (Wilson 1968). The increased power of modern computer technology has brought these models within the reach of business for the solving of location problems such as how to rationalise a branch network after a merger or acquisition. GIS have offered the basic opportunity to understand where customers live and how long they are prepared to travel. The display of data against a map as ,,wallpaper[[perthousand]] leaves the user with impressionistic information that has to be 96
interpreted by the human brain (Grimshaw 1994). The modelling is done in a ,,black box[[perthousand]] from a user point of view. This research aims to provide users with a visualization of the model. Two parts will be studied: firstly, the observation of users working with existing models, leading to a greater understanding of how people perceive the spatial concepts involved; secondly, developing prototype visualizations of spatial interaction models. Bailey (1994:35) identified that there would be benefits in visualization of these models, for example in terms of identifying outlying flows and examining the fit of the model within the sub-region to identify the possible importance of factors not included in the model. The Scientific Visualization initiative of the US National Science Foundation (NSF) recognised the potential of visual tools being integrated into modelling. Visualization can be used to analyse as well as illustrate spatial information (Buttenfield and Weber 1993). In current GIS environments users run models in background, whilst the map visualization is limited to illustration. There is little opportunity for the user to interact with the map to specify, for example, intuitive constraints. There is a real need for research combining graphical design with empirical testing and evaluation (Buttenfield and Weber, 1993). Examining the cognitive understanding of individual users is a necessary but insufficient base for our research because users are making, or contributing to decision making in groups. Research in the area of decision support systems (DSS) has made a useful distinction between DSS which helps the decision maker sort out their peceptions, beliefs and preferences in order to make a choice after the information gathering stage, and Computer Supported Co-operative Work (CSCW) which supports the communication and implementation stages of the decision making process (French 1992). The idea of ,,Distributed Cognition[[perthousand]] (Dillenburg & Self 1992) acknowledges that group decision making can be supported by tools which allow explicit representation and manipulation (vizualisation) of shared information. Research interest in these problems have been intensified recently. It is clear from the literature that there are visualization technologies available but there needs to be more work on the involvement of users in order to gain a cognitive match, between the users, capabilities and the system display. Goodchild et al (1992) argue that visualization is the key to user participation in the determination of key spatial dependence parameters in models of uncertainty. To date there has been little research into the design of usable GIS visualization (Davies & Medyckyj-Scott 1994). The intention of the proposed research is to bring together a realistic examination of user needs and match these with appropriate visualization tools. Aims and objectives The overall aim is to improve the usability of SDSS by business and industry. This will provide enhanced knowledge about the design of systems taking into account cognitive factors at the individual and group decision making level. The specific objectives are: · To investigate the factors determining usability of SDSS from the point of view of the individual using the technology. We will investigate usability in terms of the concepts of learnability, flexibility and robustness (Dix et al 1993). The measurable output here will be a specification for changes, whilst recognising emerging standards such as IS9241. There will be a contribution to the literature on information systems analysis and design. · To examine the utility of existing SDSS in the organisational context. We will investigate utility in terms of the contribution of geographical factors to the decision making process, the role of the individual user and the utility to the organisation. The measurable output here will be a conceptual model of the decision process. There will be a contribution here to the literature on group decision support systems, and organisational psychology.
97
· To explore how perception of spatial data modelling can be used to improve the design of SDSS by the use of visualization or other appropriate tools. We will investigate perception in terms of the cognitive processes underlying appreciation of the spatial modelling representation. The measurable output here will be a specification for changes to the systems design. There will be a contribution here to the literature on the cognitive psychology of pattern recognition and spatial modelling. · To determine the cognitive constraints in designing SDSS. We will investigate cognitive constraints in terms of handling information processing load and facilitation of selective focusing on key data features. The measurable output here will be recommendations for spatial modelling representations. There will be a contribution here to the literature on human computer interaction with SDSS. Research questions In order to reach the above objectives some information on the current practice of organisations is needed. The questions below are meant to be illustrative rather than comprehensive. The order of these research questions is seen as significant, reflecting a progressive probing of the questions surrounding task orientation, task representation, prototyping and cognitive load. · What are the factors that determine usability of spatial decision support systems? · How are SDSS's currently used? · What uses are made of SDSS according to a task taxonomy? · What are the usability factors beyond the user interface issues? · How do users perceive spatial data models? · How is the quality of data perceived by the user? · What is the user understanding of data presented in choropleth maps and cartograms? · How can visualization be used to improve spatial decision support systems? · What are the principles upon which visualization tools can be developed? · Which existing visualization tools may be employed in the SDSS context? · What are the constraints, imposed by cognition, in designing SDSS? · What are the constraints that operate at the individual level? · What are the constraints that operate at the group level? Research design The choice of research approach is an important issue which must be determined by the object of the research rather than the ,,house style[[perthousand]] of the institution or the norms of the contributory disciplines (Galliers 1992). Given the focus of the research on improving the design of the systems, a traditional research design from the Information Systems perspective might have taken a technically oriented view. From a Psychology point of view much cognitive science has concentrated on the perceptions of the individual. We take the view that information systems must be viewed within a socio-technical perspective. Key influences on the use of systems are interpretation and power (Hirschheim and Klien 1992). To properly understand the role of the technology within the organisation we need to take a process view (Scarbrough and Lannon 1988). Information systems in general and decision support systems in particular need to be understood in the context of the organisation and group decision making.
98
Hence our research design must be influenced by organisational psychology, information systems, and computing methods. Our business partner for this research is GMAP Ltd., a University of Leeds owned company providing spatial decision support systems to banks, building societies, motor vehicle manufacturers and retail groups. GMAP will provide access to client organisations, software, data, staff, and other resources necessary to ensure a satisfactory completion of the project At a fundamental level the systems we are proposing to study enable decision makers to attribute meaning to data. Perceptions and meanings in the context we wish to study are problematical. As business organisations face a continuingly changing uncertain environment, they have to rethink the meanings attributed to their world (Checkland 1988). Thus a process approach, using prototyping to provide feedback to the end users, is proposed. References Bailey, T.C. (1994) Review of Statistical Spatial Analysis in GIS, in: Fotheringham, S. and Rogerson, P. (Eds.) Spatial Analysis and GIS, Taylor & Francis, London, 13-44. Batty, M. & Xie, Y. (1994) Modelling Inside GIS: Part 1. Model Structures, Exploratory Spatial Data Analysis and Aggregation, International Journal of Geographical Information Systems, Vol.8, No.3, 291-307. Bevan, N., Kirakowski, J. and Maissel, J., (1991) What is Usability? in: Bullinger, H.J. (ed.) Human Aspects in Computing: Design and Use of Interactive Systems and Work with Terminals, Elsevier, Amsterdam, 651-655. Buttenfield, B.P. & Weber, C.R. (1993) Visualization and Hypermedia in Geographical Information Systems, in: Medyckyj-Scott, D. & Hearnshaw, H.M (Eds) (1993) Human Factors in Geographical Information Systems, Belhaven Press, London, 136-147. Checkland, P. (1988) Information Systems and Systems Thinking: Time to Unite? International Journal of Information Management, Vol.8, No.4, 239-248. Davies, C. & Medyckyj-Scott, D. (1993) The USIS Project: Surveying User Opinion on GIS User Interfaces, Proceedings of the Fourth European Conference on Geographical Information Systems, 29 March - 1 April, Genoa, EGIS Foundation, Amsterdam, 476-483. Davies, C. & Medyckyj-Scott, D. (1994) The Importance of Human Factors, in: Hearnshaw, H.M. & Unwin, D.J. (Eds.) (1994) Visualization in Geographical Information Systems, Wiley & Sons, Chichester, 189-192. Dillenburg, P. & Self, J.A. (1992) A Computational Approach to Socially Distributed Cognition: Interaction Learning Situations with Computers, European Journal of Psychology of Education, Vol.7, No.4, 353-372. Dix, A., Finlay, J. Abowd, G. & Beale, R. (1993) Human Computer Interaction, Prentice Hall, London. Frank, A.U. & Mark, D.M. (1991) Language Issues for GIS, in: Geographical Information Systems, Vol. 1, Maguire, D.J. Goodchild, M.F. & Rhind, D.W. (Eds.), Longman, Harlow, 147-163.
99
French, S. (1992) Strategic Decision Analysis and Group Decision Support, in: P. Dewilde & J. Vandewalle, (Eds.) Computer Systems and Software Engineering, Kluwer, Dordrecht, 217230. Frost & Sullivan, (1994) Geographical Information Systems, Report 863-70, Frost & Sullivan, Mountain View, California. Galliers, R.D. (1992) Choosing Information Systems Research Approaches, in: Information Systems Research: Issues, Methods and Practical Guidelines, Robert Galliers (Ed.) Blackwell Scientific, Oxford, 144-162. Goodchild, M.F. Chih-Chang, L. & Leung, Y. (1994) Visualizing Fuzzy Maps, in: Hearnshaw, H.M. & Unwin, D.J. (Eds.) (1994) Visualization in Geographical Information Systems, Wiley & Sons, Chichester, 158-167. Goodchild, M.F. Sun, G. & Yang, S. (1992) Development and Test of an Error Model for Categorical Data, International Journal of Geographic Information Systems, Vol.6, No.2, 87104. Gould, P. & White, R. (1986) Mental Maps, Second Edition, Routledge, London. Grimshaw, D.J. (1994) Bringing Geographical Information Systems into Business, Longman, Harlow. Haining, R. (1994) Designing Spatial Data Analysis Modules for Geographical Information Systems, in: Fotheringham, S. and Rogerson, P. (Eds.) Spatial Analysis and GIS, Taylor & Francis, London, 45-64. Hirschheim, R. & Klien, H.K. (1992) A Research Agenda for Future Information Systems Development Methodologies, in: Challenges and Strategies for Research in Systems Development, W.W. Cotterman & J.A. Senn (Eds.) John Wiley & Sons, Chichester, 235-255. Mark, D.M. & Frank, A.U. (1992) User Interfaces for Geographic Information Systems: Report on the Specialist Meeting, NCGIA Report 92-3, National Center for Geographic Information and Analysis, SUNY at Buffalo, New York. Monmonier, M.S. (1991) How to Lie with Maps, University of Chicago Press, Chicago. Scarbrough, H. & Lannon, R. (1988) The Successful Exploitation of New Technology in Banking, Journal of General Management, Vol.13, 38-51. Weibel, W.R. & Buttenfield, B.P. (1992) Improvement of GIS Graphics for Analysis and Decision-Making, International Journal of Geographic Information Systems, Vol.6, No.3, 223245. Wilson, A.G. (1968) Inter-Regional Commodity Flows: Entropy Maximising Approaches, Centre for Environmental Studies, Working Paper 19, London. RŽsumŽ David Grimshaw is Senior Lecturer in Information Systems at the University of Leeds. Previously at Warwick Business School, University of Warwick. Current research interests include the use of geographical information by business and industry. He is author of Bringing
100
GIS into Business, published by Longman and has published many papers in academic journals and the professional press. A contributor to many international conferences, David was on the Steering Committee for the First European Conference on GIS in Business held in Amsterdam, 1994. He is a Founding Member of the AGI Special Interest Group on GIS in Business, a member of the GIS Panel of the Royal Town Planning Institute and was recently appointed to a Government Advisory Panel on national land use databases. David has wide teaching experience, with undergraduates, post-experience and executive programmes. He has also taught in Australia, Hong Kong, Malaysia, Portugal, Russia and Singapore. He has been Visiting Fellow at Curtin University, Australia and the National Center for Geographic Information and Analysis, State University of New York at Buffalo. Currently Visiting Professor at the International Management School, St.Petersburg and at the Universiti Utara Malaysia. As an independent consultant David has advised many companies on strategic information systems planning and on geographical information systems. RŽsumŽ Mark Howes is Senior Lecturer in Cognitive Psychology, School of Psychology, University of Leeds. Previously Researcher at Manchester Business School, Demonstrator at University of Liverpool, and Lecturer at University of Leeds. Research experience - 10 years Applied Cognitive Psychological research in Human-Computer Interaction, predominantly in medical applications, in collaboration with applications users and commercial systems producers. Research grants totalling over half million pounds, mainly from EU medical and health programmes, but also from ESPRIT and VALUE programmes, Research Council and commercial sources.
Complexity in Collaborative Spatial Decision-Making Britton Harris University of Pennsylvania April 1995 In this discussion I will replace "decision-making" with the term "planning". The idea of planning has strong spatial connotations, and implies a kind of thoughtful premeditation which precludes any abrupt and precipitate rush to conclusions. In government, business, and military affairs planning is more deliberate and enjoys more careful consideration than decision-making in the field of battle. The closer that decision is to action, the less it is apt to be well-served by collaboration. Collaborative efforts serve a number of purposes. They seek to accommodate different interests by including them in the decision process; this may lead to contention rather than cooperation. They seek through consensus to bind diverse parties (often subordinates) to an agreed conclusion. They seek through collective review to avoid egregious mistakes. Most of the gains which I will consider involve capturing from diverse participants the benefits of wider experience and varied personalities and outlooks. These benefits include improved
101
definitions of goals and their measurement, better knowledge of existing conditions, more correct estimation of the relationships and behaviors which will influence the evolution of the system being planned, and different images of possible future actions and desired arrangements. The need to define goals, conditions, behaviors, and alternatives thus influences the design of decision support systems. By definition, if the effort is collaborative, the support system cannot already contain satisfactory definitions of all these factors--else there would be no gain from collaboration. The closest that a support system can approach to replacing the collaboration is in providing a good information base about current conditions, including resources. Even this will be subject to criticism by participants in the collaboration, on grounds of insufficiency, inaccuracy, lack of detail, and so on. Goals for planning imply purpose, but in general a computer system cannot be purposeful, normative, or prescriptive. If it is, its usefulness is confined to those groups which share the built-in set of purposes. (Optimizing models present the difficulty that the objectives or goals may be hidden, or may be manifestly be too narrow to correspond with the goals of the users, or may diverge from them.) Behaviors are poorly represented in pure information systems, and perhaps rightly so. For example, future information about environmental or river-basin conditions is founded only in part on geographic information, but also on physical, chemical, biological, and meteorological relationships, and on assumed social behaviors which impact the future. The geographic information base is more or less factually accurate. The relationships used to predict the future evolution of the system are built into some model, with a certain debatable level of scientific validity. The behaviors of businesses and families which impact the system through their proximate effects are based on other models or mental presumptions which are even more open to debate than the models of natural process. Alternative ideas about problem solutions and decisions affecting the future are quite clearly beyond the scope of information systems, and may be very difficult to generate through support systems. One established approach is through optimization; however, methods for this do not usually generate alternatives, but single solutions. There are other and more serious difficulties in conventional views of finding alternatives which will appear later. The Pressure of Time Decisions must be taken and plans adopted in a timely fashion; otherwise opportunities are lost, conditions change, and the work devoted to clarifying and supporting the decision and planning process is wasted. Collaboration cannot be maintained in the absence of results, in the face of escalating demands for resources, and under the pressure of growing differences in participants' views of the appropriate planning procedures. This pressure of time is exerted in part through the organization of the collaborative planning process. This governs the means by which the collaborators keep in touch with each other, the methods which are used to accept as input the queries and contributions of the participants, and the response of the support system itself. All of these factors affect the design of decision or planning support systems. If we imagine an intense planning or decision exploration proceeding in a collaborative fashion, I would anticipate that the most frequent interchanges would revolve around a series of "what
102
if" questions--like "what if we did it this way?", "what if you got an entirely different reaction to this investment?", or "what if the national economic environment moves in an entirely different direction?". Looking at questions of this type suggests that we must go beyond simple and possibly superficial manipulations of geographic information, and think about simulating the responses and later development of a system under the stimulus of different decisions, different behaviors, and different socio-economic environments. We know that many computations in geographic information systems are extremely computationally intensive, and it should be apparent that extensive simulations of large spatially distributed systems are even more so. (Weather prediction is a standard example, and a convincing one.) A recent paper (Hodgson et al., 1995) provides a rare example of the discussion of this computational complexity. Somewhat indirectly, the authors address the problem that many commercially available GIS systems seem to operate very slowly, and that in discussions of accuracy in geographic data, the computational burden of accuracy is rarely considered. Their examples deal with mapping problems, analysis methods, and a few simulations of natural systems. There is a report (with no diagnosis) of an environmental impact analysis which required eight weeks under ArcInfo on an IBM server. Reconstructing their implicit argument, we find a number of fairly straightforward considerations. Fine temporal disaggregation implies numerous repetitive simulations. Hourly rather than daily intervals require more steps; there are almost nine thousand hours in a year, and almost 90 thousand seconds in a day. Similarly, fine spatial data is much more voluminous than coarse, in proportion to the square of the ratio of linear dimensions; a digital elevation grid has a thousand times as many cells at 30 m. resolution as at 1 km. Many geographic operations require something like the square of the number of cells; the fine scale grid would require a million times as many operations for geographic interpolation by brute force as the coarser grid, and so also would calculating intervisibility. The second example is not mentioned in the paper; the first and the amelioration of its difficulty are discussed in some detail. The effects of authors' improvements in the process of spatial interpolation are extremely significant. One such problem required 33.6 hours using a brute force algorithm on a Sparc 5 workstation. Using an IBM SP2 parallel computer, running time on several problems was reduced in proportion to the number of "nodes", or processors engaged, up to ten. (One processor on this machine was from 1.5 to 3 times as fast as the Sparc 5 workstation.) The use of improved algorithms was even more significant. ArcInfo uses an algorithm which is twice as fast as brute force, but the authors devised a new one which is another thousand times faster. (The discussion does not scale this gain in relation to the problem size.) The combined effect of these approaches was to reduce running time to 4.4 seconds on the IBM machine, an improvement by a remarkable factor of about 30,000. Some of these lessons can be extended to planning support systems which use simulations, and a review of the sources of computational complexity in these simulations will reveal some of the possibilities of additional future research to ameliorate them. This, then, is the topic of the next, and the main, part of this argument. Complexity in System Simulation I am most familiar with the simulation of urban systems for purposes of planning and management. Therefore I will first discuss some of the characteristics of urban system simulation, and then try to put the deployment of these simulations in the context of decisionmaking.
103
Urban systems are the complexes in which we see the life and interaction of their populations (people, households, social organizations and businesses) with each other and with the natural environment, most often through the means of the man-made environment (including buildings for homes, workplaces, and other purposes, means of travel and communication, and amenities and services like parks, schools, and fire protection). These land uses and interactions are governed and facilitated by customs, laws, private regulations and agreements, and public taxes and disbursements. For purposes of assessing the outcomes of possible decisions, public and private planners want to simulate the hypothetical impacts of these arrangements as they are modified and evolve, on the conditions living, working, learning, and relaxing, and on the interactions which the activities require and engender. Like the two examples of geographic transformations given above, these interactions in the urban system do not depend on contiguity or narrowly defined proximity. For example, we need to explore, under varying conditions, the transformation of geographic distributions of households, workers, and income at home into new distributions of employees at work-places, students at schools, and shoppers at stores. These and other interactions are not independent of each other, and models are required which jointly consider all of them. Transport networks need to be specified and the interactions need to respond to the state of the transport system, which in turn responds to the demands made upon it. All of this has several elementary impacts on the relation of these simulations to geographic information, and thus also to GIS. The amount of geographic information required is very large, and requires systematic storage. Much of the information is collected on the basis of census units, and can only in very few cases be easily related to the kind of raster system which is use for studying natural phenomena; the use of vector systems with their burdens in computational loads and data structures predominates. High speed computations will be essential in any event, and this implies that such simulation systems can at best be called by GIS, but need their own data structures and independence for uninterrupted operation. These ideas can be extended slightly. Much urban data is located with respect to governmentally determined units, and units defined by improvements or geographic features such as roads, watercourses, and ridge lines. Such units include blocks, zip code areas, and civil jurisdictions. Streets, highways, rail lines, and structures are relatively permanent. The use of simulation and information jointly by many agencies, organizations, and the public is an ongoing process which requires continuity. All this implies that the simulation process requires a fixed area system, perhaps hierarchically disaggregated. This system should be organized and if necessary modified with the use of a GIS, which should update its data periodically, and which should be able to map and otherwise present the intermediate and final results of simulations. Now as to the computations themselves: here the same conclusions apply as in purely geographic computations. Finer disaggregation should produce better results at higher computational cost. There are, however, limits to this fineness, and some doubts as to it ultimate desirability. Some disaggregations are barred for reasons of privacy. Others may be observed and reported, but not easily predicted for the future. For instance some impact of religious affiliation on locational behavior may exist, but its use is ruled out (except in very special studies) by both of these considerations. Very fine disaggregation by areas may introduce data for which errors have not been reduced by the laws of large numbers. There is the possibility of further disaggregation by subsystems within the urban system. Such subsystems are the labor market, the housing market, the land market (which includes vacant land taken up for housing), the transport system, and many utilities and services. All of these systems influence each other by a variety of mechanisms, and these influences then feed back into their own functions. Intensifying or abating the calculation of interactions among 104
functional systems can influence the scale of computation by a factor of up to a hundred. It also influences the possibilities for parallel computing. Different subsystems may require different areal disaggregation for different purposes. Transport as the main object of analysis may require more detail than transport in a residential location analysis. Residential analysis may require some kind of fine-scale disaggregation for residential areas, but with larger scale employment disaggregation, and vice versa for industrial analysis. So far, all of these considerations fit into the earlier analysis of geographic computation. There is a great deal of room for new algorithms, but finding them depends on computer experts understanding the problems of spatial planning more intimately, and on spatial planners learning more about algorithmic thinking. Parallel computing may soon be achievable through networking among numerous coordinated PCs, but this (and to an extent other parallelism) depends on how far the simulation can be broken into independent parcels. The new algorithm for spatial interpolation discussed above was made possible in part by a strong element of proximity which does not have the same force in major aspects of the urban system. Parallel computation, in the present state of the art and particularly using networked computers, depends on my view on the decomposability of the urban system into subsystems for computational purposes. There is, however, one overwhelmingly important aspect of the complexity of spatial decision-making and planning which remains to be discussed. Ordinarily, spatial planning deals with numerous spatial decisions whose impacts are not mutually independent. The value of one change depends on the effects of others which may or may not be considered at the same time. This leads to a combinatorial problem which is virtually insoluble in any formal sense. A set of twenty possible binary decisions generates over a million possible combinations. If the computation for one combination took as long as the environmental impact study mentioned above, we would still be computing well into the next ice age and beyond, before we had examined all combinations. There are ways to reduce this difficulty, but not to eliminate it entirely, and currently the best approaches depend in large part on the organization of the planning process itself. This is the point at which we should consider how the design of an interactive and collaborative system can influence that process. It is at best a process which seeks the answers to a very large number of "what-if" questions. A vigorous collaborative process can refine and structure the nature of these questions through the use of collective imagination and experience. But the vigor of this search for good courses of action will flag if the answer to every question takes eight weeks, eight days, or even eight hours. Ideally, such questions should be answerable at speed (say within eight minutes) in the course of a brainstorming session or a public hearing, and the results should be presented in a way which is complete and intelligible. I believe, on the basis of the earlier discussion, and of my own experience, that these possibilities are now within reach, as to the simulations themselves. An open and accessible system along the lines I have outlined here and elsewhere will facilitate much more experiment and research, and begin to answer some open questions as well as to pose new ones. The open question of collaborative group procedures, which is another whole arena beyond computation, presents a deeper and more complex set of issues. We cannot begin to approach them without more instruments, which include systems of the kind we are discussing, but also greater understanding of computational optimization and human creativity, and their interrelationships.
105
Reference Hodgson, M E, Yang Chen, P Coleman and R Durfee, 1995, "Computational GIS Burdens", in Geo Info Systems 5, 4 pp 28-37.
Collaborative exploration of spatial problems Paul Hendriks Dirk Vriens University of Nijmegen Business School Email address:
[email protected] The complexity of spatial problems Spatial problems are usually complex problems. If we are to offer adequate support to deal with spatial problems, we have to get to grips with the nature of their complexity. There are a number of elements that contribute to this complexity. The first is the relation between problems and their solution space: getting a sufficient understanding of both the problem space and the associated solution space may suffer from what we might call a 'technical' complexity. It may, for instance, be unclear which criteria are relevant, how these are to be combined, what measures are feasible and what their results may be, how alternative solutions may be scaled as more or less preferable, etcetera. A second source of complexity is introduced when more than one goal is associated with the problem. This will lead to the competitive existence of more than one problem space and more than one solution space at the same time. A next element to be considered is the fact that goals can be stated at various levels of abstraction, in the sense that every solution may be seen as a problem at a lower level of abstraction, and every problem may be seen as an alternative solution at a higher level of abstraction. The situation is further confused by what might be called the social context of problems: the existence of different and possibly conflicting goals is usually associated with the existence of different parties, with different interests, different positions with varying degrees of power within the decision making process, different access to information sources, etcetera. Finally, a fifth complication is made up by the fact that goals may vary over time as may our understanding of alternative solutions, thereby causing a shift in the problems to be solved as well as their solutions. An example of a spatial decision problem borrowed from Reitsma & Behrens (1991) may help clarify these various, what might be called, 'domains of complexity'. The example describes the case of river basin management in the western part of the United States. A multi-faceted setting for water management is defined here by the great variety of factors at play, such as shortage of water supply, the occurrence of flooding, the use of water for such widely diverging purposes as power generation and rafting. Many of the management problems involved fall within the first category, for instance perceiving which technical measures may help control the water flow and what effects they will have: what (and when) is the effect of closing or opening dams up the river for the downstream area, how do effects of measures at individual dams combine, etcetera. The situation is complicated by the fact that apart from water control to prevent floods, the waters also have to be managed for the generation of hydropower, meeting urban and rural demands for water, maintaining an economic viability in fish hatcheries, etcetera (second source of complexity identified before).
106
In the third place we may identify these goals and objectives at various levels of abstraction. For instance: the use of water as a source of power cannot be studied in isolation, but should be related to the fact that the overall goal of power supply can also be attained from alternative sources, and that the more abstract goal of power generation may have competitors (for instance: energy saving) for its own higher order goals. In the fourth place, the decision process in the case of river basin management is, as Reitsma & Behrens (1991, p.33) explain, not something that can be easily pinpointed to a number of clearly identifiable meetings in some management office. There are many parties involved, including local and federal government, environmental pressure groups, individual consumers and consumer groups, firms, etcetera, all spread out over a wide decision network with more or less clearly identifiable cross links. A final complication stems from the fact that neither these parties, nor their goals remain stable over time, thereby making the river basin management problem a highly dynamic one. The case for collaborative decision support The case of river basis management is clearly a case in which a group decision support tool may prove fruitful: the complexity of the situation consists among other things in the presence of various interest groups. It will be clear that when looking for tools to support such a complex process of decision making from the multi-party perspective, our main concern should not focus mainly on ways to improve cooperation, but to address the various sources of complexity at the same time. If we fail to do so, and if we instead concentrate on solving the complexities of only one source (for instance the 'technical' source) for the various parties involved, we run the risk of providing the right solutions for the wrong problems. The question may then be asked what the goal is of designing tools in the give situation. Three alternatives have been discerned (Reitsma & Behrens, 1991, p.34): 1. aim at solving the problems, that is design tools in such a way that they will allow the decision makers (DMs) to relate problems to solutions; this approach is, for instance, taken when models (such as MCA) are made available to the DMs; underlying assumption is then that the use of these models, for instance by allowing variations of the model parameters, may then prove helpful to the DMs to find their way through the solution space; 2. aim at satisfying the participants, for instance by exploring ways to reach consensus with other parties involved about alternative solution paths; this second alternative may build on the first, for instance by providing means for participants to have their individual modeling outcomes combined with these of other participants; 3. build the group decision support system as an information generating tool that will help participants to gain more insight into how the proposed decisions will affect their own particular situation. Reitsma & Behrens identify this as 'the informative GDSS'. Common to these approaches is that, to a different degree, they all converge around problem solutions. The paper tries to elaborate a fourth approach, an approach that concentrates on problem exploration instead. Basic idea is that the combination of different sources of complexity as sketched before should be integrated and addressed by the DM as much as possible. Before thinking in terms of alternative solutions to these various aspects of complexity, it is seen as essential to explore the nature of complexity of the problem at hand as widely as possible. The approach therefore shares with the third alternative described before (the informative GDSS) the concern not to strive for consensus too soon, it differs from this approach mainly by its problem orientation rather than solution orientation.
107
A formal basis in systems theory Key issue in a collaborative problem exploration approach is finding a formal representation that will allow all sources of complexity to be represented. In a recent paper (Vriens & Hendriks, 1995) we have indicated that the theory of adaptive systems may serve as a basis that will allow the introduction of dynamic aspects (the fifth source of complexity as described before). An adaptive system is basically a system that can show behaviour aiming at "maintaining the essential variables within [...] limits" (Ashby, 1960, p.58). Systems theory offers the tools to provide a general model for problem situations, both at the conceptual level and at the level of an actual tool to be used to model all relevant aspects. When put in systemic terms, a problem can be said to occur when a system, in the cybernetic sense, does not manage to keep its essential variables within certain limits. At this stage it becomes vital for the system to adapt in order to reach a new state of equilibrium. In order to do so a match has to be found between the variety of the environment causing the problem situation and the variety of possible actions. Here the GDSS comes into play, as it is conceived here as a means to relate as many alternative actions as possible to the perceived goals (a more elaborate description of adaptive systems and how they help address the various sources of complexity shall be given in the proposed contribution). In that paper, however, we did not address the social context of decision making, that is the explicit recognition of the fact that conflicting goals are usually linked to opposing parties in the decision process. There are basically two alternative ways to do so: the first is to introduce a model of the opposing goals into the "single explorer" situation, the second is to model every distinct goal situation as a system in its own right and establish conflicts and overlaps between these individual situations in terms of the actions conceived within each of them. In the contribution this second approach will be elaborated, as it is superior in terms of allowing individual parties to explore their own problem space independently, and identify conflicts and overlaps with other problem spaces as a separate step. Central in the approach is its focus on actions that are feasible within each individual context and the fact that it stimulates the participants to come up with as many alternative actions as they can conceive. The task of the CSDM-tool is both to help participants define their private problem spaces, and to suggest matches between the exploration outcomes of participants with interests that appeared as opposite, as well as to identify situations where no such match has yet been reached. It should be stressed that in the approach as advocated the focus is not on finding consensus or starting negotiations, but on as wide a problem exploration as possible, in order to better the chances for overlaps in actions. A simple example may help clarify this: imagine two people wanting to go to the movies together but having different preferences as to which movie to pick. It may be suggested to each of them to contemplate on what they hope to gain by going to this specific movie, and the outcome for both parties may be something like 'recreation and relaxation'. It may then be suggested to them to seek for alternative ways to satisfy this objective, and at the end of the process we may see them going out to dinner and live happily ever after. Another - classical example given by Ackoff illustrates the same point: in a multi-storied office building firms occupying the upper floors complained of the long waiting time for the elevators, and three lines of action were suggested to solve the problem. The first was to introduce a computer system to manage the, what we might call, ups and downs of the elevators more intelligently (a sort of decision support tool, though not a collaborative one), the second to increase the number of elevators, and the third to reserve certain elevators for the higher floors. None of these appeared to solve the problem, complaints persisted. These, however, stopped when someone came up with the idea to put mirrors up in the elevator hall, giving the persons waiting the opportunity to check their ties and make-up, and to spy on their fellow waiters. Problem solved. The waiting time in terms of minutes and seconds had not changed, but its perception had. As in the previous example, a creative problem exploration not aimed at consensus but at as wide an search for feasible actions as possible, proved to be far more rewarding than a conventional problem- solution centered approach. Our elaboration of adapted systems theory with collaborative elements may be seen as an attempt to provide this 108
creative problem exploration process with the formal basis necessary for defining collaborative decision tools. References Ashby, W.R. (1960) Design for a Brain. London: Chapman and Hall. Reitsma, R.F. & Behrend, J.S. (1991) Integrated river basin management: a decision support approach; in: Klosterman, R.E. (ed.) Second International Conference on Computers in Urban Planning and Urban Management, Proceedings; Oxford, July 1991; pp.29-41. Schrage, M. (1990) Shared minds: the new technologies of collaboration; New York: Random House. Vriens, D. & Hendriks, P.H.J. (1995) How to define problems: a systemic approach; in: Timmermans, H. (ed.) Decision support systems in architecture and urban planning; London: Chapman & Hall (in press).
Collaborative Spatial Decision Making Research Initiative Position Statement Lewis D. Hopkins University of Illinois at Urbana-Champaign May 29, 1995 Two areas of research would yield significant advances in collaborative spatial decision support systems: 1. Devise and test interface concepts (patterns of human computer interaction) that successfully combine representations of the substance of a problem and the processes of its exploration, particularly when multiple participants hold different concepts of the problem and play different roles in the process. 2. Consider how group processes that in practice are combinations of pure forms of group problem solving--that is, parallel processing, nominal group, collaboration, conflict resolution, voting--can be usefully, validly, and ethically supported as jointly occurring in the same interactions. Interface Design We have recently developed interfaces that attempt to provide both information about problem exploration processes and information about substantive solution alternatives. From a process perspective, a user should be able "do your own thing" without getting lost and without misusing any of the computer support tools through loss of validity arising from the exploration process. From the substantive perspective, a user should be able to keep track of a current alternative, previously devised good alternatives, and previously rejected alternatives, preferably at multiple levels of abstraction or completeness. Knowledge of alternatives includes not only knowledge of their structure, which is essential in considering how this 109
structure might be changed, but also knowledge of their performance. This implies "maps" of process," maps" of alternatives, and "maps" of performance. We concur with Rasmussen et al (1994, p. 174) that "...maps support navigation in a work space more effectively than do route instructions." Our maps have taken on quite different forms, however, from theirs. Such process-oriented interfaces have been successfully implemented in TRAINER (Johnston et al, 1994). Although we have implemented support of individual users and sessions, which permit individuals to work on problems and return to previous work, we have not yet explicitly addressed the support of collaboration in this system. The following questions arise: How should collaborators interact with a system? with each other? How should the system keep track of this collaboration? For example, can a system keep track of alternatives that have been created by two or more users independently (asynchronously?) working with a system? Or, should the system be designed to interact with the aggregate of a group process rather than individuals within it? Under what circumstances will these different strategies be effective? Should the system presume that the group rejects alternatives or that individuals reject alternatives? Should a system support multiple process views for multiple participants? How should a system move back and forth between synchronous and asynchronous activities? When and what should one participant know about the process activities or the alternatives of another participant? Can the computer help make such decisions? The general approach to interface design that we have developed should be generalizable to the collaborative case, but we will have to experiment with what collaborative patterns and tools are indeed useful. Strong focus on process tends to submerge focus on substance, yet problem exploration by experts is based largely on consideration and manipulation of substantive representations. The addition of process support to keep track of the relationships among computer tasks and human tasks so as to ensure validity must not overwhelm focus on substance. Spatial representations of problems are used in almost all fields, whether the problem is inherently geographical or not. Thus, we should not limit the spatial representation to geographic cross sections. Spatial representations of dynamics and of substantive processes (e.g. bus route loading patterns, urban development, or animal behavior) are likely to be at least as useful in leading to recognition of new means or new alternatives. In collaborative problem exploration, it seems highly likely that a system should support both parallel processing by different members of the group and, at other times, group focus on common alternatives or issues. Can a support system help decide, for example, whether two independently created ecological models for different aspects of an ecosystem, can be validly combined? Can the data pipeline approach we have devised for individual users be generalized to multiple participants? Thus, whatever success we have achieved in representations of both substance and process, must now be tested in collaborative contexts so that appropriate data structures and system designs can be identified for groups of collaborating users. Group processes Group decision making is not necessarily collaborative and seldom purely collaborative. "Collaborative" Spatial Decision Support Systems must not only recognize this, but cannot be successful until we have learned more about how these group processes interact in practice. At one extreme, a team within a private consulting firm charged with developing a recommendation or set of recommendations, may come as close as any situation to pure collaboration. There is usually a project captain who has some authority to move the process forward by making decisions that are not dependent in any direct way on the opinions or attitudes of other team members. Anyone who has worked on such teams, however, knows that there are often egos, arguments, and disagreements to be worked out along the way. At the other extreme is the pure voting model in which, after whatever shared deliberation and
110
individual investigation is conventional to a particular group, each individual casts an equally weighted vote to determine a common choice. In such cases, not only is consideration of multiple decisions (vote trading) one of the standard resolutions of Arrow's impossibility theorem, but deliberation implies interactive and common consideration of alternatives. Other models of conflict resolution beg further consideration of the many "impure" types of group processes. One analytical tool can be used as an example to illustrate this difficulty. Benefit cost analysis is frequently used as a technical tool and as an argument for policy or legislative action. Analysts are well aware, however, that benefit cost analysis not only can be incorrectly implemented (e.g. failure to consider all resources), but also that it can be used in such a way as to make a particular argument. How might we support "collaborative" use of such evaluation tools? We have developed a design for "procedural expertise support" in which the computer support system tracks a user applying benefit cost analysis so as to catch errors in application. (The concept of "procedural expertise" is addressed more fully in Doug Johnston's submission for this conterence.) This is accomplished, for example, by the support system computing benefit cost results by multiple criteria: if net present value and benefit cost ratio do not yield the same results, then some resources have been left unaccounted for. In extending such expertise to collaborative situations, the system must also be able to comprehend differences chosen by different participants to yield different results, including the effects of such things as value measurements, discount rates, and comprehensiveness of measured effects. Such support must thus acknowledge a mixture of collaboration and conflict in the "collaborative" use of such tools. References Johnston, Douglas M.; Hopkins, Lewis D.; Hinrichs, Marilou; Lee, Insung; Kim, Hyong-Bok, Lu, Hsuan-Shih; and Srinivasan, Sumeeta (1994) "TRAINER: A System for Training Requirements Assessment and Integration with Environmental Resources," contract report to U. S. Army Construction Engineering Research Lab by Departments of Urban and Regional Planning and Landscape Architecture, University of Illinois at Urbana-Champaign. Rasmussen, Jens; Pejtersen, Annelise Mark; and Goodstein, L. P. (1994) Cognitive Systems Engineering, New York: John Wiley and Sons, Inc. Biography Lewis D. Hopkins Professor and Head, Department of Urban and Regional Planning University of Illinois at Urbana-Champaign phone: 217-244-5400 907 1/2 West Nevada Fax: 217-244-1717 Urbana, Illinois 61801 email:
[email protected] Education: BA in Architecture (1968), Master of Regional Planning (1970), PhD in City and Regional Planning (1975), all from the University of Pennsylvania. Employment: Assistant Professor Landscape Architecture (1972-1979), Associate Professor (1979-1984) and Professor (1984 -) Landscape Architecture, Environmental Studies, and Urban and Regional Planning, Head of Department of Urban and Regional Planning (1984 - ), all at the University of Illinois at Urbana-Champaign.
111
Research Interests: Human and computer problem exploration processes for incompletely defined spatial problems (spatial decision support systems, planning support systems); Land and water resources information systems (database design, dynamic geographic information systems, geographic modeling systems); Logic of urban planning (efficiency gains over time from land development planning, effects of planning on concurrency of infrastructure with development). Research Funding: National Science Foundation, Illinois Departments of Conservation (over $1 million) and Transportation, Illinois Environmental Protection Agency, U.S. Army Construction Engineering Research Lab (over $1 million) Editorial: Co-editor with Gill-Chin Lim, Journal of Planning Education and Research, (1987 1991), six editorial boards. Selected Publications E. Downey Brill, Jr., John M. Flach, Lewis D. Hopkins, and S. Ranjithan, "MGA: A Decision Support System for Complex, Incompletely Defined Problems," IEEE Transactions on Systems, Man and Cybernetics, 20:4 (1990) pp. 745-757. Douglas M. Johnston, Lewis D. Hopkins, Marilou Hinrichs, Insung Lee, Hyong-Bok Kim, Hsuan-Shih Lu, and Sumeeta Srinivasan, "TRAINER: A System for Training Requirements Assessment and Integration with Environmental Resources," contract report to U. S. Army Construction Engineering Research Lab by Departments of Urban and Regional Planning and Landscape Architecture, University of Illinois at Urbana-Champaign. (1994) 184 pp. Shih-Kung Lai and Lewis D. Hopkins, "Can Decision Makers Express Multiattribute Preferences Using AHP and MUT? An Experiment," Environment and Planning B: Planning and Design, 22 (1995) pp. 21-34. Insung Lee and Lewis D. Hopkins, "Procedural Expertise for Efficient Multiattribute Evaluation: A Procedural Support Strategy for CEA," Journal of Planning Education and Research, forthcoming.
Position Paper for the Initiative 17: Collaborative Spatial Decision Making. Piotr Jankowski Department of Geography University of Idaho Moscow, ID 83843 Many decisions concerning development, planning, and the management of environment are complex issues requiring the cooperation of various involved parties. Examples of such decision situations include habitat restoration and economic redevelopment problems. These types of problems are characterized by a slow decision making process evolving through a series of meetings, many of them public involving multiple stake holders that represent conflicting interests and agendas. The goal of decision making process in these situations is to 112
seek a solution that can provide a compromise acceptable to the majority of stake holders. The information describing various aspects of the problem is the key to finding consensus solution. The effectiveness of information used by group members may directly effect the outcome of decision making process. The relationship between the tools and techniques used for structuring and presenting information about the decision problem and their effect on problem solving and decision making performance of teams was noted in many studies on Group Support Systems (Galegher et al., 1990, Bowers and Benford, 1991, Jessup and Valacich, 1993). Their authors tried to discover if the use of information technologies had any positive impact on the effectiveness of group decision making measured by such indicators as: decision outcome satisfaction and the time it takes a group to converge on the consensus solution. Mixed results were found in regard to the benefits of information technology supporting group decision making. Much of the mixed results were most certainly due to differences in the character of the group, different research methods used, and differences in the information technology being tested. These studies also established two important findings: 1. the larger the group the more effective computer decision support systems are, and 2. due to learning effects, the effectiveness of computer-aided group support grows over time. Many conceptual designs and empirical research questions developed in the field of Group Support Systems can be applied to Spatial Decision Support Systems for Groups (SDSS-G). This is because collaborative non-spatial decision making has similar conceptual characteristics to collaborative spatial decision making. In both cases it is an activity involving a group of people who are jointly responsible for generating possible solutions, evaluating potential solutions, or formulating strategies for implementing solutions (DeSanctis and Gallupe, 1988). The research issues that are more specific to spatial domain are related to the effects of combining tools for structuring and presenting spatial information (maps) with tools for presenting non-spatial information (decision models). The following specific questions/issues may become a part of research agenda in collaborative spatial decision making: · what is a fundamental difference (is there any ?) between non-spatial and spatial decision problems tackled by groups? · what constitutes the set of SDSS-G tools? The common elements of GSS include brainstorming, meeting organization, and consensus building tools. Are there any tools not represented in GSS that should be included in SDSS-G? · Is there a need for multiple criteria decision methods for groups (MCDM-G) or are MCDM too complex to be used in group meeting situations? There is a large number of both non-compensatory and compensatory decision models that can be used for discrete decision problems (small number of alternatives) by an individual decision maker. Researchers have been integrating compensatory models (allowing to trade-off a poor performance of alternative on one criterion for better performance on another criterion) with GIS software to create spatial decision support tools. The compensatory models, however, become burdensome for the user if the number of criteria is large. These models could be replaced by new compensatory MCDM techniques that will be more user friendly, especially in eliciting the criterion trade-offs and decision maker preferences. · New cartographic symbols and map types need to be developed to support collaborative decision making. Some work on the development of maps for collaborative facility location analysis has already been done (Armstrong and Densham, 1995). More work needs to be done on developing symbols and maps that can present group solutions and help in elicitation of trade-offs between decision criteria. The examples of new maps include a pairwise comparison map that could be used to support the elicitation of trade113
offs between criteria pairs, and a vote map which would present the ranking position of each voted alternative. The group support maps may be designed as interactive views combining hypertext, images, sound, and animation. · Integration of interactive maps and MCDM-G. The SDSS-G can include interactive geographic visualization tools integrated with multiple criteria decision models for groups. One such system has been already developed at the Universities of Idaho and Washington. It is comprised of a group decision support module and ArcView-2. The group decision support module provides tools and methods for multiple criteria evaluation of alternatives in private and public modes and it is linked through the dynamic data exchange with the customized application in ArcView-2. Thanks to the dynamic link, the solutions generated in the group decision support module can be visualized in the real time on maps and images developed in ArcView-2. The new solutions update, transparently to the group members, maps such that spatial aspects of different solutions can be compared. Maps in ArcView-2 also facilitate the elicitation of evaluation criterion priorities. The development of such integrated tools presents not only the design and implementation challenges, but more even so an opportunity to explore the basic research question about the dynamics of collaborative spatial decision making supported by the geographic groupware software. · Local vs. distributed (in space and time) collaborative spatial decision making. The collaborative decision making that takes place in a meeting room (local) is currently the most common form of group decision process. Other forms, however, are also possible such as collaborative decision making distributed in space or distributed in space and in time using the existing technologies of videoconferencing and computer networks. The tools for space and time distributed SDSS-G need to be developed, followed by the exploration of the dynamics of distributed collaborative spatial decision making. References Armstrong, M.P., P.J. Densham. 1995. Cartographic Support for Collaborative Spatial Decision-Making. Proceedings of Auto-Carto 12. In press. Bowers, J.M., S.D. Benford (Eds.) 1991. Studies in Computer Supported Cooperative Work Theory, Practice, and Design. New York: North-Holland. DeSanctis, G., R.B. Gallupe. 1988. A Foundation for the Study of Group Decision Support Systems. Management Science. Vol.33, No.5, pp.589-609. Galegher, J., R.E. Kraut, C. Egido. (Eds.) 1990. Intellectual Teamwork: Social and Technological Foundations of Cooperative Work. Hillsdale, N.J.: Lawrence Erlbaum Associates Publishers. Jessup, L.M., J.S. Valacich. 1993. Group Support Systems: New Perspectives. New York: Macmillan Publishing Company. Biographical Note Piotr Jankowski is an Associate Professor in the Department of Geography at University of Idaho. He received his Ph.D. in Geography from University of Washington, in 1989, and M.S. degree in Econometrics and Operations Research from the School of Economics in Poznan, Poland. His current professional activities include teaching and externally funded research in 114
the area of GIS, computer mapping, and collaborative spatial decision support systems. Dr. Jankowski has nine years of experience in the areas of computer mapping and GIS applications, mathematical programming, systems simulation modeling, and multiple criteria decision making methods.
Collaborative Spatial Decision Making Position Paper Douglas M. Johnston University of Illinois at Urbana-Champaign National Center for Supercomputing Applications 4115 Beckman Institute, 405 N. Mathews Avenue Urbana, IL 61801 voice: (217) 244-5995, fax: (217) 244-4568 email:
[email protected] June 1, 1995 Area of research: 1. Development of mechanisms to promote collaborative problem exploration through procedural support and generation of alternative solutions 2. Improvements in computational performance of spatial decision support systems to support collaboration. Collaboration in non-computational environments focus on mechanisms of teams, conferences, and other face-to-face processes. Among the attributes of such environments are effects of immediate communication and feedback, opportunities for rapid generation of ideas, and evaluation. We assume that collaboration in spatial decision support systems should similarly be an interactive process requiring low latency and high levels of communication between human-human and human-computer processes. Barriers to these standards include diverse user requirements for decision making environments and tools, the need for multiple representations and tracking of problem explorations among participants, and delays in communication from computational demands of GIS applications. 1. Collaborative Problem Exploration. We have worked for several years on the development of functioning experimental systems for spatial decision support. These include TRAINER: Training Requirements Assessment and Integration with Environmental Resources, a decision support system for land use allocation on army training lands; PEGASUS - an experimental urban transportation planning environment; RMS: Readiness Management System; a linked GIS - hydrologic/hydraulic model system for planning for flood events; and XCRIS: Cultural Resources Information System), a decision support system for historic and cultural resource management. While not explicitly addressing issues of collaboration, the problem domains from which the applications are drawn are focused in part on the issue of a diverse user community with possibly different stakes in the outcome of the planning process. We have sought to develop an environment for supporting collaboration by reducing dependencies on procedural knowledge of the 115
computational environment, and on supporting the search for collectively acceptable alternatives. The aspect of collaboration we emphasize is one of problem exploration through alternative generation and multicriteria evaluation rather than consensus building or other strategies. The search for good alternatives has been described as "an informed process of trial and error which generates alternatives and prepares them for testing" (Harris and Batty, 1994). Challenging enough, the search is made more difficult particularly when the solution space is enlarged to include multiple participants. The emphasis must be on the "informed". For example, explorations which retrace previously traveled areas must be avoided, as must trivial alternatives. We argue that "traditional" graphical user interface strategies including devices such as menus and dialogs remain inadequate to the task of providing assistance to the user in individual tasks, let alone collaborative tasks, because they simply repackage a set of individual procedures or operations. Instead, we have experimented with the implementation of process focused interfaces in which information flows between system operations and user operations are explicitly managed. Information includes the tracing of histories of explorations by individuals or groups such that users, scenarios, attributes, and alternatives considered, are part of the information flow. (Further examination of this aspect is provided in the submission by Lew Hopkins). In our work on the military land management system TRAINER (Johnston et al., 1994) a fundamental impediment to collaboration between the training community and land managers is the phenomena of anchoring -- specifically land resource allocation decisions based on familiarity with a particular geographic region within a particular time frame. An approach to resolving this effect is to employ it to derive initial solutions, or for comparison with alternatives derived from other means. Part of the role of the interface is to assist in the search for sets of alternatives. For this problem, we have used a framework of a planning process similar to that suggested by Armstrong (1994) and others of strategizing, exploration, and evaluation. We are examining the problem of developing useful strategies for problem exploration. One approach is through the provision of partially substitutable procedures, that is, the user must be able to choose a strategy or model with which to pursue problem exploration. The rationale for this is that systems models may not exist for the intangible or unmodeled criteria that the user wishes to employ in the search for solutions or that the user may wish to test different strategies for generating alternatives. We have employed Modeling to Generate Alternatives (Brill et al., 1982) to support userdriven search for alternatives by creating alternatives which are different in geographic space (and therefore varying in attribute levels) but similar in objective space (nearly equivalent alternatives). We are also testing filtering techniques to select a set of candidate alternatives from large numbers of alternatives generated across a range of attributes. We remain aware of the limitations of modeling approaches to alternative generation and have examined the use of information to trigger human strategies for alternative generation in the context of a bus route design decision support system. These and other strategies must be further examined and tested to provide effective search in a collaborative spatial decision making environment.
116
2. Improvements to performance features of computational GIS to support interaction between participants. In our work we have encountered obstacles to implementation of alternative generation strategies due to computational burdens of spatial search and display of results. To achieve acceptable levels of performance, we are forced to reduce the resolution of our data, reduce the geographic extent of search, or simplify the modeling process (for example, by using model outputs rather than integrating systems models into alternative generation processes). This problem, identified by others as well (e.g. Hodgson, et al, 1995), limits the potential for collaborative environments. If we (reasonably) assume that part of a successful strategy for collaborative GIS includes rapid generation of tentative solutions (e.g. brainstorming) by varying parameter values or heuristics, and evaluations of alternatives against multiple attributes, then latency between initiation of solution strategies and results becomes a very real problem. We are in early stages of initiaing work, in conjunction with the National Center for Supercomputing Applications, on the development of designs for scalable computational environments for modeling of spatial processes. The concept behind scalable computing is to build an infrastructure of computers ranging from workstations to large supercomputers all based on the same CPU and operating system, interconnected through high-speed networks. This design conceivably permits transparent migration of processing tasks from local workstations to GIS servers housed on supercomputers when high performance is required. Related performance concerns involved display of spatial data. Collaboration will require multiple views of data at different temporal and spatial scales. Some models for collaboration (e.g. Shiffer, 1993) involve a conference room design with a common display. Conventional workstation displays have insufficient resolution, scale, and through-put to support the large amounts of displayed information required for collaborative planning. Experimental settings are under development to explore display of spatial data on large scale, high resolution devices based on arrays of display drivers and display devices. While it is clear that such technologies currently lie outside the realm of common application, this work will allow experimentation with different models for collaboration. References Armstrong, M. 1994. Requirements for the Development of GIS-Based Group Decision Support Systems. Journal of the American Society for Information Science, 45(9):669-677. Brill, E.D., S.Y. Chang and L.D. Hopkins. 1982. Modeling to Generate Alternatives: The HSJ Approach and an Illustration Using a Problem in Land Use Planning. Management Science, 25(2): 221-235. Harris, B. and M. Batty. 1993. Locational Models, Geographic Information Systems and Planning Support Systems. Journal of Planning Education and Research 12:184-198. Hodgson, M.E., Y. Cheng, P.Coleman,and R.Durfee. 1995. Computational GIS Burdens. GeoInfo Systems, April, 1995: 29-37. Johnston, D.M., L.D. Hopkins, M. Hinrichs, I. Lee, H-B Kim, H-C Lu, and S. Srinivasan. TRAINER: A System for Training Requirements Assessment and Integration with Environmental Resources, Department of Landscape Architecture, Department of Urban and Regional Planning, University of Illinois Urbana, Illinois (1994) 184 pp.
117
Shiffer, M.J. 1992. Towards a Collaborative Planning System. Environment and Planning B: Planning and Design. 10:709-722. Biography Douglas M. Johnston Associate Professor, Department of Landscape Architecture Director, Geographic Information Systems Laboratory Senior Research Scientist, National Center for Supercomputing Applications 214 Mumford Hall 1301 W. Gregory Drive University of Illinois at Urbana-Champaign Urbana, Illinois 61801
(217) 244-5995 (217) 244-4568 (fax)
[email protected]
Education: B.S., B.L.A.(1979,1980), SUNY College of Environmental Science and Forestry; M.L.A. (1982) Harvad; Ph.D. (1986) University of Washington (Civil Engineering) Selected Publications Johnston, D.M., and R.N. Palmer. "Application of Fuzzy Decision Making: An Evaluation." Civil Engineering Systems. 5(2), (1988). pp. 87-92. Stuebe, M., and D.M. Johnston. "Hydrologic Modeling Using GIS." Water Resources Bulletin. 24(4), (1990) pp. 1-10. Hopkins, L.D. and D.M. Johnston. "Locating Spatially Complex Activities with Symbolic Reasoning." Proceedings of the 4th International Symposium on Spatial Data Handling, (1990) pp.762-771 Frederickson, K. and D.M. Johnston. "A GIS-Hydrologic Model Interface for Flood Prediction and Assessment." (1993) Johnston, D.M., L.D. Hopkins, M. Hinrichs, I. Lee, H-B Kim, H-C Lu, and S. Srinivasan. TRAINER: A System for Training Requirements Assessment and Integration with Environmental Resources, Department of Landscape Architecture, Department of Urban and Regional Planning, University of Illinois Urbana, Illinois (1994) 184 pp. Selected Grants Received 1986-1989 "Illinois Streams InformationSystem (ISIS)." With L.D. Hopkins (Principal Investigator). Illinois Department of Conservation. $100,000 - 200,000 /yr. 1988 "Prototypical Land Condition-Trend Analysis Database System." With David Kovacic. U.S. Army Construction Engineering Research Laboratory. $117,000. 1990-1995 "Development of an Army-Unique Approach to Land Use Allocation Strategies for Training Lands." with Lewis D. Hopkins. U.S. Army Construction Engineering Research Laboratory. $70,000/yr.
118
1991-1992 "Prototype Geographic Regulatory Information Program Development". Principal Investigator. Illinois Environmental Protection Agency. 1991: $48,200, 1992: $46,361. 1992 Develop a Decision Support System for Cultural Resource Management. U.S. Army Construction Engineering Research Lab. Principal Investigator. $59,577 1994 Development of a GIS Interface to the Great Lakes Water Control Data System. U.S. Army Corps of Engineers, Detroit District. In conjunction with the U.S. Army Construction Engineering Research Lab. $50,000 Areas of Research Environmental Planning. Use of spatial and temporal models for assessment and allocation for environmental planning problems. Development of spatial decision support systems, for example for flood management and military land management. Use of geographic information systems to facilitate public education and involvement in social and environmental problems.
Position paper for Initiative 17: Collaborative Spatial Decision-Making Support for Distributed Group Decision-Making Rachel Jones LUTCHI Research Centre Dept. of Computer Studies Loughborough University Loughborough LE11 3TU England, UK Introduction A necessary part of supporting collaborative spatial decision-making is to provide co-workers with access to usable decision-making tools. One of the aims of the work presented in this paper is to provide a group-based user interface to an existing GIS. The group-based user interface is built upon a model of collaboration and a software architecture, which aim to improve decision-makers' interaction with the system. The model enables different aspects of group support to be identified and, as a result, it is possible to distinguish between different collaborative systems that support decision-making. The group-based user interface architecture adopts a novel approach by encompassing a User Interface Management Systems (UIMS), knowledge-based techniques and software agents. In re- using an existing GIS, coworkers are not expected to learn to use a new tool for the purpose of communicating in a group. Further, there are cost- effective benefits to be gained from the software having already been constructed and tested. The model represents a functional model of collaborative support for spatial decision-making, from which practical heuristics can be derived. It is described in terms of a set of entities. The software agents within the group-based user interface architecture support a set of primitives defined by the valid transitions between the states of the entities in the model.
119
The benefits of encompassing a UIMS in the user interface architecture include the possibility of supporting different machine platforms, facilitate the construction of context-sensitive dialogue and the addition of knowledge-based support. Further, by employing knowledgebased techniques, the architecture enables the provision of a higher level interface, that is, one in which the data types and functions presented to the user more closely approximate user tasks than existing application commands. The architecture and a set of development tools have been implemented, and a prototype has been constructed that supports collaborative spatial decision-making. Model The primary entities of collaboration are defined to be: user, application environment and application instance. After applying entity relationship analysis techniques, other entities are discovered, which are: membership ticket, abstract data object and access ticket. The entities are described below. (Jones et al., 1994) gives a full description of the entities, the states of the entities and the valid transitions between those states. A group is defined as several users (one or more) working on a collaborative decision-making task. Each group is supported by an application environment. The environment is used by an individual or shared by a group in order to support the common task. Potentially, the environment can run more than one application instance. An application can provide taskrelated functionality or a shared space, such as audio/ video communications links between users. An application that provides task-related functionality can be shared in real-time or asynchronously. An application needs to run within an application environment in order to be accessible by a group, so even if the application starts with one user, others can join later. Applications that operate outside an application environment influence this work but are not considered a part of it. A user can belong to several groups at the same time and thus participate in several tasks supported by application environments respectively. Since potentially multiple users can belong to multiple application environments, it is necessary to introduce the membership ticket entity. A membership ticket defines a link between a specific user and a specific application environment. It needs both a user and an application environment in order to exist. An application instance is considered to comprise of abstract data objects. Each object belongs to a particular data class: overlay, physical representation, logical representation, functional data or persistent data. · Overlay refers to meta representations made or controlled by a user, such as the pointer position, cursor position and annotations. · Physical representation refers to data as perceived by the user at the workstation. For example, if the workstation operates a windowing environment, the physical representation refers to the window objects used and to the state of the window manager. As a result, a physical representation might consist of a list of options which can be selected and two push buttons, one to confirm and one to cancel the selection, enclosed in a blue/grey bordered window at a specific position on the display. · Logical representation refers to the form that the data can take and the form of interaction provided. It requires a level of abstraction in the presentation of data, sometimes referred to as a virtual terminal. For instance, a logical representation might provide the user with information in the form of a pie-chart or a histogram along with the possibility of removing the information. · Functional data refers to task-related data. 120
· Persistent data refers to the stored data used by an application. Persistent data is commonly stored in master files. An access ticket defines a link between a user and an abstract data object. A user can interact with an abstract data object if there exists an access ticket defining the link. A user can have many access tickets, and, as a result, can interact with many objects. In reality, an access ticket is more than just a token. An access ticket supports techniques to enable concurrency and data consistency, that is, access by multiple users to the same data object. Group-based User Interface Architecture The architecture re-uses existing decision-making tools, while encompassing a UIMS, knowledge-based techniques and agent support for group-work. UIMS require the separation of an application's functional core from its user-interaction subsystem, under the assumption that this approach provides both software engineering advantages (more effective development and improved maintenance) and end-user advantages (user- centred focus of control and user interface consistency) (Myers 1989). The userinteraction subsystem is frequently partitioned into logical components, originally specified in the Seeheim model (Pfaff 1985). The presentation component controls the presentation of information to the user and commonly involves an abstraction of the information from its realisation to the user. The dialogue control component manages the dynamics of the interaction with the user and controls any sequencing. The application interface model is a model of the semantics of the application which can be used for error checking and queries regarding the consequences of actions. A discussion of the merits of a full UIMS over interface builders is contained in (Myers 1993). The group-based user interface implements a derivative of the FOCUS UIMS (Edmonds and McDaid, 1990) which realises the Seeheim model but with a number of extensions. The implementation of the Seeheim model with its extensions broadly include: the integration of an executable task model into the dialogue controller, the re-use of existing systems, and a modular structure with components communicating using a messaging system. Knowledge-based techniques have been applied to task support to provide a higher level interface and context-sensitive dialogue, that is, dialogue which is responsive to the current state of interaction. Further, the performance of semantically nonsensical actions are prevented. The benefits of re-using existing software tools are both personal and cost-effective. Individuals invest time and effort in learning single-user decision-making tools. Naturally, some resistance would be met if a new tool had to be learnt for working in a group. Further, existing software is already constructed and tested; no extra effort is required to provide the same functionality. Software agents provide the group support offered by the user interface. Three agents have been designed and constructed: a user agent, a conference agent and an application agent. The user agent and application agent are located within the architecture as shown below. The conference agent manages the communication between these components. (Edmonds et al., 1994) gives a full description of the agents.
121
Users | Presentation Layer | User Agent | Dialogue Controller | Application Agent | Application Interface | Existing software tool The user agent controls the interaction between a group of users and the software tool. It takes advantage of the abstraction of information into objects for the user in the dialogue controller and the objects realisation in the presentation component of the UIMS. Effectively, the abstract information objects are equivalent to the logical data objects in the model and the realised objects are equivalent to the physical data objects. A presentation component and dialogue controller exists for each user and the user agent distributes the logical data objects between the dialogue controllers and the presentation components. As a result of users having their own presentation component, users are able to view the output on different hardware, running different windowing software and with different representations. The agent supports feedback of other users' activities and supports multiple users interacting at the same time by supporting access control mechanisms. In summary, the user agent supports the following primitives, as defined by the model: create access ticket, remove access ticket and share input. The conference agent supports the facilities necessary to set-up and dismantle a group of users working on a collaborative decision-making task. It enables an application environment to be started and stopped. It enables users to join and leave the environment. It supports the invocation of an existing software tool (or application instance) in the environment and its subsequent termination. It supports the creation and removal of membership tickets. The application agent maintains a record of the interaction with the existing software tool in order that a new user joining the application environment can be brought to the same state. The existing software tools are assumed to contain the functional data objects and to have access to the persistent data objects. Prototype The main aim of the prototype is to demonstrate support for spatial decision-making tasks by providing co-workers, who could be situated in different locations, with access to usable decision-making tools. A group- based user interface has been developed using the model and software architecture. The existing software tool is a GIS, namely GRASS, which is public domain software developed by the U.S. Army (Westervelt, 1991). The prototype provides a shared focus for discussion by way of a public workspace in which graphical data can be visualised and transformed by co-workers. It enables groups of users to become active participants in the decision-making process in a meeting environment.
122
References Edmonds, E.A. and McDaid, E., 1990, An architecture for knowledge- based front-end. Knowledge-Based Systems, 3 (4), 221-224. Edmonds, E.A., Candy, L., Jones, R.M. and Soufi, B., 1994, Support for collaborative design: agents and emergence. Communications of the ACM, 37 (7), 41-47. Jones, R.M., Hinde, C. and Edmonds, E.A. (1994). Modelling collaborative activity. LUTCHI Report 94/K/LUTCHI/0171. Loughborough University of Technology. Myers, B.A., 1989, User-interface tools: introduction and survey. IEEE software, 6 (1), 1523. Myers, B.A., 1993, State of the art in user interface tools. In Advances in Human-Computer Interaction, vol. 4, edited by H.R. Hartson and D. Hix (Norwood, NJ: Ablex Publishing), pp. 110-150. Pfaff, G., 1985, User interface management systems (Berlin: Springer Verlag). Westervelt, J., 1991, Introduction to GRASS 4. GRASS Information Center, U.S. Army CERL, Champaign, Illinois, U.S.. Biography Rachel Jones graduated with a Bachelors honours degree in Physics from Bristol University and a Masters degree in Information Technology from University College, London. She worked in industry for five years before joining LUTCHI Research Centre in 1990. She has undertaken research in human-computer interaction and computer-supported co-operative work, working on projects funded by industry, and both the national and European research funding bodies. In particular, she was the senior researcher on the MUMS project for three years whose objective was to develop and evaluate models and tools to address the shortcomings of current technology in the areas of computer-supported group work and multimedia interaction. The project focused on collaborative spatial decision-making environments. Work on collaborative spatial decision- making environments has continued with funding from a high-speed networking supplier. Relevant publications Edmonds, E.A. & Jones, R.M. (1991). Negotiation Support in Design. In Gero & Sudweeks (editors), Pre-prints of Artificial Intelligence in DesignWorkshop of IJCAI '91, University of Sydney, pp. 93-108. Branki, N.E., Edmonds, E.A. & Jones, R.M. (1993). A study of socially shared cognition in design. Environment and Planning B: Planning and Design, 20, pp. 295-306. Edmonds, E.A., Candy, L., Jones, R.M. and Soufi, B. (1994). Support for collaborative design: agents and emergence. Communications of the ACM, 37 (7), pp. 41-47. Jones, R.M. & Edmonds, E.A. (1994). A framework for negotiation. In Connolly, J.H. & Edmonds, E.A. (editors), CSCW and Artificial Intelligence. Springer-Verlag, London. pp. 1322. ISBN 3-540-19816-4.
123
Jones, R.M., Edmonds, E.A. & Branki, N.E. (1994). An analysis of media integration for spatial planning environments. Environment and Planning B: Planning and Design, 21, pp. 121-133.
Position Paper on Collaborative Spatial Decision-Making Dave Lemberg Department of Geography University of California at Santa Barbara Introduction Spatial decision making generally involves conflict between various interest groups. Any design for a spatial decision support system for use in a group environment should incorporate into its structure, not only the spatial analysis tools to generate feasible alternatives, but also the ability to use these instruments within a context of a process of negotiation and mediation. A GIS is a natural and powerful tool to be used in developing solutions to land-use problems. There is a real danger, however, that such a powerful device may be misused, either through ignorance, or by design. Misuse by ignorance may be remedied through training and through user interface and system design. Misuse by design must be prevented through procedural and methodological checks and balances. This paper will center on the following: 1. The special difficulties of dealing with spatial-locational problems in a public domain. 2. The applicability of principled negotiating techniques to conflict resolution in spatiallocational problems among many interest groups. 3. The advantages and disadvantages of multi-user versus single-user interfaces in Group Spatial Decision Support Systems with regard to use in public meetings on spatiallocational disputes. 4. A list of research questions centering on the development of a set of methods and procedures for a single-user based Group Spatial Decision Support System for problem definition, alternative generation, and negotiation support for spatial-locational problem solution in public meetings. Spatial Problems and Spatial Conflict Spatial problems such as site location, site closure, land-use decisions, boundary adjustments, NIMBY issues, etc., have many common properties that make them difficult to solve. These problems in general are hard to define. What exactly is the problem? What are the spatial and temporal bounds on the problem? Who are the interested parties? To use a spatial metaphor where do we draw the line? This is a real problem. To apply Tobler's First Law of Geography, "All things are related to everything else, but near things are more related than distant things", a spatial issue should effect everyone on Earth. Fortunately, the amount of that relationship is negligible for most of the world's population on any given issue. On the other hand, modern transportation and communications technology have created ever more complex relationships among people and organizations which are extra-local in scope. 124
Such relationships include networks of families, friends, special interest groups, ethnic groups, religious groups, corporations, government organizations, etc., that may communicate by phone, by mail, by e-mail, by electronic bulletin boards, by the printed media, or by television program. The groups may be bound by only one issue or by more complex ties of work, beliefs, or other links. The growing complexity of our society has made it every more difficult to determine exactly who might be effected by a land-use decision, who should be informed of such issues, and who should be invited to take part in public hearings, study groups, and negotiation sessions. The set of spatial-locational problems are also hard to evaluate. Given that the problems involve many parties with many different agendas, how can landowners, developers, preservationists, community groups, government, and other diverse interests negotiate agreements? Each party has its own values and priorities to apply to the issue. Which values does one apply? All of them? None of them? A synthesis of all of the parties involved? Even if one could come to a consensus on a set of values for the interested parties, how would one go about evaluating alternative solutions? How does one measure combinations of material and non-material costs and benefits (fiscal, environmental, aesthetic, etc.)? Conflict is inherent in spatial issues. There is not necessarily and way to settle and issue in terms of right or wrong, or good or bad. Rather, decisions may be imposed from above based on one set of values and priorities (at the expense of those holding to other values and priorities), or decisions may be made by a process of negotiation and compromise by which the interested parties come to some agreement of mutual gain or at least equitable loss. Spatial Problems and Negotiating Techniques In working with spatial-locational problems in a group setting, the type of spatial representation used to define the problem can either exacerbate or alleviate the level of conflict between the parties in the room. A standard "flat paper map" or similar static display on an overhead projector or CRT can create the perception of a "zero-sum game". Information provided by such maps are limited. Changes on such a map can easily be perceived as a win or lose situation. A boundary moves and territory is gained or lost. A GIS can create the perception of a "win-win game" through a more complex representation of space and time. Many layers of information displayed on the same space creates room for negotiation. The impacts and benefits of many facets of a plot of land may be seen, and alternatives and tradeoffs may emerge. Complex problems require complex understanding and creative solutions. Flexible tools are required to better define the problems, illustrate the interests involved, create empathy among the participants, and allow common generation of alternative solutions. One major problem in reaching solutions to spatial problems (land-use, site location, etc.) is positional argument. Arguing over positions ("You can't put a collection center in my neighborhood", "Closing a school is not an option", "All old growth forest must be protected", "We must drill on this location", etc.) can produce negative outcomes. The positions of the parties produce barriers to effective communication, reducing the likelihood of a consensual agreement among the parties. Arguing over positions endangers relationships among the participants. Each party is more likely to gain the perception of a win-lose situation in the dispute and such a decision is more likely to result in a win-lose outcome. Bargaining among parties with solid positions becomes more difficult with many parties involved. It only takes one recalcitrant party to kill any agreement. Fisher and Ury outline four points of principled negotiation. These four points are outlined below, along with my own adaptations of these principles to spatial-locational problems, GIS, and Group Spatial Decision Support Systems (GSDSS):
125
From Fisher and Ury
As Adapted to Spatial Problems
People:
Separate the people from the problem Attack the problem, not each other
Separate the people with the GSDSS Attack the problem on the maps and on the electronic displays)
Interests:
Focus on interests, not positions
Manipulate the maps, not each other
Options:
Generate a variety of alternatives
Simulate a variety of alternatives
Criteria:
Base the result on some objective standard
Base the result on evaluation of impacts (distance, cost, damages, etc.
Multi-user and Single-user Group Spatial Decision Support Systems and SpatialLocational Problems Assuming the need for a GSDSS for use in the negotiating process for spatial-locational disputes, a driving question is what sort of GSDSS interface is best suited to spatial conflict resolution? Two different approaches - the multi-user interface and the single-user interface come to mind. Each have advantages and disadvantages as a base for a GSDSS for a land-use negotiation and mediation tool. Multi-user interfaces for GSDSS's have the major advantage of allowing participation by all members of the public meeting. Such a system allows all parties instant access to information and allows all parties to participate in the alternative generation process. The "hands-on" approach allows all participants to feel that they are part of the decision making process. The disadvantages of a multi-user interface for a GSDSS are centered on equity and on the control required in a negotiation process as opposed to a simple decision making process. Using a multi-user system, experts have advantages over novices in manipulating the system. You are likely to end up with "dueling consultants" representing rich interests against each other, and riding roughshod over any interest group with such resources. Retaining control of a public meeting and mediating a negotiation process among interest groups would become difficult if all parties had uncensored access to an open GSDSS. Opposing sides are likely to distort the representation of the problem to their own positions, making constructive compromise and alternative generation more difficult. It is difficult to control the accuracy of the input data if anyone can enter data into the system. The design and cost of such a system would be expensive in terms of hardware, networking, and software problems (user interfaces and multi-user sharing). The advantage of a single operator system is in the way that the system administrator / operator /mediator team can create the conditions required for a successful negotiating session. The meeting facilitator has control over the meeting, keeping the flow of the meeting on the issues rather than on personalities. The planning staff can filter the input data for validity, excluding non-verifiable data. Alternative solutions and the output maps generated for these alternatives may be filtered for positional distortions. These filtering functions will minimize the "Experts'" influence over the proceedings - one side is less likely to overwhelm the other due to superior resources. Finally, the user interface problem is simplified. The operating
126
interface can be aimed toward a higher level user. The hardware and software required should be cheaper. The disadvantages of a single-user GSDSS center on the requirements for a set of highly skilled operators and support staff. Required staff skills would include data filtering, GIS and spatial concepts, and negotiation and mediation skills. The public meetings will be less "democratic", in that the facilitator will have full control over the negotiating process. The process requires legitimacy from the parties involved, much like submission to arbitration for civil disputes. Control by the facilitator and the planning agency means limited access by the participants. There is a danger that some participants may feel excluded or discriminated against. The success of such a system requires strong ethical rules against bias. Research Questions Is the single user group spatial decision system a superior approach for resolving spatial conflict in a public context? It remains to be seen. Given the advantages of the of the single user GSDSS, there are many research question that can be applied to the development of a set of methods and procedures for problem definition, alternative generation, and negotiation support for spatial-locational problem solution in public meetings. One major question is the role of the user in the negotiation process. I propose three possible roles: the Operator, the Facilitator, and the Mediator. The simplest role is that of the operator. The operator acts as a technician for the group, operating the system and generating simulations and alternative scenarios only on requests from a group leader or from members of the group. The operator does not act as a participant in the group. He or she does not initiate solution alternatives or join into the discussion. Rather than being a part of the negotiating process, the operator acts as a human user interface for the others in the meeting. In some ways, this is like a multi-user GSDSS without the requirement for simple user interface software and multiple input terminals. The facilitator acts as a consultant for the group. He or she operates the system, generating simulations and alternative scenarios on request from the group, but also adds his/her expertise as a spatial analyst as a participant in the group process. The facilitator controls the flow of the meeting through suggestion. He or she does not have a formal leadership role, but may steer the negotiation process through constructive alternative generation, proposing alternatives that attack the central problems rather than those that explicitly favor one position. The mediator not only acts as a participant in the group decision making process, but acts in a leadership role within the group. By operating the spatial decision support system and taking a leadership role in problem definition and alternative generation, the he or she can focus the attention of the group on finding common ground and negotiating a workable solution. The mediator has the added advantage of filtering capability. He or she can question, moderate , or reject proposals or information that are inaccurate, distorted, biased, or inequitable. Other questions to be examined include: What sort of functionality is required for a Group Spatial Decision Support System? Is spatial decision support the main need or is spatial understanding support more important to the process? Can we design a general purpose GSDSS for land-use issue negotiation, or would it make more sense to design many specialized GSDSS's for site location, schools, emergency services, etc.?
127
What sorts of graphic displays would be most effective for a single-operator GSDSS? What sort of procedures would be most effective for conducting negotiation and mediation in public meetings supported by a GSDSS? How would the participants forward their queries to the operator? What sort of time frame would the process work under? What sort of data filtering would be required to support such a system? How would data sets be evaluated for validity and bias? Are we creating a new profession of a GSDSS mediator/facilitator/operator? What sort of training would be required to fill this position? GIS, spatial concepts, data processing, land use planning, negotiation and mediation techniques? What sort of system of ethics would be required for such a group in order to retain legitimacy by the disputing parties? Bibliography Armstrong, M., Lolonis, P., & Honey, R. A Spatial Decision Support System for School Redistricting. URISA Journal, V. 5, pp. 40-52, Spring 1993 Armstrong, M., Rushton, G., Honey, R., Dalziel, B., Lolonis, P., De, S., & Densham, P. Decision Support for Regionalization: A Spatial Decision Support System for Regionalizing Service Delivery Systems. Computers, Environment, & Urban Systems, V. 15 pp.37-53 1991 Cohen, Herb, You Can Negotiate Anything. Bantam Books, New York 1980 Couclelis, H. & Monmonier, M. Using SUSS to Resolve NIMBY: How Spatial Understanding Support Systems Can Help with the "Not in My Backyard" Syndrome Edelman, Joel & Crain, Mary Beth. The Tao of Negotiation Harper Collins, New York 1993, Fisher, Roger & Ury, William Getting to Yes. Penguin Books, New York 1981 Forester, J. Planning in the Face of Conflict APA Journal, Summer 1987, pp. 303-314 Jarke, M. Knowledge Sharing and Negotiation Support in Multiperson Decision Support Systems Decision Support Systems, V. 2, pp. 93-102 1986 Jarke, M., Jelassi, M.T., & Shakun, M. MEDIATOR: Towards a Negotiation Support System European Journal of Operations Research, V. 31, pp. 314-334 1987 Jelassi, M.T. & Beauclair, R. An Integrated Framework for Group Decision Support Systems Design Information and Management, V. 13, pp. 143-153 1987 Nunamacher, J.F., Dennis, A., Valacich, J. & Vogel, D. Information Technology for Negotiating Groups: Generating Options for Mutual Gain Management Science, V. 37, pp. 1325-1346 1991 Rao, V.S., & Jarvenpaaa, S. Computer Support of Groups: Theory-Based Models for GDSS Research Management Science, V. 37, pp. 1347-1362 1991 Sycara, K. Negotiation Planning: An A.I. Approach European Journal of Operations Research, V. 46, pp. 216-234 1990
128
Sycara, K. Problem Restructuring in Negotiation Management Science, V. 37, pp. 1248-1268 1991 Tobler, W. A Computer Movie Economic Geography, V. 46, pp. 234-240 1970 Uri, William Getting Past No Bantam Books, New York 1993 BIOGRAPHY Dave Lemberg Graduate Student Department of Geography, University of California at Santa Barbara NCGIA A.B. Political Economics - University of California at Berkeley, 1981 Masters of Regional Planning - University of North Carolina - Chapel Hill 1983 Thesis - Application of Telecommunications Technology to New Community Design Dissertation Topic - Optimization Models for Magnet School Program Location Prior to returning to school in 1992, I spent 6 years as Senior Planner at Educational Data Systems, Inc. in San Jose, California. The firm sold software and consulting services to school districts for long-range facility planning. My task over that time was to design and program a modeling system that started as a mainframe text driven system into a Spatial Decision Support System for school district planning. The use of the system evolved from a system that only the consultants could operate to a graphically driven system that school personnel could use with a couple of days training. Attached to the system was a methodology for using the computer to develop a dynamic master planning document that changed with changes in district parameters such as enrollment, new home building, dwelling yield shifts, migration rate changes, etc. The next step was to use the planning system, ONPASS, as a tool for large group presentations and planning sessions. The background for this position paper came from experiences in using the SDSS as a negotiation and mediation support tool. Other work experience involved consulting, planning, and computer programming with a private transportation company, a public utility, a public planning agency, and a public transit agency.
129
Reading Risks A Proposal to NCGIA Initiative 17: Collaborative Spatial Decision-Making Seymour J. Mandelbaum May 11, 1995 This brief account of the paper I am writing describes two complementary focii. The first places the relationship between geographic information systems and collaborative group dynamics within the general framework of a process through which planning tools are made and broken. The second explores that framework using the representation of risk as an analytic probe. The first focus dominates this note; the second will dominate the paper. The call for the conference is grounded in a archetypal story. In this stylized account, a group is engaged by an issue that appears (at least to some in the circle) to call for collective action. The conversation begins and then, at one point or another, the discussants are presented with a spatially organized set of measurements that I will call, for simplicity's sake, a "map." The group processes continue -- sometimes ignoring the map and sometimes using it to shape the issue and the group's decisions -- until (with the authority of the narrator) the story is brought to a close. The conference and the research program to follow seek -- as I interpret the call -- to understand and improve the processes of creating and reading maps -- in all their variety. "How," we ask within the epistemic community of map-makers, "does the representational form, timing, social provenance and authority of a map -- or better, a set of maps -- influence its uses? How do the characteristics of issues and of groups shape the dynamics of reading?" The goal of the enterprise is to increase the ability of a group to articulate and evaluate alternative "solutions to spatial problems," and to resolve "spatial conflicts." The political framework within which these aspirations are set is a general commitment to "collaboration." The term is ambiguous -- masters and slaves may, after all, be said to "collaborate" -- but I assume that it here implies a high level of uncoerced consensus within the group, resolving conflicts in a way that is not only legitimate but satisfactory. In the fashionable term of the mediator's art, a collaborative sensibility seeks "win/win" solutions. Within this context -- engaged in the service of the collaborative sensibility -- maps and the processes of creating and reading them must capture and discipline the issues that occupy the collaborators privately. Absent that engagement, maps are rejected (either tacitly or explicitly) as irrelevant or pernicious; are controlling only by the use of coercive mandates. That is, I suspect, a familiar caution. If the level of aggregation in a geographic information system is too large to capture the moral concerns of the collaborators, it is difficult for them to express and compare their worlds. Maps confuse and contaminate the conversation when boundaries are "wrong," "distance" measures don't capture "location," social conflicts are misread in the language of space or protean processes are deceptively frozen in time. Familiarity is often, however, only small comfort. Warnings may be ritually repeated with little impact on the deep structures that make them difficult to follow. The measures and the representational protocols that are brought to bear in "group-based" processes are characteristically generated in complex polities and depend upon both radical simplifications and legitimate coercion. Like the U.S. Census, they are trenches designed to constrain and 130
manage group processes by providing a public conception of their external environments. Inevitably, however, the external measures colonize the representation of the internal environment: we are bound sometimes to describe ourselves as if we were figures in the Census or the reporting forms attached to funding requests. (In this way, we adopt one of the prescribed ethnic identities or measures of "need.") Uncoerced collaborations make it difficult, however, to repress identities and secret concerns. When they "out," they threaten the discipline of an imposed public order (or map). The perils of the external information system are complemented by internal difficulties. A collaborative process often changes the Mind and archetypal stakeholders of a group, altering the balance of open and strategic speech and shifting preferences and conceptual frames. The stages of deliberation alter the demands for information. Boundaries, dimensions and levels of aggregation that capture and discipline speech in the opening moves of a collaborative process may be too simple for the middle game. As a group works towards convergence, however, the complexity of the middle may retard closure if it is not shed. A geographic information system to "support" uncoerced decisions must be appropriate to its moment. It is, however, virtually impossible to create a map that changes with the group if the map-makers see themselves as creating a stable, foundational order of "fact" and if the process of reading is not robust enough to support a conflictual conversation of incomplete intimations. The often faltering and flawed adjustment of geographic information systems to the dynamics of collaborative groups exemplifies a ubiquitous process of making and breaking planning tools. The making of tools may start with the social construction of a privileged image of a "problem" and the subsequent crafting of an instrument appropriate to their construction: "Since this is a spatial problem, we need a map." The flow may, however, proceed in the other direction: "We have a map so let's think of this as spatial problem." In a symmetrical fashion, the breaking of tools may be initiated either by the denial of the cogency of a problem construction or the relevance and effectiveness of the instrument. The symmetry is not, however, complete. It does not take a tool to break a tool. A technological consensus may be eroded without a replacement arising instantly in its place. (In the interregnum, both savvy professionals and ordinary men and women may grieve for lost certainties.) The rhetoric of making and breaking may also be different: one confident and romantic; the other skeptical, angry and even tragic. ("What becomes of the precious notion of the general welfare," we wonder sadly, "if the technical bases of a utilitarian calculus no longer command our respect?") There is a great deal of similarity between the making of planning tools and the (much more familiar) crafting of technological innovations in manufacturing. Some manufacturing innovations begin on the shop floor and spread initially from one set of users to another without the mediation of cosmpolitan scientists or engineers. Others, originate in research laboratories and are first expressed in abstract rhetorical forms before they are "applied" to "practical" affairs. In the same way, some planning innovations originate in the dense world of collaborative groups and others in the necessarily simplified rhetoric and authoritative claims of large polities. Wherever the tale begins, innovations in manufacturing and planning only earn a consensual authority -- only, in effect, appear as "tools" -- when they have both been honed in the practices of particular places and explicated in the simplified rhetoric of every place. The process of making tools at two different scales and in two different rhetorical styles, creates complementary disciplines. Collaborative group processes test both the claims to authority characteristic of large polities and the requirements for simplification associated with the management of diverse units. Hierarchical processes in large polities sustain public orders that support inter-communal relations and make it possible to distinguish the array of "distinctive" places in which a tool is apposite. 131
The call to the conference quite sensibly suggests that experience matters; that some problems in the design of geographic information systems are hidden when we design for every place and in the abstract language of the map-makers themselves. Only in the practices of collaborative groups do we finally appreciate how unfriendly are our designs or how much they distort the worlds in which users struggle with collective choices. (A similar observation applies, of course, at the other end of the spectrum: experience matters in the appreciation of the limits of collaborative processes.) Experience is not, however, our only teacher. Many of the qualities in information systems that frustrate collaboration are apparent in the arguments phrased at a high level of abstraction in the corridors of power and formal science. Consider the representation of risk. Some geographic information systems purport to map explicitly the incidence of risk: here is a cancer belt, there the aquifer carries industrial pollution from brownfields to rural pastures. There is, however, a larger sense in which every spatial display -- even the most benign -evokes a reading of risk. Presented with a map, we all sensibly wonder: who and what is at risk in either trusting the display or in distrusting it? what sorts of risks are attached to the spatial pattern elaborated in the map? The ways in which we answer those questions express our essential images of time and planning. If a collaborative process does not provide an opportunity for those readings of risk to be expressed, they will (like the water-borne pollution) surface in strange places. Tools for the representation of risk are grounded into one of two images that are formally distinctive and even conflicting though in the muddied and opportunistic language of planning they often appear together. In the first, risk appears as an expected consequence of enterprising behavior so that we talk of ourselves as responsible agents "taking" risks. We may prudently act to mitigate future dangers but we cannot expect to eliminate them. We should, indeed, be wary of devoting ourselves so fully to mitigation that we foreclose valuable opportunities; of being so risk aversive that we accomplish nothing. The tools we construct within this image seek to decompose bundled risks and opportunities into discrete elements and to create a common metric that allows us to compare and aggregate prospective gains and losses. The tool-makers, acting within this image, seek in the words of a recent NSF-EPA request for proposals, to develop a "systematic and compelling valuation mode." In the second image, we speak of ourselves as victims whose rights are violated when we are put "at risk" from the behavior of others or our own ignorance or akrasia. The risk -- always prospective -- is represented as if it were a tort -- an unjustified injury in the past -- that must (rightfully) be rectified. The tools of representation engage the allocation of blame and the assignment of responsibility for rectification. Biography Seymour J. Mandelbaum Professor of Urban History Department of City and Regional Planning University of Pennyslvania Philadelphia, Pennsylvania 19104-6311 Telephone: (215) 898-6492 Fax: (215) 898-5731 E-mail:
[email protected]
132
This proposal follows upon a resolve to increase contact between the communities of interpretive planning theoreticians and of designers crafting new planning technologies. That resolve is announced in an essay -- "The Technological Sensibility" -- scheduled for publication in the April issue of the Town Planning Review and in my introductory essay -"The Talk of the Community" -- at the beginning of Explorations in Planning Theory, scheduled for publication in December. Dick Klosterman, Judy Innes and I have arranged two sessions on the theory/technology nexus at the Detroit ACSP meeting in October. The tack I have taken -- framing the making and breaking of planning tools within the dynamics of epistemic and practice communities -- continues a theme that runs through virtually all my work: from Boss Tweed's New York (1965) and Community and Communications (1972) to a new book, Open Moral Communities, that will, I hope, be out next Spring. The title I have given this proposal emphasizes this continuity by echoing an earlier essay on "Reading Plans," Journal of the American Planning Association, 56 (1990), 350-356. In addition to the project on tools, I have joined a recent proposal to NTIA to use Libertynet - the regional "freenet" -- as a complement to the "collaborative" development activities of the Philadelphia empowerment zones.
Interaction Coding Systems for Studying Collaborative Spatial Decision Making Timothy L. Nyerges University of Washington Department of Geography University of Washington Seattle, WA 98195
[email protected] 1. Introduction Studying the use of decision aids as part of research on collaborative spatial decision making (CSDM) should be a complement to developing decision aid tools. One reason for this is that intended use of advanced information technology can be different fro m actual use (DeSanctis and Poole 1994). Unfortunately, there has been very little empirical research describing how people make use of geographic information systems (Nyerges 1993). Some GIS research is beginning to appear focused on individual use (Davi es 1995), but systematic, empirical studies are only now being performed with group-based decision interaction as a focus (Lewis, Reitsma, and Zigurs, 1992, Nyerges and Jankowski 1994). The essence of this latter research is to identify the shared underst anding people have about the use of decision aids that specifically treat geographic information. Interaction coding systems are used to assist in the recovery of data that describe decision aid use. An interaction coding system is essentially a set of keywords that summarizes the character of a process and the mechanisms used in that process from a particular perspective. A suite of coding systems is described in this paper.
133
The coding and analysis approach to research goes by several names in various disciplines. In social science research it is generally known as content analysis (Krippendorf 1980). In psychology, cognitive science and computer science it has been called pr otocol analysis (Ericsson and Simon 1984). In social psychology, sociology and speech communication this process of analysis is called interaction coding analysis (Poole and Roth 1989a). Commonalties across disciplines is indicative of the general applicability for social-behavioral research. Coding systems have been used in research on advanced technology to summarize research data captured about small-group decision interaction (Poole and Roth 1989b). The data is used to identify patterns and the impact s of decision aids on these patterns of decision making. Software tools are available to assist with coding of textual transcripts, and have even been developer for coding data directly from audio-video tapes (Sanderson, James, and Seidler 1989, Roschelle and Goldman 1991). Analysis of the data can be performed using qualitative and quantitative statistical techniques. The interaction coding systems discussed in this paper are being developed as part of a study of the impacts of computer-assisted decision aids on collaborative spatial decision making (Nyerges and Jankowski 1994). The research design for this study makes use of a laboratory setting in which geographic information systems and multicriteria decision models are the core decision aid technologies being used by small groups of decision makers. The decision making task has been taken from a realistic decision context dealing with wildlife habitat site selection in the Duwamish Waterway estuary of Seattle, Washington (National Oceanic and Atmospheric Administration 1994). Habitat site selection is growing in importance as environmental analysts are faced with choosing an appropriate balance of financial and human resources. The habitat site selection problem is viewed as consisting of three types of tasks -- a creativity task, a preference task and a cognitive conflict task (McGrath 1984). The creativity task involves sorting out basic issues about what attributes are important as part of the site character, and forming a list of potential sites. The preference task involves selection of a set of attributes that form the criteria for choosing; these criteria becoming the basis of the site selection process. The cognitive conflict task involves group members sorting through the collection of criteria, each member presumably having a different pers pective for wanting particular criteria prioritized over others, and for selecting certain sites over others. Site selection can be viewed as a decision process that involves conflict management (interaction), due to the different perspectives inherent in the views of participating members. A conflict management activity is composed of two subactivities called id ea differentiation and idea integration. Both idea differentiation and idea integration are essential to resolving differences in viewpoint and reaching a consensus (Walton 1969, Sambamurthy and Poole 1992, Poole, Holmes and DeSanctis 1991). Idea differentiation involves extracting information on characteristics of sites, and making distinctions among the attributes that characterize sites, hence differentiating the sites themselves. Idea differentiation also involves a contrast of the decisi on strategies that are used, one being favored over another to derive the solution in site selection. Idea integration involves a process of synthesizing the attributes to establish the criteria to be used in making the decision. Idea integration involves following through in the making of the decision by applying a decision strategy. Such a decision stra tegy could be carried out in either a manual or computer-assisted mode, and should not affect the basic development of a suite of coding systems used to capture the character of the process.
134
2. Interaction Coding Systems for CSDM Research The impacts of information technology on collaborative spatial decision making can be captured through the use of a suite of coding systems. Five coding systems are being used in this research, and each is described in turn as follows. 1. decision functions coding system (DFCS) - for summarizing decision phases, 2. group working relations coding system (GWRCS) - for summarizing group social interaction, 3. decision aid coding system (DACS) - for summarizing the kinds of decision aids invoked, 4. aid appropriation coding system (AACS) - for summarizing the manner in which decision aids are invoked during the decision process, and 5. decision aid use coding system - for summarizing how each aid is being used for information interaction. Each of these is explained in more detail in the following sections. 2.1 Decision Functions Coding System A decision functions coding system (DFCS) can be used to collect data on phases of decision making, including problem development, critique and consensus. Poole and Roth (1989a) developed and tested DFCS using a variety of decision making tasks, among the m preference tasks (McGrath 1984). Because wildlife habitat site selection is a type of "preference task", the coding system should be applicable to this research. The DFCS consists of several activity categories. The keywords with their associated phase type codes (in parentheses) are presented below. 1. Problem Activity 1a. Problem Analysis (PA) : Statements that define or analyze the problem facing the group 1b. Problem Critique (PC, with + or -): Statements that support or criticize a problem analysis 2. Execute Activity 2a. Orientation (OO): Statements that direct the group's process or help the group to do its work. 2b. Process Reflection (PR): Statements that comment on the group's process or progress 3. Solution Activity 3a. Solution Analysis (SA): Statements that define how the group will go about developing its solution in general terms, including criteria and general directions 3b. Solution Design (SD): statements that propose solutions 3c. Solution Elaboration (SEB): statements that alter or amend solutions 3d. Solution Evaluation (SEV, +,-,/): statements that support (+), criticize (-), or offer evaluation (/) of solutions. 3e. Solution confirmation (SC, +, /): statements that ask for confirmations (+) or votes (/) for final confirmation of decisions. 4. Non-related Activity 4a. Tangents (TA): moving to an unrelated subject 4b. Disorganization (DI): Disorganized or nonfocused discussion.
135
2.2 Group Working Relations Coding System The group working relations coding system (GWRCS) is being used to describe the collective interaction among decision makers. GWRCS was developed and tested by Poole and Roth (1989) to recover interpersonal confli ct during the multi-phase, cyclic nature of groupdecision making. GWRCS was developed and tested using a variety of decision making tasks, among them cognitive conflict tasks in addition to preference tasks, hence it is thought to be suitable for recover ing the phases of conflict interaction in this research project. Furthermore, GWRCS has been applied to conflict interaction for group decision making within a GSS meeting environment (Poole, Holmes and DeSanctis 1991), but maps and multi-criteria decisio n aids where not part of their experiment. The GWRCS consists of several categories and associated codes as follows. 1. Work Focused Relationships 1a. Focused Work (FW): Periods when members are task focused and do not disagree with one another 1b. Critical Work (CW): Periods when members disagree with each other, but the disagreements are centered on ideas and no opposing sides have been differentiated. 2. Conflict 2a. Opposition (OP): Periods in which disagreements are expressed through the formation of opposing sides. 2b. Accommodation (AC): A mode of resolution of opposition in which one side gives in. 2c. Tabling (TAB): A mode of resolution of opposition in which the subject is tabled or dropped. 2d. Open Discussion (OD): A mode of resolution of opposition that utilizes problemsolving discussions, negotiation, or compromise. 3. Integration 3a. Relational Integration (RI): periods when the group is searching for task-focus, but may wind up on tangents, joking or distracted. 2.3 Decision Aid Coding System The decision aid coding system (DACS) consists of three coding subsystems, a map type coding system (MTCS), a multicriteria decision model coding system (DMCS), and a consensus aid coding system (CACS). 2.3.1 Maps The map type coding system (MTCS) focuses on map types being used by group members. It consists of the following. 1. Descriptive site map (DM). Site locations and names. 2. Rankmap (RM) - displays ranks of the sites 3. Graduated Circle map (GM) - shows at tributes via graduated circle 4. Bar Map (BM) - shows attributes using bars as in a histogram 5. Choropleth map (CM) - a gray scale shaded map
136
6. Orthoimage (OI) - shows area using photo image 7. Table Display (TD) - a table of attribute information 8. Graph Display (GD) - a graph dis play to show relation 9. Text help (TH) - text help explains a particular software capability or data category 2.3.2 Multicriteria Decision Models The multicriteria decision method (model) coding system (DMCS) focuses on the types of aggregation methods (model) used to perform analysis. It consists of two types of aggregation methods: 1. Aggregation method choice 1a. weighted summation (WS) aggregation method - the familiar rate and rate approach 1b. aspiration level (AL) aggregation method - sets a level of attainment and telss the user how close to this level has been achieved. 2. Weight method choice 2a. aspirations (AS) - sets a level of attainment for an attribute 2b. pairwise comparison (PC) - each attribute is compared against every other for preference 2c. ranking (RK) - assign on a scale of 1 to 9 2d. rating (RA) - proportion 100 points across all criteria 2.3.3 Consensus A systematic approach to consensus makes use of consensus aids called voting strategies. Voting strategies are 1. non-rank vote (NRV - simple majority of yea answer for vote 2. rank vote (RV) - adds the ranks (1 to 9) using Borda social preference 2.4 Aid Appropriation Coding System The aid appropriation coding system (AACS) focuses on how the decision aids are invoked, i.e., brought into use, and is based on the appropriation coding system of DeSanctis and Poole (1991). They describe nine generic types of appropriation moves: 1. direct appropriation (DIR) - represents active use of a single decision aid, i.e. software capability and/or organizational guideline for a cognitive task; 2. substitution (SUB) - one decision aid replaces another to carry out the cognitive task. 3. combination (CMB) - two decision aids are melded together to carry out the cognitive task. 4. enlargement (ENL) - two decision aids are compared to eachother, but only one may be used to carry out the cognitive task.
137
5. constraint (CST) - constraint attempts to interpret and understand a single decision aid in light of the cognitive task. 6. contrast (CNT) - two decision aids are placed in opposition and one is chosen to carry out the task. 7. affirmation (AFF) - represents the positive modes of response to others' appropriations for carrying out a cognitive task 8. negation (NEG) - represents the negative modes of response to others' appropriations for carrying out a cognitive task 9. ambiguity (AMB) - Ambiguity represents uncertainty and confusion for what should be used to carry out a cognitive task. 2.5 Decision Aid Use Coding System The decision aid use coding system (DAUCS) focuses on the socio- cognitive activity of decision aids after they have been appropriated. These operations directly support the need to carry out certain decision functions, hence implement shared cognitive ac tions to carry out the decision functions (i.e., the functions in the decision functions coding system). The decision aid use coding system (DAUCS) will code the elementary operations used for differentiating and integrating information. Rather than develop two coding systems for decision aid use, one for maps, and one for decision models, a single, synthesized coding system for decision aid use has been devised. Literature for map use operations includes basic reading tasks (Board 1978, 1984, Morrison 1978) and analytical operations (Nyerges 1991). Literature for the MCD model perspective includes individual decision making (Payne 1982), individual decision support system use (Todd and Benbasat 1992), an overview of group-based MCD appro aches (Hwang and Lin 1984), and a particular MCD model in a GDSS (Dickson et al 1991). When DAUCS is combined with the DACS subsystems, different decision aids and their manners of use can be identified. The keywords and respective codes are as follows. 1. Acquire (AQ) information from a source and internalize it 1a. read (RD) 1b. retrieve (RE) 1c. search (SE) 1d. identify (ID) 1e. locate (LO) 1f. istribution (DT) 1g. abel (LB) 1h. define (DE) 2. Save (SV) information for later use 2a. save temporarily (ST) 2b. save permanently (SP) 3. Interpret (INP) meanings for a source of information to develop a perspective 3a. distinguish (DT) 3b. categorize (CZ) 3c. simplify by location (SL) 3d. classify by location (CL) 3e. aggregate (locate, cluster, bind, describe) (AG) 138
3f. generalize by attribute (GA) 3g. classify by attribute (CLA) 3h. simplify by attribute (SIA) 3i. weight (WT) 4. Analyze (ANL) to derive or synthesize information, or change into a different form 4a. associate (AO) 4b. cluster (CS) 4c. rank (RK) 4d. count (CT) 4e. correlate (CR) 4f. measure (MS) 4g. interpolate (IP) 4h. add (AD) 4I. subtract (SB) 4j. multiply (MU) 4k. divide (DV) 5. Evaluate (EVL) to explore information usefulness 5a. compare (CP) 5a1. within (CPW) 5a2. between (CPB) 5b. contrast (CN) 5b1. within (CNW) 5b2. between (CNB) 5c. verify (VE) 6. Judge (JU) to determine information usefulness 6a. prefer (PF) 6b. like (LK) 6c. choose (CH) 3. Conclusions Interaction coding for small groups has been practiced in studies in social psychology, sociology and speech communications for some time. It has yet to be done in studies with group-based GIS. In summary, five coding systems are being proposed to encode data on collaborative spatial decision making in the context of wildlife habitat site selection. The decision process will make use of geographic information technology and multicriteria decision models. The coding systems are thought to be general enough to be used (with possible extensions) for many kinds of spatial decision tasks. This research is intended to distill and enhance further the coding systems through the data collection and analysis process. Each coding system has an emphasis, making it easier to encode data from a different perspective. The decision functions coding system describes phases in a decision process. The group working relations coding system describes person to person social inte raction as part of conflict management in a group. The decision aid coding system consisting of a map type coding subsystem and a multicriteria decision model subsystem is used to decision the kinds of aids being used. The aid appropriation coding system captures how the decision aids are brought into use by the group. Finally, the decision aid use coding system focuses on the social-cognitive act of putting the decision aids to use in various ways.
139
Both general and detailed hypotheses will make use of the data captured by way of the coding systems. As an example of general hypotheses, it is expected that both the MTCS and DMCS codes will be applied to idea differentiation and idea integration decisi on sequences. However, it is expected that MTCS will be applied more during coding of idea differentiation and DMCS will be applied more during coding of idea integration. In addition, data observations are used in some of the more than twenty variables t hat have been identified to describe the CSDM processes. Whether development and use of coding systems is the appropriate way to perform behavioral research on decision making is still being debated. It is accepted as an approach to systematically characterize a decision process. However, the concern is whether it does so artificially. Do users of technology really make decisions in the way that they are coded? Or, are decision makers and users of software technology interacting in a way different than what is being summarized. One way of assisting with insurin g valid data is to: 1) video tape decision makers, 2) ask them to comment on what they did and tape record that, 3) code the video tapes, and 4) use the audio tapes as a quality control check on the coding. The interaction coding process is the core of a social-behavioral science investigation of decision making. There are several approaches to coding and coding validation, but they are nonetheless part of a coding process with many commonalties. There are o ther levels of coding of data about small groups other than at the level of the group as a whole. For example, how do individuals in the group behave? Are there leaders and followers, and is this caused by expertise with information technologies. How do g roup decisions fit into organizational contexts as part of the decision process. Through research experience we can come to gather better qualitative and quantitative data characterizing CSDM processes. Only with better data can we evaluate the input, process, and outcomes of the decision process in a systematic fashion. Everything el se will really be anecdotal speculation. Acknowledgment: This research is being funded by the National Science Foundation, Division of Social and Behavioral Research, Geography Program, grant SBR-9411021. References Board, C. 1978. Map reading tasks appropriate in experimental studies in cartographic communication. The Canadian Cartographer, 15:1-12. Board, C. 1984. Higher Order Map-using tasks: geographical lessons in danger of being forgotten, Cartographica, 21(1):85:97. Davies, C. Medyckyj-Scott, D. 1995. Feet on the Ground: Studying User-GIS Interaction in the Workplace, in T. Nyerges, D. Mark, R. Laurini, M. Egenhofer (Eds.) Cognitive Aspects of Human-Computer Interaction for Geographic Information Systems, 123-142. Do rdrecht, Netherlands: Kluwer Academic. DeSanctis, G. and M. S. Poole, 1991. Understanding the Differences in Collaborative System Use Through Appropriation Analysis, Proceedings, the Hawaii International Conference on System Sciences, Los Alamitos CA: IEEE Press. pp 547-553.
140
DeSanctis, G. and M. S. Poole, 1994. Capturing the Complexity in Advanced Technology Use: Adaptive Structuration Theory, Organization Science, 5(2):121-147. Dickson, G. W., G. DeSanctis, M. S. Poole, M. Limayem, 1991. Multicriteria Modeling and "What If" Analysis as Conflict Management Tools for Group Decision Making, Proceedings, 11th International Decision Support Systems Conference - DSS '91, (ed.) Ilze Zi gurs, The Institute of Management Sciences. Ericsson, K. and Simon, H. A. 1984. Protocol Analysis: Verbal Reports as Data. Cambridge: MIT Press. Hwang, C. and M. Lin 1987. Group Decision Making Under Multiple Criteria, Lecture Notes in Economics and Mathematical Systems 281, New York: Springer-Verlag. Krippendorf, K. 1980. Content Anlaysis: an Introduction to its Methodology, Beverly Hills, CA: Sage. Lewis, C., R. Reitsma, and E. Zigurs, 1992. A Decision Support System for Group-based Hydrological Modeling, Research Proposal funded by the National Science Foundation, Program for Robotics, Information and Intelligent Systems. University of Colorado, CA DSwes Research Center. McGrath, J. E. 1984. Groups: Interaction and Performance, Englewood cliffs, N J: PrenticeHall Inc. Morrison, J., 1978. Towards a Functional Definition of the Science of Cartography, The American Cartographer, 5(2):97-110. National Oceanic and Atmospheric Administration, 1994. Concept Document, Elliott Bay / Duwamish Restoration Program, report prepared for the Elliott Bay / Duwamish Restoration Program Panel by the King County, Washington, Department of Metropolitan Services, Panel Publication 7, June 1994. Nyerges, T. L. 1991. Analytical map use, Cartography and Geographic Information Systems, 18(1): 11-22. Nyerges, T. L. 1993. How Do People Use Geographical Information Systems?, in D. Medyckyj-Scott and H. Hearnshaw (Eds.), Human Factors in Geographical Information Systems, pp. 37-50, London: Belhaven Press, available now from John Wiley & Sons. Nyerges, T. L., and Jankowski, P. 1994. Collaborative Spatial Decision Making Using Geographic Information Technologies and Multicriteria Decision Models. research funded by the National Science Foundation, Directorate of Social and, Behavioral Research, Geogr aphy Program, SBR-9411021. Payne, J. W. 1982. Contingent Decision Behavior, Psychological Bulletin, 92(2):382-402. Poole, M. S. and J. Roth 1989a. Decision Development in Small Groups IV: A Typology of Group Decision Paths, Human Communication Research, 15(3):323-356. Poole, M. S. and J. Roth 1989b. Decision Development in Small Groups V: Test of A Contingency Model, Human Communication Research, 15(4):549-589.
141
Poole, M. S., Holmes, M. and DeSanctis, G. 1991. Conflict management in a computersupported meeting environment, Management Science, 37(8):926-953. Roschelle, J, and Goldman, S., 1991. VideoNoter: a productivity tool for video data analysis. Behavior Research Methods, Instruments, and Computers, 23(2):219-224. Sambamurthy V. and M. S. Poole 1992. The effects of variations in capabilities of GDSS Designs on Management of Cognitive Conflict in Groups, Information Systems Research, 3:3, Sept, 1992, 225-251 Sanderson, P. M., James, J. M., and Seidler, K. S. 1989. SHAPA: an interactive software environment for protocol analysis, Ergonomics 32(11), 1271-1302. Todd, P. and I. Benbasat 1992. The Use of Information in Decision Making: An Experimental Investigation of the Impact of Computer- Based Decision Aids, MIS Quarterly, September 1992, p. 373-393. Walton, R. 1969. Interpersonal Peacemaking: Confrontations and Third Party Consultation. Reading, MA : Addison-Wesley. Biographical Sketch Dr. Timothy L. Nyerges, Associate Professor Department of Geography, University of Washington Seattle, WA 98195
[email protected] Tim Nyerges received his Ph.D. from the Ohio State University in 1980. From 1980- 85 we was a software project lead and consultant. From 1985-present he has been with the Univ of Washington. His teaching and research responsibilities include topics for de sign and application of GIS. Current research focus is studying spatial problem solving and decision making through human-computer interaction in the context of group decision support systems. He specializes in applications in transportation and environme ntal management. Presently, he has two National Science Foundation funded projects. One is for studying the inluences of use of computer-assisted decision aids on collaborative spatial decision making . The second is for curriculum development emphasizing teamwork with geographic information technology. He is currently a member of ACSM, ASPRS, URISA, ACM and AAG.
142
Visualization Support for Collaborative Spatial Decision-Making* Alex Pang, Baskin Center for Computer Engineering & Information Sciences University of California, Santa Cruz Santa Cruz, CA 95064 Abstract Scientists want to collaborate at different levels ranging from sharing of data, sharing of visualization results, to joint cre ation and analysis of data. A system that attempts to support collaborative spatial decision-making must support these different levels of collaboration. We describe a system called CSpray that tries to achieve these goals.
1 Introduction At UCSC, we have been working on the REINAS (Real-time Environmental Information Network and Analysis System) project to provide real-time data acquisition, data management, and data visualization of environmental data to a variety of users. On the visualization front, we are looking at providing collaborative scientific visualization support for our users from meteorology and oceanography. While their inputs and needs have contributed to the design of our system, the visualization and auxiliary tools that we have developed are also applicable to other domains such as GIS. Our work falls under the category of CSCW (Computer Supported Collaborative Work) with applications to scientific visualization. The immediate impact of the application area is twofold: (a) Data lives in a 3D (or higher dimension) world. This is in contrast to the textual or 2D collaborative document or drawing applications commonly found in CSCW applications. (b) There is a large volume of data transfer among participants. The implications of the higher dimensionality of the workspace are the necessity to support annotation and pointing in 3D space, ability to roam around and change viewpoints in 3D, and the ability to see the viewpoint of others from their vantage point. On the other hand the implications of large data transfers raises issues of compression and different levels of data sharing. The section on Collaborative Features will highlight how these are addressed.
2 Architecture We use an in-house visualization system, called Spray, as our start off point for designing a collaborative visualization system. The single user version of Spray provides the users with a metaphor of grabbing spray paint cans loaded with special particles. As these particles enter the data space, they look for features of interests and display them as geometric primitives (e.g. points, lines, polygons, etc.). These a.re the visualization results. The cans are usually loaded with different types of particles. Each type of particle will produce different types of visualization effects (e.g. contours, iso-surfaces, streamlines, etc.). In a typical single user session, a user would create and load some spray cans with different types of particles. The user would then open data files and associate one or more of them with each spray can. Each of these cans can then be grabbed, moved, and sprayed in turn. In effect, the user incrementally creates the visualization product through successive applications of different spray cans. At any time, the user can also move about and change viewpoints within the data space. The extension of Spray to support collaboration among geographically distributed researchers is called CSpray which stands for Collaborative Spray. From the system point of view, CSpray has a symmetric architecture. To initiate a collaborative session, one of the sites starts up its CSpray application. Other participants then start up their own CSpray to connect to the first participant which is acting as a "server". Each CSpray application is identical to the others so that any of the applications can run as the "server" when the first participant decides to leave the session. Communication among participants are currently done with TCP/IP connections. While it does provide reliable data transfers, it also requires participant to participant (i.e. N 2) connections. We are looking at other alternatives, e.g. reliable multi-casting, to support larger number of participants.
3 Collaborative FFU-atures In CSpray, users on different workstations share the same virtual workspace with their remote collaborators. Each user create their own spray cans which are associated with local data sets just as before. Spray cans and their visualization results can then be selectively made public and available to other participants. Users move about this shared workspace and can see other users, public spray cans, and public visualization results. There are several issues and tools necessary to support this shared workspace environment. The following provides some highlights.
*
This project is supported by ONR grant N00014-92-J-1807
3.1 Session Management CSpray currently has a minimal form of session management. A session is a set of connections (participants) sharing a virtual workspace. Multiple simultaneous sessions are possible by starting up CSpray to connect to the appropriate "server" of a session. Multimedia tools such as nv and vat can be used in conjunction with CSpray to help orchestrate a session. However, there is no session directory or announcement facility for session initiation and termination. There is, on the other hand, support for participants joining and leaving a session at different times. This implies that late participants need to be brought up to date on the cur-rent state of the shared virtual workspace. Participants also need to be informed when a member leaves the session and so that the shared virtual workspace can be updated accordingly. As members join and leave a session, a list of active participants is maintained.
3.2 Public Window/ Eyecons Each participant in a session is represented by an eyecon (a floating eyeball). The eyecon has a label that indicates the participant’s name, and is used to show the participant’s position and orientation within the shared virtual workspace. While participants can see others within this workspace, they may also want to see what another participant is seeing. This is done by providing an extra graphics window, called the public window, where the world as seen by the other participant is displayed. There are two ways to look over your collaborator’s shoulders: (a) click on their eyecon, or (b) if their eyecon is not immediately visible, select their name from a pulldown list of active participants.
3.3 Private/Public Spray Cans Since spray cans are associated with data sets, we need to distinguish between private spray cans and public spray cans. Private cans and their spray results are visible only to the creator. This allows members to work independently first to make sure things look correct before broadcasting the can and the results to the whole session. Public cans are accessible by other members of the session. That is, other people can grab and spray someone else’s cans. This translates to requests to the remote machine to visualize the remote data set and make the results public. We also provide a special type of particle/can combination which we refer to as an annotation or pointer can. When sprayed, this can produces a 3D arrow which can be used to point at different locations within the shared virtual workspace. Annotations can also be typed in to label areas of interests.
3.4 Floor Control As soon as there is contention for shared objects (e.g. public spray cans), then there is a need to regulate their access - floor control. There are different floor control strategies. For CSpray we provide both an explicit floor release mechanism and a time-out mechanism. That is, a request for a shared object can be met by an explicit release (e.g. button click) by the current floor holder, or after some period (e.g. 5-10 seconds) if there is no activity on the shared object. To show the users the different floor states of a shared object, we use the color scheme of a stop light. If the label of public spray can is red, then it is currently being used by someone else (the label is green for the person who owns the floor). When a request is made on a public can, the label of the can turns to yellow on all the participants indicating to the holder that someone wants it, and acknowledging the requester that the request was recognized.
3.5 Data Sharing / Service Matching As pointed out earlier, scientists want to collaborate at different levels. They may want to share their raw data, in which case it may be more efficient to replicate the data set at the remote sites for faster processing. However, they may also opt to allow indirect sharing of their data through the visualization results. That is, don’t share the raw data, just the visualization results of the data. In this case, the geometric primitives that represent the visualization results need to be distributed to each member of the session. This also implies that other participants can grab the spray can to visualize other regions of the same data set. Recall that spray requests are sent to the host which created the spray can (i.e. where the data resides) to create and send out the visualization results. Yet another form of sharing is to provide images of the visualization but without granting access to manipulate and spray the cans. Different levels of data sharing is closely related to service matching. That is, participants in a session may have workstations of varying degrees of power. The goal of service matching is to provide the fastest feedback possible to users in a session within the constraints of the machines, the network, and the levels of data sharing the users set for each data set. It also implies that the session should avoid being bogged down by a participant on a slow machine. If one of the participants was on a slower machine (e.g. an X terminal with no graphics accelerator), the actual visualization work could be done remotely and then compressed image data sent to the slower machine. This is practical to the extent that the participant on the slower machine is willing to share raw data. Otherwise, requests to spray that participant’s cans would become a bottleneck in the session.
4 Conclusions We presented a system that supports collaborative scientific visualization. Most of the issues and problems we encountered in designing this system will most likely be similar in a GIS-based collaborative spatial decision making system. We think that CSpray is a good starting point for developing such a system and can currently address some of the visualization/collaboration needs.
Alex T. Pang Assistant Professor Computer and Information Sciences University of California, Santa Cruz, CA 95064
[email protected] http://www.ese.ucsc.edu/ ~pang EDUCATION Ph.D. M.S. B.S.
1990 University of California at Los Angeles, Computer Science 1984 University of California at Los Angeles, Computer Science 1981 University of the Philippines, Industrial Engineering - magna cum laude
RESEARCH INTERESTS Alex Pang’s research interests are in the area of computer graphics, scientific visualization, collaboration software, multimedia, and virtual reality interfaces. Recent work has focused on a modular and extensible visualization framework called Spray. This has since been extended to support collaboration and data sharing among geographically distributed users. Other areas of research interests are use of virtual reality devices in scientific visualization tasks, and displaying data quality or uncertainty together with the data. Previously, Professor Pang worked in the area of simulation of visualization of electrical propagation through the heart muscle walls. SELECTED PUBLICATIONS 1. Alex Pang and Craig Wittenbrink, "Spray Rendering as a Modular Visualization Environment", Computer Graphics, Vol. 29, No. 2, FOCUS: Modular Visualization Environments, Past, Present, and Future, edited by Gordon Cameron, 1995, pp. 33-36. 2. Alex Pang, "Spray Rendering", IEEE Computer Graphics and Applications, September, 1994, pp. 57-63. 3. Alex Pang and Michael Clifton, "Metaphors for Visualization", Sixth Eurographics Workshop on Visualization in Scientific Computing, to appear. 4. Alex Pang, Craig M. Wittenbrink and Tom Goodman, "CSpray: A Collaborative Scientific Visualization Application", SPIE Proceedings on Multimedia Computing and Networking, Vol. 2417, 1995, pp. 317-326. 5. Alex Pang and Naim Alper, "Bump Mapped Vector Fields", to appear in the SPIE Proceedings on Visual Data Exploration and Analysis, 1995. 6. Craig M. Wittenbrink, Elijah Saxon, Jeff J. Furman, Alex Pang and Sureh Lodha, "Glyphs for Visualizing Uncertainty in Environmental Vector Fields", to appear in the SPIE Proceedings on Visual Data Exploration and Analysis, 1995. 7. Alex Pang and Naim Alper, "Mix & Match: A Construction Kit for Visualization", IEEE Visualization 1994 Conference Proceedings, 1994, pp. 302-309. 8. Alex Pang, Jeff Furman and Wendell Nuss, "Data Quality Issues in Visualization", SPIE Proceedings on Visual Data Exploration and Analysis, Vol. 2178, 1994, pp. 12-23. 9. P.E. Mantey, D.D.E. Long, J.J. Garcia-Luna, A.T. Pang, H.G. Kolsky (UCSC), B.R. Gritton (MBARI), W.A. Nuss (NPS). "REINAS: Real-Time Environmental Information Network and Analysis System: Phase III - SYSTEMS DESIGN", UCSC-CRL-94-08, March 10, 1994.
Qualitative Collaborative Planning in Geographic Space: Some Computational Issues (extended abstract) Dimitris Papadias and Max Egenhofer
National Center for Geographic Information and Analysis & Department of Spatial information Science and Engineering University of Maine, ME 04469-5711 1
INTRODUCTION
Frequently people communicate spatial information using qualitative relations (constraints) between distinct objects rather than absolute coordinates. The constraints that have been used in the GIS literature are topological (e.g., disjoint, overlap), direction (e.g., north, east) and distance constraints (e.g., near, far). The importance of qualitative spatial constraints has led to their application in several domains related to GIS and Spatial Databases (for an extended discussion see Papadias and Sellis, 94). In this paper we study computational issues involved in qualitative collaborative planning in geographic space. We assume a number of decision makers (thereafter called agents) each having a set of beliefs about a given spatial planning problem. These beliefs are expressed in the form of qualitative spatial constraints between a set of objects. The problem is to generate spatial plans that are consistent with the agents’ constraints. As an example consider the planning problem illustrated in Figure I (the example was motivated by Leitner, 95). The agents are given the map of an area with wetlands, national parks, mountainous areas, urban areas and railways, and they want to decide the best possible sites for a new airport. Each agent may have different backgrounds and consequently different priorities (e.g., environmental versus business interests and so on).
The general constraint (assumed by all the agents) is that the airport cannot be in a mountainous terrain, in a wetland or in the park (constraint disjoint(airport, mountain) and disjoint(airport, park) and disjoint(airport, wetlands)). In addition, the first agent asserts that the airport should be somewhere east of the first lake and north of the major urban (direction constraints). The constraint imposed by the second agent is that the airport should not be very near or very far form the downtown of the major urban area (distance constraint: not-very-near(airport, major city) and not-very-far(airport, major city)). The third agent believes that the airport should be accessible using the train routes (topological constraint: intersects(railway, airport)). In Figure I we illustrate the constraints imposed by the three agents and a potential site that satisfies them. We use the above example only for demonstration purposes since real applications can be much more complicated; they may involve a large number of agents with different backgrounds and numerous constraints. In general spatial planning problems can be very difficult and an optimal solution that satisfies all constraints may not exist. The first problem is to identify what the
different agents imply by spatial terms and to model the various constraints in a unified framework (there is an obvious connection here with the problem of interoperability). After the constraints are expressed in a model there is the second problem, namely to devise tractable algorithms that efficiently check the satisfiability of the imposed constraints. The third problem is to perform the actual search in the (spatial) database using the set of consistent constraints of the second step. This problem involves spatial access methods that focus on the efficient processing of qualitative constraints. In the following sections we discuss these problems in more detail. 2
MODEL TRANSLATION
In order to demonstrate that different agents may have different models of space we will use the example of Figure 1. Figure 2a illustrates explicitly the direction constraints imposed by the first agent. In this Figure we assume a projection-based notion of directions, that is, direction relations are defined using parallel lines to some predefined coordinate axes. However, if the agent assumes cone-shaped directions (Frank, 92), the acceptance area imposed by the constrained is significantly different (Figure 2b). Especially in the case of direction relations, there are no widely accepted definitions and semantically different concepts are sometimes attached to the same linguistic terms. Furthermore, as it is shown in Figure 2, there is not even a universal model (e.g., projection or angular-based) according to which direction can be defined in geographic space.
Similar differences may occur in the case of topological relations. In Spatial Access Methods (e.g., window queries) the term overlap has been used to denote any configuration of objects that share some common point(s). This includes objects totally inside one another, objects that intersect at the boundaries but not at the interiors and so on. On the other hand, the intersection models (Egenhofer, 91), the main models used in the GIS literature, differentiate between these sub-cases resulting in a set of seven pairwise refinements of overlap as it is used in access methods terminology. One of these refinements is again called overlap1. Grigni et al., (95) used several sets of topological relations to reason in multiple levels of qualitative resolution. The same linguistic term has a different interpretation according to the resolution level; at the lowest level overlap has its access methods meaning, while at the highest resolution it assumes the 4intersection semantics. Obviously in the case of distance relations there can be significant differences in the notion that each agent has for near, far, etc. Such differences arise from subjective criteria, different metrics used (e.g., Euclidean vs. block worlds), and distortion caused by mental representations of space (for such examples see Hirtle and Jonides, 85). Only recently, work has focused on the formalization of the spatial relations that people evoke in everyday reasoning (Mark and Egenhofer, 94) Therefore the first goal in a qualitative collaborative planning problem in space is to identify the differences between the semantics of each agent. Since a universally accepted model for all spatial relations does not exist at this point, agents should be provided with guidelines about the use of spatial relations. This could be achieved by Spatial Query Languages that permit only certain kinds of spatial constraints with well-defined semantics (Egenhofer, 94; Papadias and Sellis, 95). Although such languages may restrict expressive power, they could provide the foundation for a common set of constraints that facilitates satisfiability checking and query processing.
1
Randell et al., (92) who defined the same set of topological relations using a logic-based approach, called this relation partially_overlap.
3
COLLABORATIVE CONSTRAINT SATISFACTION IN SPACE
After all qualitative constraints have been expressed in a single model, the problem of collaborative planing can be thought of as a constraint satisfaction problem with multiple goals: find one solution that satisfies all constraints, find all possible solutions, a number of possible solutions etc. If a solution that satisfies all constraints cannot be found, agents could be asked to reconsider their constraints and cancel the least important ones (obviously this can be an iterative process until a solution is found). Alternatively they could assign weights proportional to the importance of each constraint. Weights can also be assigned to each agent externally (by the some administrator) to reflect his/her significance in decision making. If an optimal solution does not exist, then the solution which satisfies the constraints with the highest weights may be acceptable. A number of mechanisms can used to solve spatial constraint satisfaction problems such as traditional Artificial Intelligence techniques (e.g., backtracking, local consistency checking Macworth and Freuder, 85) or Neural Network Approaches (McClelland and Rumelhart, 87). However, it is a difficult problem to develop a model that can express all types of spatial constraints and is capable of performing efficient satisfiability checking. Work on spatial constraint satisfaction problems has concentrated on homogeneous constraints, that is constraints of the same form (only topological or only direction relations). Even for such cases, a large class of problems is intractable (NP-Complete). Studies of consistency mechanisms for topological relations can be found in (Smith and Park, 92) and (Egenhofer and Sharma, 93). Furthermore, different semantics used by different agents can complicate problem solving significantly and render a problem from tractable to NP-Complete. As an example consider a set of agents reasoning about a set of contiguous regions without holes. Each agent imposes a simple topological constraint for some pairs of objects (e.g., one of the eight topological relations of the 4-intersection model). The unified model that expresses all agents’ constraints contains for each pair of objects either: 1. a null constraint (if no constraint for this pair has been imposed by any agent) 2. a single constraint (if only one agent has imposed a constraint for this pair, or if multiple agents have imposed the same constraint) 3. a conjunction of different constraints imposed by different users (in which case we have an inconsistency). Grigni et al., (95) have shown that the above problem is solvable by a polynomial path consistency algorithm. On the other hand, if some of the agents assume low resolution relations (e.g., they use the term overlap according to spatial access methods terminology) the same problem becomes exponential because the new meaning of overlap should be expressed by a disjunction of seven topological relations. Although constraint satisfaction problems are in general NP-Complete, the specific structure of the Spatial Domain could facilitate the development of efficient heuristics for Spatial Planning problems, and lead to polynomial algorithms for certain sub-cases. 4
QUALITATIVE SPATIAL ACCESS METHODS
Assume that the constraint satisfaction problems have been solved, and a set of consistent constraints has been found. The remaining step is to identify the actual land parcels in the area of Figure I that could be used for the new airport site. This involves a search in the (spatial) database of the form "find all land parcels east of the first lake, and north of the major urban area, and ....... However, most of the work on Spatial Access Methods has focused on window queries and does not support efficient processing of qualitative constraints. Only recently it has been shown how alternative indexing methods can be used to efficiently retrieve objects that satisfy certain topological, direction and distance relations (for samples of this work see Papadias et al., 1995; Theodoridis and Papadias, 95). This work provides the basis for database search in qualitative collaborative planning in space. In our example, the output of the database search is a set of potential candidates out of which only a subset could be used for the new site. This is due to some unforeseen constraints that were not predicted by the agents because of data quality issues. For instance, the agents may have not been given all the information about the area, or they did not take it into account during the
decision making process. Missing information possibly includes land parcels occupied by local industry, rivers and in general all areas inappropriate for airport sites. One may argue that the decision making process could go directly to the database search phase without passing through satisfiability checking mechanisms. However, this is inappropriate. Spatial databases and GISs usually contain large volumes of data and search is very expensive because of large 1/0 load. The satisfiability mechanisms basically provides a fast filter step that recognises inconsistencies in the constraints themselves, without extensive access to the stored data. In addition, a query optimizer that generates efficient query plans consistent with the imposed constraints, can be incorporated as a part of the satisfiability mechanism. In the extreme case where the database search fails and no potential sites are found, a new set of constraints should be used for the search. This is achieved by the satisfiability checking mechanism either by relaxing some (unimportant) constraints or by asking the agents to impose new ones. 5
CONCLUDING REMARKS
We believe that qualitative collaborative planning in geographic space is significant for a number of reasons, the most important of which is the fact that people usually communicate spatial knowledge by use of qualitative relations rather than absolute coordinates. In this paper we have outlined several concepts and problems that need to be dealt with, before qualitative collaborative planning becomes a reality: •
the lack of universally accepted semantics for spatial relations
•
the need to translate the perspectives of the different agents into a single model
•
the development of efficient algorithms that take advantage of the special structure of the spatial domain.
•
specialised spatial access methods used for the efficient processing of qualitative constraints.
Figure 3 illustrates the process of qualitative collaborative planning in space as described in this paper. In an ideal environment all the processes will be automated and the only human intervention will be the constraints imposed (and revised) by the agents. In the initial phases of such a project though, an administrator is necessary to organise the process and communicate potential inconsistencies to the individual agents.
Qualitative collaborative planning in space is an interesting topic that involves several domains such as Query Languages, Constraint Satisfaction and Access Methods. Although solutions at this time are not straightforward, we believe that its significance and the range of potential applications poses a challenge for future work on this topic. ACKNOWLEDGEMENTS We would like to thank Nikos Karakapilidis, Jayant Sharma and Rashid Mohamed Shariff for providing useful comments on earlier drafts of this paper.
REFERENCES Egenhofer, M. "Reasoning about Binary Topological Relations". In Giinther, 0. and Schek, H.J. (eds.) Advances in Spatial Databases. Second Symposium, (SSD). Springer Verlag LNCS, 1991.
Egenhofer, M., Sharma, J. "Assessing the Consistency of Complete and Incomplete Topological Information". Geographical Systems, Vol. 1, pp. 47-68, 1993. Egenhofer, M. "Spatial SQL: A Query and Presentation Language". IEEE Transactions on Knowledge and Data Engineering, Vol 6, no 1, pp. 86-95, 1994. Frank, A.U., "Qualitative Spatial Reasoning about Distances and Directions in Geographic Space", Journal of Visual Languages and Computing, Vol. 3, pp. 343-371, 1992. Grigni, M., Papadias, D., Papadimitriou, C. "Topological Inference". In the Proceedings of the International Joint Conference of Artificial Intelligence (IJCAI), Montreal, Canada, 1995. Hirtle, S, Jonides, J. "Evidence of Hierarchies in Cognitive Maps". Memory and Cognition 13, pp. 208217, 1985. Mackworth, A, Freuder, E. "The Complexity of some Polynomial Network Consistency Algorithms for Constraint Satisfaction Problems". Artificial Intelligence, 25, pp. 65-74, 1985. Mark, D, Egenhofer, M, "Calibrating the Meaning of Spatial Predicates from Natural Language: Line Region Relations". In the Proceedings of the 6th International Symposium on Spatial Data Handling (SDH), Edinburgh, UK, 1994. McClelland, J, Rumelhart, D. "Explorations in Parallel Distributed Processing". MIT Press (chap. 3), 1987. Leitner, M. "The Impact of Data Quality Displays on Spatial Decision Support". Software Demonstration, Science Day, NCGIA Board of Directors Meeting, SUNY, Buffalo, June 1995. Papadias, D., Sellis, T. "Qualitative Representation of Spatial Knowledge in Two-Dimensional Space". Very Large Data Bases Journal, Special Issue on Spatial Databases, Vol. 3(4), pp. 479-516, 1994. Papadias, D., Sellis, T. "A Pictorial Query-By-Example Language". Journal of Visual Languages and Computing, Special Issue on Visual Query Systems, Vol. 6(l), 53 -72, 1995. Papadias, D., Theodoridis, Y., Sellis, T., Egenhofer, M. "Topological Relations in the World of Minimum Bounding Rectangles: a Study with R-trees". In the Proceedings of the ACM Conference on the Modeling of Data (SIGMOD), San Jose, CA, 1995. Randell, D. A., Cui, Z., Cohn., A., "A Spatial Logic Based on Regions and Connection". In the Proceedings of the 3rd International Conference on Principles of Knowledge Representation and Reasoning, 1992. Smith, T., Park, K. "Algebraic Approach to Spatial Reasoning". International Journal of Geographic Information Systems, Vol. 6, No. 3, pp. 177-192, 1992. Theodoridis, Y., Papadias, D. "Range Queries Involving Spatial Relations: A Performance Analysis". Proceedings of the Second European Conference on Spatial Information Theory (COSIT), 1995.
Position Paper for Research Initiative 17 Thomas W. Pederson University of Pennsylvania This position paper addresses research topic five: "The characterization of CSDM processes, including but not limited to the specification of task models in various domains such as environmental, transportation, natural resource, economic development, emergency management, and other high priority subject domains; and investigations which elucidate the use of CSDM technology in various CSDM subject domains." Introduction Urban design, by its very nature, is highly collaborative and involves complex spatial relationships that exist in three dimensions. Decisions are made by multiple entities and effect large and diverse constituencies. Decision-makers must concern themselves with the form of the environment being created, its impact on what exists now, where the money will come from to build it, how it will affect the city's finances, and how the local citizenry will respond. The collaboration is hindered by the parochialism of the various professions involved, the differing analytical frameworks employed by those same professions, and a lack of a common vocabulary. While the microcomputer is employed in the process and has, to an extent, democratized access to these tools (Klosterman, 1992; Brail, 1987), most of these tools have remained largely inaccessible for use in collaborative situations. Much of this is due to the fact that most microcomputers were designed for individual interaction (Shiffer, 1995). Traditional Methods Urban design collaboration has take many forms, both active and passive. Suppose that a new development project has been proposed. Collaboration between two professionals for such a project, say architects and urban designers, might involve different design philosophies, but they are drawn from a shared knowledge domain. For input, they rely heavily upon maps, plans, sketches, hard-line drawings (both manually and electronically produced), scale models, photographs, and site visits. Output consists of much of the same. Generally speaking, the collaborative aspect is manifest during meetings in which designs are presented, discussed, modified through quick sketches or on a tracing paper overlay, and agreed upon. The solution is then drawn up with an increasing amount of detail as the project progresses. The process is a dynamic and iterative one and must often conform itself to constraints imposed by conditions at the site, the client's particular concerns, or by limitations of budget. Real estate professionals/developers working on the same project draw upon a different kind of shared knowledge domain, one involving economic models and market research. For input, they rely on large amounts of socioeconomic data, survey results, various economic indicators, sources of available financing, and the local political climate. Internal rates of return and the like take the form of spreadsheets, tables, descriptive text, photographs, and a number of other specialized tools that support these kinds of analyses. However, unlike an architectural rendering, this kind is output is difficult to depict graphically and explain to a lay person. Like the architects, this is a dynamic and iterative process, although the redesign that takes place is involves massaging the numbers-studying the effects of the financial restructuring that is necessary to make the project economically viable.
154
To the citizenry impacted by such a project, concerns arise not just relative to the design of a project, or its economic viability, but the effect of the project on their "community" as well. Input here takes on a completely different dimension because the domain shared is viscerally rather than knowledge based. The difficulty in defining "community" itself is indicative of the value-ladened nature of this information. A neighborhood, or town, or city, can mean many things to many people-yet there are strands of shared values that can be woven together and which can constitute an agreed upon "character." The cognitive blueprints, or mental maps, which people use to organize in daily life or for the sense of place which they ascribe to an area, has challenged researchers for years. Yet this is one of the inputs which individuals use in their decision-making process. Output might include a letter to the editor of the local newspaper expressing support or dissatisfaction with the project, involvement with a community organization or attending one of their public meetings to express views and concerns, or even going all the way to city hall. A resurgence of interest in the creation of human-scale communities has created a renewed awareness of the role and the importance of urban design. Further, it has been demonstrated that the kind of suburban development which typically takes place in this country has created enormous social, environmental and economic costs, which until now have been hidden, ignored, or quietly borne by society. Businesses suffer from higher costs, a loss in worker productivity, and underutilized investments in older communities. New Urbanism as a Collaborative Process An example of that interest which I've chosen to pursue in my research is known as Traditional Neighborhood Development and, as practiced by Andres Duany and Elizabeth Plater-Zyberk, involves a week-long "charrette"[1] which provides a setting in which all constituents-from municipal officials to interested citizens-can participate in the planning process. The charrette helps to educate the participants to different approaches, incorporates their contributions, verifies decisions and diminish the difficulties of the ensuing permitting process. The charrette establishes a full working office of five to 20 people on site, staffed with a small core of experienced Duany and Plater- Zyberk designers, working with local architects, landscape architects, historians, engineers, ecologists, and financial and marketing consultants. The charrette begins with a day of visits to the site and to nearby towns which might serve as models, and a presentation to the community of the principles of town planning. During the following days, the team, including the client, works day and night, meeting often with the local officials and advocacy groups, designing everything from the master plan to typical buildings, the codes, and specific landscapes. While it is of significant interest that this integration of urban design into the planning process facilitates more workable design concepts and the accompanying regulatory frameworks, more enticing is the charrette process employed-it is example of the kind of productive, collaborative process which people are able to participate in, if given the opportunity. Most of the process is based on the assumption that a greater degree of access to relevant information (with the ability to present that information in a variety of ways) will lead to the consideration of a greater number of alternative scenarios. Furthermore, the consideration of a greater number of alternative scenarios will lead to better informed public debate (Shiffer, 1995). Under the banner of "new urbanism" (because they base their work on principles known to the planners who, earlier in this century, created such communities as Scarsdale, New York, Mariemont, Ohio, and Lake Forest, Illinois), Duany/Plater-Zyberk have promulgated some
155
surprisingly simple and obvious rules for building better suburbs, redesigning existing suburbs, and redeveloping existing urban environments. They can be summarized in these five principles which are the foundation of Traditional Neighborhood Development (TND)[2]: 1. the neighborhood has a center and an edge; 2. the optimal size of a neighborhood is a quarter mile from center and an edge; 3. the neighborhood has a balanced mix of activities--dwelling, shopping, working, schooling, worshipping and recreating; 4. the neighborhood structures building sites on a fine network of interconnecting streets; 5. the neighborhood gives priority to public space and to the appropriate location of civic buildings (Duany & Plater- Zyberk, 1991). What's Needed The challenge, as I see it, is to actualize the theoretical goals of interface design for collaborative spatial decision-making within a real environment which generates new forms of physically defined communities in contemporary society. The interface should support and supplement, not supplant, these working processes. All to often the automation of a task leads to a redesign of the task itself. What the TND charrette process offers is an incremental design process that respects the complexity and diversity of urban life. The challenge is to combine electronic processes with traditional methods that will model, facilitate, and possibly extend this dynamic decision-making environment. Communication, in this context of the visualization of information, is about delivering symbols to an audience. A technology that can blend symbols from many different knowledge domains into a shared environment portends a potentially revolutionary change in the means of designing and distributing documents. The current state of interface design doesn't make it very easy for a novice to act intelligently, or accommodate varying levels of expertise, or express a multiplicity of content--to produce any value for collaborative decision-making. Urban design is a highly collaborative process that relies heavily on spatial decision-making and spatial relationships. The use of GIS in this process allows the recording of new types of information, the linking of data from disparate sources, the provision of more timely information than ever before, and opens new possibilities for understanding environments and communities that planners and researchers have only begun to see. An interface created to support urban design, and in particular Traditional Neighborhood Development and the charrette process, should make it possible to pose informal queries about the existing and future conditions of a particular location and quickly visualize and quantify impact. It should employ GIS and other analytical tools to facilitate syncretic solutions. After focusing primarily on the structure and development of the tools themselves, the GIS research community must now address the use of those tools. Structuring the use of the tools themselves should allow users to exploit the power of GIS and related information systems. A successful urban design interface would allow the users address the task in the substantive concepts associated with the problems they're facing, and at the same time facilitate the communication needs of transdisciplinary users with their attendant conceptual frameworks and skill levels. Notes [1] A charrette is a word that describes an intensive, continuous design session leading up to a presentation. It originally was used to describe the cart which architecture students at the
156
Ecole des Beaux-Arts used to carry all their materials through the streets of Paris on the way to their reviews. [2] Traditional Neighborhood Development is a set of urbanism principles created by the architecture and planning firm of Andreas Duany and Elizabeth Plater-Zyberk (DPZ) which were derived from DPZ s insight that our cities are segmented, our land uses segregated, our transport mechanized, and our public spaces fragmented, not because of economics or planning philosophies, but because our planning tools, especially the zoning ordinances, mandate it. Change the codes and you change the built environment, is the deceptively simple message of DPZ. To that end, DPZ s codes concentrate commercial activity, including shopping and working, in town centers. References Brail, R.K. 1987. Microcomputers in Urban Planning. New Brunswick, NJ: Center for Urban Policy Research. Duany, A., Plater-Zyberk, E. 1991. Towns and Town-making Principles. Cambridge, MA: Harvard Graduate School of Design. Forester, J. 1982. "Planning in the Face of Power," Journal of the American Planning Association, 48, 67-80. Shiffer, M. 1995. "Environmental Review with Hypermedia Systems," Environment and Planning B: Planning and Design, (forthcoming). Biography Tom Pederson received his Master of Science degrees in Historic Preservation and Real Estate Development from Columbia University. He first began studying urban applications for GIS in 1988 while employed at the architecture, planning, and urban design firm of Michael Kwartler and Associates in New York City. Currently, he is a doctoral student in the City and Regional Planning Department at the University of Pennsylvania under the supervision of Dr. C. Dana Tomlin. The working title of his dissertation proposal is "User Centered Task-Driven Interface Design for GIS." He is also currently a consultant to the City of Philadelphia's Office of Housing and Community Development assisting in the implementation of GIS in their Community Development Corporation's Strategic Neighborhood Planning program. This work involves the introduction of GIS concepts and analysis, principles of cartography and map design, the issues surrounding the quantification and mapping of place-based qualitative attributes, public access to GIS data via the World Wide Web, and strategies for the integration of neighborhood generated data into the structure of the city wide GIS.
157
CSDM and Public Participation in Biodiversity Conservation Planning James Proctor Department of Geography University of California, Santa Barbara 1. Background Biodiversity conservation and enhancement is a major component of much contemporary land-use planning. Biodiversity planning is inherently spatial, since decisions must be made as to where reserves, corridors, etc. are to be placed-in particular, how much land is to be set aside for biodiversity conservation, and what kinds of activities will be permitted in which locations. These decisions are typically complex and conflictual, owing to the unavoidable tradeoffs inherent in protecting or developing specific sites, and the differential impacts on various stakeholder groups. Increasingly, public involvement is becoming an explicit step in the decision- making process, as a means both of educating affected people as to the need for biodiversity conservation, and to solicit their preferences and ideas concerning possible alternatives for conservation. The variety of participating parties-private landholders, corporations, local, regional, and federal government, and the general public-involved in biodiversity conservation decisionmaking poses a challenge for design of systems that can facilitate collaboration among these groups. One very tangible geographical contribution in the area of biodiversity conservation planning involves the increasingly widespread use of spatially-based information systems (Davis 1995). For example, the California Resources Agency is building a networked computer information system called the California Environmental Resources Evaluation System, or CERES. CERES is designed to assist in natural resource planning, research, and education, and is currently focusing on supplying information for biodiversity planning in pilot projects distributed through the state. Spatial information has long been used by decisionmakers; in geography and GIS, a good deal of work in this area has gone under the rubric of spatial decision support systems, or SDSS (Gould and Densham 1991). Recently, some geographers have advanced a slightly different model of how information can be used in planning, under the name of spatial understanding support systems, or SUSS (Couclelis and Monmonier 1995). SUSS espouses a bottom-up mode of planning that explicitly recognizes the role of affected people, and anticipates that conflict is inevitable among these groups. SDSS and SUSS models point to the necessity of identifying workable designs for collaborative spatial decision-making (CSDM) systems that may play a crucial role in facilitating resolution of the extremely complex and contentious spatial allocation questions that have arisen in the case of biodiversity conservation planning. Following is a summary of two key sites currently involved in major biodiversity planning efforts which could serve as test sites for CSDM research and development: (a) federally-administered coniferous forests of the Pacific Northwest, and (b) the coastal sage scrub (CSS) zone of the south coast of California. 2. Study Sites Both the Pacific Northwest and the south coast of California have experienced significant landscape transformation in recent times, and are now the sites of major, nationally-recognized biodiversity conservation programs, which will undergo significant development, implementation, and modification in the near future. Geographic information is playing a central role in both of these programs: in the Pacific Northwest, one pilot project is testing its
158
application for community-based biodiversity planning (Doak 1994a), and the California South Coast region is one of the four pilot areas for the CERES project summarized above. Pacific Northwest forests have been the site of some of the most significant conflicts over biodiversity loss and conservation in recent U.S. history. The Clinton administration forest plan, known as Option 9, is in the process of being implemented. Its specific coverage involves public forests in Washington, Oregon, and northern California. A major component of the plan is to manage the region's federal forests so as to protect terrestrial and aquatic biodiversity associated with late-successional and old-growth forests (U.S.D.A.-U.S.D.I. 1994). Southern California is also the site of an innovative biodiversity conservation program, designed in part to avoid the serious conflicts between stakeholder groups that has plagued resolution of the Pacific Northwest dispute (U.S.D.I. and C.D.F.G. 1993). It is being jointly monitored by the state of California, which is piloting its Natural Communities Conservation Planning (NCCP) program in the coastal sage scrub zone of southwestern California (Davis, Stine, and Stoms 1994), and the U.S. Fish and Wildlife Service, which has recently listed the California gnatcatcher, a sage scrub-dependent species, as threatened under the Endangered Species Act (U.S.D.I. 1993a, 1993b). Some of the most advanced planning efforts in the coastal sage scrub zone have been undertaken in San Diego County. Two of these include the Multiple Species Conservation Program (MSCP) surrounding the San Diego metropolitan area, and the Multiple Habitat Conservation Program (MHCP) involving municipalities and county-administrated unincorporated land in the northwest portion of the county (Dudek and Associates 1994). One concrete outcome will be a Habitat Conservation Plan (Beatley 1994), a federally-approved means of coordinating land use with protection of the gnatcatcher. Both the Pacific Northwest and the south coast of California are socioeconomically diverse regions, with markedly differing views held on biodiversity issues by their inhabitants. Some representation of these diverse views is provided by the various public stakeholder groups participating in biodiversity planning efforts, such as environmentalists and timber industry supporters in the Pacific Northwest, and landowners, housing industry advocates, and environmentalists in California. The near future will be a volatile period in the development and implementation of biodiversity conservation plans in both regions. Although a good deal of planning has already begun, a number of details still need to be worked out, public agreement secured, and necessary regulatory documents (e.g., environmental impact statements) prepared. At the same time, national, regional, and local factors may have profound impacts on the overall process. For instance, the Endangered Species Act-the primary legal force behind protection of spotted owl and gnatcatcher habitat-is slated for reauthorization in the current Congressional session, and it could possibly be substantially weakened from its current form. At the regional level, fluctuations in economic health may have a serious impact on peoples' willingness to support biodiversity conservation programs, especially in southwestern California, where much of the habitat to be conserved must be purchased by means of some form of public revenues. At the local level, communities active in conservation planning will struggle to craft and implement alternatives that satisfy local interests as well as biological requirements. Another important feature of the Pacific Northwest forest plan and the NCCP process in San Diego County is that both have provisions to involve local communities in planning. In San Diego County, representatives from all affected communities sit on advisory boards for the overall MSCP and MHCP plans. It is likely that most communities will modify these planspossibly in substantial form-to meet local interests and needs. In the Pacific Northwest, Option 9 includes a provision to involve local communities in the forest planning process, and to encourage innovative and experimental ways to protect biodiversity while permitting a fair amount of logging to occur as well. The zones where these community-driven plans are to be formulated in the near future are called Adaptive Management Areas (AMAs). A total of ten
159
AMAs have been selected in Washington, Oregon, and northern California, ranging in size from 92,000 to 488,500 acres (Doak 1994b). 3. Research Interests The I-17 Call for Participation mentioned five specific topics of particular interest under this NCGIA initiative; all are clearly applicable in the case of public involvement in biodiversity conservation planning. Topics number four (identifying means to resolve conflicts over spatial decisions) and five (characterization of CSDM processes in specific domains such as biodiversity planning) are particularly relevant. A CSDM for biodiversity conservation planning would ideally facilitate a two-way, generally asynchronous flow of information between all significant members of the decisionmaking process: scientists involved in conservation modelling, policymakers attempting to translate scientific results into workable schemes, and the variety of public stakeholders-landholders, local residents, employees of affected industries, environmentalists, etc.-who have an interest in the final decision. Examples of this communication could include: visualization of biodiversity conservation alternatives as landscape scenarios in space and time; sketching and explaining areas of particular concern; positing and evaluating new, previously untried alternatives; posting and replying to verbal or graphical queries by other groups; representing the rationale for scientists' recommendations in a manner accessible to laypeople; and representing spatial and non-spatial characteristics of the varying popular attitudes and beliefs that bear upon biodiversity conservation. One research interest I have in this regard involves the potential applicability of a distributed, collaboratively-developed, visualization-based information system, which would represent a composite of spatial information commonly used in biodiversity planning, and the diverse forms of information the general public use to develop their positions on biodiversity conservation. The intent would be to provide a concrete and locally-meaningful basis for discussing biodiversity conservation options within and between various stakeholder groups. The relative abundance of spatial data in the biodiversity conservation planning efforts considered in the Pacific Northwest and California renders visualization a potential tool in CSDM. One challenge, however, is to translate this abundance of data into meaningful forms that can be grasped by most people. In the Pacific Northwest, relevant geographic data have been compiled in raster form (400 meter cell resolution) into a Spatial Unified Data Base (SPUD) for the Forest Ecosystem Management Assessment Team initiative that resulted in Option 9 (U.S.D.A.-U.S.D.I. 1993b). Much more geographic information exists, however, for some AMAs (Doak 1994b). In the case of California's South Coast, data are especially replete in San Diego County, through the efforts of the San Diego Association of Governments (SANDAG), which serves as the lead agency for the MHCP, and a primary technical subcontractor for the MSCP. SANDAG maintains the Regional Information System for the county, has used it to make a series of future projections through the year 2015, and also stores all georeferenced data on the MSCP and MHCP efforts (SANDAG 1993). Development and analysis of planning options, both for internal and external (e.g., Environmental Impact Statement) purposes, can build on these GIS databases, providing data to construct visualizations of future alternatives and their impacts. Visualizations of historical change can also incorporate existing GIS-based datasets, including vegetation maps developed between 1930 and 1940 for the state of California (Wieslander 1946), and a SPUD digital version of the 1936 survey of forestlands in Oregon and Washington. A possible method involves development of one collaborative visualization-based information system for a specific study site from each region, and expanding it based on stakeholder group feedback and developments in biodiversity conservation planning and implementation over time. Examples of initial major graphical components of the system could include (a) a map of the study area, with aerial still and video photography of the site and important components
160
(e.g., affected habitat and species) as available, (b) 2D comparative visualizations of short and longer-term historical changes in land use and vegetation/habitat for the local study site and its region, including temporally-referenced graphical economic, demographic, and habitat indicators, with 2.5D (terrain) visualizations developed for portions of study sites or study sites of smaller spatial extent, and (c) similar sets of visualizations depicting three or four biodiversity conservation planning alternatives, and their likely near-future (e.g., year 2010) impacts on the landscape and key indicators. Visualizations would be developed in consultation with several recent multiauthored discussions and reviews (Hearnshaw and Unwin 1994; MacEachren and Taylor 1994; Raper 1994) , which offer advice on their cartographic, cognitive, and technical dimensions. All components would be incorporated into a hypermedia-based information system such as ArcView to allow simple user navigation during interviews. 4. Initial Activities In preparation for the September 1995 I-17 planning meeting, I propose to spend one month this summer performing initial research on the potential of CSDM in biodiversity conservation planning in the Pacific Northwest and southern California (specifically, San Diego County). Principal activities include: (a) identifying and gaining background information on potential study sites within the two regions mentioned above, and discussing with decisionmakers possible CSDM contributions to the biodiversity planning processes taking place in these sites, and (b) developing a simple prototype visualization-based system as outlined above, to explore (together with decisionmakers) the kinds of functionality that could be implemented with existing software such as ArcView (this objective would necessitate advanced training in ArcView/Avenue, or provision of graduate research assistance skilled in ArcView/Avenue). Possible choices for study sites in San Diego County include Poway (1990 pop. 43,500), which has shown a relatively high degree of concern for land-use planning in the recent past, San Marcos (pop. 39,000), which experienced tremendous growth in the latter 1980s, and Chula Vista (pop. 135,000), which still has significant amounts of developable vacant land within its municipal boundaries. Possible choices in the Pacific Northwest include the Applegate AMA (277,500 acres) located south of Medford and Ashland in southern Oregon, which has a local resource management planning group that predates its AMA designation, and is the site of a proposed distributed spatial information network (Doak 1994a), the Central Cascades AMA (155,500 acres) east of Eugene, Oregon, which exhibits a wide and generally divisive spectrum of opinion among its nearby communities on issues of forest use, and the Finney AMA (98,500 acres) in south-central Washington, in which nearly 90 percent of its area consists of late successional/old-growth forests or owl habitat. 5. Biographical Information Dr. Proctor is Assistant Professor in the Department of Geography at the University of California, Santa Barbara. He holds a M.S. in Environmental Science and Engineering, and a Ph.D. in Geography, from the University of California, Berkeley. His research interests focus on public conflicts over biodiversity loss and conservation in the U.S. Pacific Northwest and southern California, and specifically their ethical and ideological basis (i.e., the origin, content, role, and outcome of relevant popular attitudes and beliefs). Representative publications in this area include the following: Proctor, James D. 1992. The owl, the forest, and the trees: Eco-ideological conflict in the Pacific Northwest. Ph.D. dissertation, University of California, Berkeley.
161
__________. 1995. Will the real land ethic please stand up? To appear in Journal of Forestry (93:9). __________. 1995. Whose nature? The contested terrain of ancient forests. To appear in Uncommon Ground: Toward Reinventing Nature, ed. William Cronon. New York: W.W. Norton. 6. References Cited Beatley, Timothy. 1994. Habitat conservation planning: Endangered species and urban growth. Austin: University of Texas Press. Couclelis, Helen, and Mark Monmonier. 1995. Using SUSS to resolve NIMBY: How spatial understanding support systems can help with the "Not in My Back Yard" syndrome. To appear in Geographical Systems. Davis, Frank W. 1995. Improving biodiversity data and information flows among scientists, policy makers and managers. To appear in Bioscience. __________, Peter A. Stine, and David M. Stoms. 1994. Distribution and conservation status of coastal sage scrub in southwestern California. Journal of Vegetation Science 5: 743-756. Doak, Sam C. 1994a. Enhancing local capacity to use spatial information in ecosystem management. Pacific GIS, Portland Oregon, October. __________. 1994b. Preliminary report: Adaptive Management Areas status and needs assessment. Pacific GIS, Portland Oregon, October. Dudek and Associates, Inc. 1994. Phase I MHCP Executive Summary. Prepared for San Diego Association of Governments, May. Gould, Michael J., and Paul J. Densham. 1991. Spatial decision support systems: A bibliography. National Center for Geographic Information and Analysis Technical Report 919, June. SANDAG. 1993. Regional information system overview. San Diego Association of Governments, December. U.S.D.A.-U.S.D.I. 1993a. Draft supplemental environmental impact statement on management of habitat for late-successional and old-growth forest species within the range of the northern spotted owl. Portland, Oregon: U.S. Forest Service and Bureau of Land Management. __________. 1993b. Forest ecosystem management: An ecological, economic, and social assessment. Report of the Forest Ecosystem Assessment Team, July. __________. 1994. Final supplemental environmental impact statement on management of habitat for late-successional and old-growth forest species within the range of the northern spotted owl. Portland, Oregon: U.S. Forest Service and Bureau of Land Management. U.S.D.I. 1993a. Determination of threatened status for the coastal California gnatcatcher; final rule. Federal Register 58(March 30): 16742-57.
162
__________. 1993b. Proposed special rule to allow take of the threatened coastal California gnatcatcher. Federal Register 58(March 30): 16758-59. U.S.D.I. and C.D.F.G. 1993. Coastal California gnatcatcher and natural community conservation planning. U.S.D.I. Fish and Wildlife Service, California Department of Fish and Game, October. Wieslander, A.E. 1946. Forest areas, timber volumes and vegetation types in California. California Forest and Range Experiment Station, Berkeley Forest Survey Release No. 4.
Trivial Pursuit and a Few Suggestions Rene F. Reitsma University of Colorado at Boulder Center for Advanced Decision Support for Water and Environmental Systems (CADSWES) Campus Box 421 Boulder CO 80309 - 0421 e-mail:
[email protected] 1. Trivial Pursuit? Thinking about collaborative decision-support makes me nervous. I know, very few people are likely to care or to be even remotely interested in me being nervous, but the whole concept of collaborative decision support throws me for a loop. For crying out loud! I am still trying to find out what "decision support" in general is, and whether or not it is anything at all! This is indeed very frightening, especially since I pretend to make a living off of the design, development and implementation of (environmental) decision support systems (DSS). But then again, I've always been a little slow. Collaborative spatial decision support. Ok. So there's three aspects to this thing: · decision support, · space, · collaboration. Perhaps the three aspects are related in some sort of set-theoretical way. Something like: collaborative spatial decision support is decision support for spatial problems which require collaboration. Hmm, not bad. (with that I mean that I can still follow; you see, a child's hand is easily filled). Now the "spatial" part does not seem to be too hard. Although many decision problems have a spatial components, in most cases that spatial component is not very interesting. I mean, the fact that the Colorado river is located somewhere, is rather irrelevant when it comes to deciding how much water to release from Hoover Dam, except that the locational aspects are figured into the equations which describe the time the water needs to travel from its point of release to its point of consumption. Similarly, the fact that an instream flow right is established at a particular reach of a river is relevant in that it figures into the equations which express the flow over time at that and other locations on the river, but the 163
spatial aspect of a problem such as this is at best one that functions as a constraint on the decision to be made. That is, if indeed the decision problem involves the determination of a release or diversion schedule, and the spatial aspects are given. Spatially much more interesting are problems of a locational nature; for example, decisions as to where to establish that in-stream flow right, or whether to change temperature regimes below Lake Powell in order to sustain certain fish species. Does the latter type of problem; the problem where space is to be considered a resource to be allocated among subjects or objectives associated with subjects, constitute an interesting, or better, "rich" enough set of problems to consider them "spatial" problems? Well, perhaps. Certain spatial location and allocation problems seem complex enough from a spatial point of view to warrant special attention, spatial modeling, support and consulting. However, in many cases the spatial aspects seem rather trivial when compared to the other, non-spatial aspects of even spatial problems. For instance, the allocation of a particular space to, say, residential versus open space objectives (hiking, biking, recreation, wildlife, etc.) could, under certain circumstances be considered spatially trivial. It's zoned A or B or, in the most complex case, some of it will be zoned A and some B. What really matters in those circumstances, is how a complex array of objectives, both momentarily and relative to the future (strategic, tactical) interact with a) (perceived) opportunities for satisfying these objectives and b) with each other. 2. Coordination Theory Perhaps? Coordination theory (e.g. Mallone and Crowston, 1990) provides a framework of studying these interactions between objectives, actions, and resources. The theory (I really need to start cranking at this stuff, especially since I'm in the process of writing a paper about it(!)), provides an integration of elements from game theory, operations research, and various aspects of decision-making, negotiation, and collaboration. One of its central concepts is that of harmonious work, or harmonious action. Harmonious actions are defined as actions which jointly increase utility in terms of the satisfaction of objectives. The actions can be mapped in action or decision space. Different regions of the space have different values for various objectives. Trajectories through areas which have high utility values for joint objectives can be labeled harmonious. Clayton Lewis (University of Colorado at Boulder - Computer Science) and myself, are currently working on a framework which extends the basic notion of harmonious behavior to cases which involve conflicting objectives. We aren't quite sure yet whether or not we are trying to prove things by just changing the definition of harmony (something which would make Popper turn around in his grave (rest his soul)), or whether we are really on to something, but the idea is that even in cases where objectives are clearly conflicting, harmony is possible, albeit in terms of increase in efficiency only. The notion of conflicting objectives also necessitates the distinction between stable and unstable harmonies. Harmonies might be established through increased efficiency (dictatorships and swindles are good examples), but such harmony, although momentarily preferable, is unstable in that sooner or later the swindle is revealed, the dictatorship becomes unbearable, or, more interesting, the environment changes such that the values of resources allocated to the various objectives change. Examples of the latter are the re-evaluation of city-centers leading to such processes as gentrification, or the suburbanization of the Colorado Front Range, an area where not long ago not many people wanted to live, but where growth seems nowadays to be almost out of control. Whether coordination theory is an applicable research topic for I17; we can talk about that. Spatially, applications could be possible in mapping conflict vs. harmony, or degrees of harmony in space. This would be particularly interesting if the utility functions which would
164
compute the valuations of space as a consequence of a series of actions (policy alternatives) could be dynamically linked with their mappings into space. Note that in these cases harmony would not be computed as a simple compensatory model of momentary objectives. Harmony rests in the process and the valuations of its intermediate steps or moves relative to objectives, not the end-result. From a non-spatial point of view, coordination theory offers at least a means of formalizing collaboration, in terms of harmonious or inharmonious actions and their valuations relative to one or more objectives. Although it remains to be seen how complex these formalizations must be in order to adequately represent the salient features of, for instance, environmental negotiations, it does at least provide a conceptual schema for an attempt to do so. On this latter point, coordination theory could perhaps be seen as (yet?) another attempt at operationalization of the well-known Brown-Moore model of (spatial) decision-making (Brown and Moore, 1971). One of more fascinating aspects of that model was that valuations of empirical (spatial) situations is the result of a dynamic, complex interaction between 1. objectives, 2. means to satisfy these objectives, and 3. the opportunity to modify the environment or context which provides these means and shapes the objectives. I know, lots of folk thought the stuff was trivial and rather frivolous, but I've always been fascinated by the incredible difficulty of operationalizing such a simple model. Coordination theory, by nature of the way it tries to represent these three aspects, provides remarkable insights into, especially the third alternative, that of modifying the environment thereby opening up whole new areas of the (previously hidden or unattainable) decision space and hence opportunities for collaboration. 3. New Modeling Paradigms Perhaps? Something which has been bugging me for a while now, is the use of mathematical models of the physics of environmental resources for environmental decision making. As part of a study into the role of simulation models in environmental negotiation, Ilze Zigurs (University of Colorado at Boulder - College of Business), Clayton Lewis and I have · conducted experiments were we had subjects resolve a water resources allocation problem supported by a simulation model of the resource under various policy alternatives. We experimentally manipulated the conditions under which that model could be used, both in terms of frequency and private vs. group access (Reitsma et al. 1996). · conducted a detailed study into the use and role of the Colorado River Simulation Model (CRSM - Schuster, 1987), in the determination of the Colorado River Annual Operating Plan (AOP). Where the results of the former seem to indicate that making the model more and easier accessible did hardly contribute to the quality of the problem solutions and the resolution process (both objectively and as perceived by subjects), the latter revealed that although the model maintains a central place in the negotiations, the vast majority of negotiations are about aspects of river management which are not in the least represented by the model! Yet, all participants in the AOP process want increased accessibility to the model, and significant system development and modeling are underway to comply with these requests.
165
Assuming that these observations and generalizations are correct, the only way in which we can explain these results is in stressing: 1. the managerial role of models in environmental management; i.e. the model as a managerial tool, a tool for establishing due process in the negotiations, regardless of the model's correspondence, and 2. reliance of participants common knowledge and reasoning capabilities to evaluate the really relevant aspects of policies. In other words, although the model provides some sort of rational, impartial, formal core to arrange a negotiation around, many of the real objects of negotiation are not modeled at all and are dealt with on an ad hoc basis. Interestingly, in the paper on coordination theory (in preparation) we argue that the latter forms a nice example of harmonious behavior in that the instigation of the AOP process itself changed the context of collaboration such that more harmonious behavior was possible. Based on these observations, the following research questions could be thought of: 1. Validating physical models in collaborative (or negotiation) settings. Our results show that the value of these models in collaborative and/or multi-objective settings is low, except from the point of view of providing (quasi) rationality to the process. Yet, vast amounts of resources are spent on the development of these models (yes, yes, mea culpa). Question: can this claim be upheld? In other words, what is the role of these models, and how does the rationality of the models correspond with the rationality of negotiations, disputes, or policy making? 2. If it is true that physical models represent so little of the true aspects of many decision problems in, for example, environmental decision making, could those aspects be modeled differently and ought they be modeled? What other modeling paradigms are there which could contribute to the construction of better decision-making models? 3. Is it possible to develop other types of environments (e.g. GDSS, computational planning games (see below) which better support complex decision making? 4. Perhaps Computational Gameboards? For a while now, Ernesto Arias (University of Colorado, Dept. of Planning and Environmental Design), is trying something different. He develops planning games; board games with boards (space) and pieces (choice attributes) and rules (rules of process), and uses these games to support collaboration among policy and decision makers, especially in the context of physical planning. Recently, Ernest let me in on a plan to develop an interactive, computational gameboard for spatial planning. The idea is that of an interactive computer monitor/screen, tilted on its back, projecting upward onto a large "gameboard" (the technology would work a bit different, but that's the basic idea). Unlike a computer screen, the gameboard would allow people to walk around it, put game pieces on it (add a third dimension), use it as a working environment, etc. But unlike a traditional gameboard, it would be interactive and would dynamically adjust to the situation of the game. Although the former is approached in GDSS decision rooms with screens projected on the walls of the room, we expect that the simple availability of the "screen" as a flat space so that it can be used as a table or desk, or more important, that the space represented by the gameboard can be extended with threedimensional pieces, may dramatically increase computers' propensity to serve as a collaborative decision-making tool.
166
When Ernest and I started to work out the idea some more, it appeared that one of the things that was more or less missing in all of this, was a theory of why these gameboard planning environments could work, and ideas on how to (experimentally) evaluate that theory and modify the games accordingly. Since we started working on this we have made progress in these areas and hope that soon we will be able to test some of the theory out in experimental settings. 5. Does it make a difference? One of the things we badly need in environmental decision support (collaborative or not) is methods and techniques for the evaluation of the effectiveness and efficiency of DSS. Yes, we can easily keep track of system use (although it is often very hard to control these data for frivolous use and mistakes in use (clicking the wrong button, that sort of thing), and we can go back in after a system has been on-line for a while and ask people whether they like it, what else they want and whether or not they use the darn thing. But assessing real utility often is a matter of letting the market take its course. If they come back for more, than it must be good! Needless to say that although such evaluation can sometimes be handy (isn't it great to tell others that you just got another 900K in DSS development money?), success or failure of a DSS often rests in quite different measures. Unfortunately, little evaluation of at least environmental DSS is ever conducted. In most cases, when people are happy about the product they do come back and ask for more features, additional modeling, etc. But an assessment of how much the DSS has contributed to organizational efficiency, internal communication, or savings in or modified distribution of, for instance, water resources, often lacks. Note that this issue has ties with the issue of the utility of models for decision support; namely the question: does it make a difference, and if so, how so and how much? It is interesting that as geographers or social scientists we spend so much effort evaluating the effects of policy and or the changing landscape of geographical patterns and processes. Yet, at the level of decision support we are often content with simply putting the thing together, throwing it over the wall, and hey presto, another branch on the tree of bleeding (!= leading) edge of technology. I feel that if research initiatives are developed which are aimed at developing collaborative decision support tools, at least some amount of resources ought to be spent on the systematic evaluation of those tools in practice. This requires the development of evaluation techniques and metrics, as well as the development of data representation schemes which efficiently represent system use information; e.g. in the form of sequences of use. Much of this work has already been addressed in Group Decision Support Systems (GDSS), but it can be argued that in the context of dynamic, physically based systems such as environmental systems, this question needs to be looked at. Such development of evaluation methodologies also applies to the use of system design methodologies. Although more an issue of software engineering in general, many of us who have developed systems before, have used different methods of designing, developing and implementing (fielding) systems. Some we liked, some we didn't. But as so many writers on software engineering point out, few of us can clearly articulate how we developed our systems, let alone provide clear statistics and measures of the system design and development process. What we should not forget, however, is that software systems are complicated pieces of (logical) machinery, for which people often pay sizeable amounts of money and which are expected to play important roles in organizations. As such, they deserve scrutiny in design,
167
development and implementation. Although in most engineering and sciences there is a clear distinction between the academic phases of new technology and those were the new technology goes into production; each with their own internal and external metrics of quality assurance and control, in decision support the distinction is often blurred. This leads to an often very messy situation, in which academics see themselves confronted with system development tasks that they really do not want to conduct, the more so since the relationship between effort required to build a software system well and the academic credit received for such efforts is such that many systems are "thrown over the wall" or abandoned in prototype state, a situation which is most annoying for all involved in the project. One perspective of design and development methodologies is that they should represent the results of some of the research questions formulated here and elsewhere in the position papers. Design methodologies can be seen as the engineering aspects of building collaborative decision support tools. If the science behind is any good at all, it must be possible to translate the scientific results into concrete methodologies for system design and development. Seems like an excellent way "making a difference". References Brown, L.A., Moore, E.G. (1971) The Intra-Urban Migration Process, a Perspective; in: Bourne, L.S. (ed.) The Internal Structure of the City; Oxford University Press; New York; pp.200-209. Malone, T.W., Crowston, K (1990) What is Coordination Theory and How Can It Help Design Cooperative Work Systems; ACM CSCW 90 Proceedings; pp.375 - 388. Reitsma, R.F., Zigurs, I., Lewis, C., Sloane, T., Wilson, V (1996) Experiment With Simulation Models In Water Resources Negotiations: ASCE Journal of Water Resources Management and Planning; forthcoming. Schuster, R.J. (1987) Colorado River Simulation System Documentation. System Overview; U.S. Department of the Interior, United States Bureau of Reclamation, Denver, CO.
168
Issues of Collaborative Spatial Decision-Support in City Planning Contexts Michael J. Shiffer, Ph.D. Department of Urban Studies & Planning Massachusetts Institute of Technology 77 Massachusetts Ave. Room 9-514 Cambridge, MA 02139 Phone: (617) 253-0782 Fax: (617) 253-3625 Email:
[email protected] Introduction This position paper is intended to illustrate a particular approach to a study of Collaborative Spatial Decision-Making (CSDM) that focuses on city and regional planning contexts. While this approach is related to many of the topics mentioned in the Open Call for Participation, it is most closely related to topic 2 (...design and implementation of methods to improve decision-makers' interaction with spatial analysis tools...), and topic 5 (...the characterization of CSDM processes...). Rather than provide an exhaustive review of the relevant literature, this paper will describe a group decision support context from the perspective of personal experience with research in this area. City Planning Settings The focus of this research involves face-to-face meetings of people involved in discussions with a spatial emphasis in city planning settings. The use of information in these situations frequently involves recollections about the past, descriptions of the present, and speculation about the future. This is most often conveyed using the cognitive information provided by the meeting participants and may be augmented using various media and tools. Spatial representations such as maps, typically provide a central organizing metaphor. For example, in many planning situations people will gather in a room, spread a map on a table, point to areas, and verbally recollect, describe or speculate. At times, these discussions will be augmented with documentation or imagery. In other cases, they will be augmented with analytic tools. Recollection of the Past In recollecting the past history of a given site or planning issue, conversations may revolve around what was said, what was done, or what a place was like among other things. For example, members of a group may try to recall the impact of past interventions on an urban landscape to better understand what may lie ahead given similar circumstances. Where the recollection is about fairly structured recent activities, (such as past planning meetings), the conversations can be augmented with records and systematic documentation of past interactions. However, access to this information is frequently not random and can be dependent on a specialized information recording and retrieval "system" such as a meeting secretary or stenographer. Furthermore, such methods of recollection rarely incorporate spatial referencing (using such things as historical maps). Where a systematic documentation is lacking, as with recollection of the past environmental conditions of an area, the high degree of 169
dependence on human memory can lead to problems based in the inconsistency of individual memories. This is exacerbated by the fact that personal points of view tend to be subjective. For example, someone may recall traffic on a particular street to have been particularly heavy, while another may think of the same stretch of roadway as lightly traveled. Where there is a lack of documentation or data to support these recollections, arguments related to inconsistent memories are likely to persist. These arguments can dominate a discussion and shift the focus of a meeting from the matters at hand. GIS support of recollection in collaborative contexts has been somewhat limited due to a number of factors including fairly weak historical references. While GIS (in combination with historical data) can indeed be used to facilitate recollection about characteristics such as demographic trends, property values, and other generalizable information, it is less adept at conveying the past character of an area. Furthermore, using this technology to assist recollection depends on systematic archival of spatial "snapshots". Descriptions of the Present Descriptions of present conditions are generally used to familiarize participants in a collaborative situation with the area being discussed so that everyone can work from a common base of knowledge. These descriptions frequently involve some sort of spatial referencing. While many of these references are verbal, (i.e.: "over by the river", "on the site of the former factory"), such references become increasingly inappropriate as the level of familiarity with the site on the part of meeting participants is lacking. For example, the term "on the site of the former factory" is completely meaningless to meeting participants who are unfamiliar with the area being discussed. The lack of familiarity with a given site in the context of a description of existing conditions can be aided through the use of an up-to-date map that is used as a central reference point. Individuals describe present conditions verbally and augment this by gesturing to a map spread on a table or tacked to a wall. Such descriptions may be further augmented using thematic data and visual imagery. The thematic data may be provided in the form of land-use maps, or demographic conditions of an area. Visual imagery may include photos or video tape of selected sites. The juxtaposition of the above media can strengthen a collective understanding of the various characteristics of a given site. Until recently, GIS has been unable to effectively support descriptions of existing conditions due to issues of speed, human interface and integration with other forms of media. While many of these issues are being addressed using modern GIS tools that take advantage of inter-operability and component software, the techniques for the effective juxtaposition of this information for retrieval in collaborative contexts need to be further developed. Speculation About the Future Speculation about the future of an area involves experienced individuals extrapolating measurable phenomena from past experience and applying it to the future using informal mental models. A much more formalized mechanism for such speculation (some may call it prediction or modeling) has been made available to collaborative processes through the use of computer-based analysis tools, and most recently GIS. Augmentation of collaborative settings with analytic tools such as GIS has traditionally been handicapped by a lack of immediate response, and abstract output that tends to exclude from such conversations those who are not technically-sophisticated. A degree of immediacy in response to user queries about alternative scenarios can be afforded through the implementation of direct manipulation interfaces. Such interfaces translate human desires into 170
commands that the computer can understand. Multimedia representational aids support information flow in the other direction by augmenting numeric values with graphical representation and associated imagery to transform abstract data into concepts that the human can understand. Both direct manipulation and multimedia representational aids have been made possible by recent increases in computing power available to the masses. While the tendency to apply such power to the undertaking of previously unattainable analyses is important, the ability to improve the communicability of existing analysis tools, especially in collaborative contexts, should not be overlooked. Augmentation of Planning-related Conversations To better support these activities it is important to develop a conceptual and practical means of implementing emerging technologies so that cognitive information can be effectively augmented. Such augmentation can be facilitated using both a spatially-referenced associative information structure and a directly manipulable mechanism that affords multiple representations of future scenarios in a spatial context. Spatially-referenced associative information structures, (such as those now made possible through the modularization of WWW and GIS tools), can aid in the description of past and present conditions by providing a means of juxtaposing maps, imagery and other relevant information in a manner that can effectively augment conversations. The employment of directly manipulable analysis tools with multiple representations of otherwise abstract data has the ability to bring a level of analysis into conversations about future scenarios that is significantly more robust than the mere speculation afforded to many collaborative settings. Furthermore, desktop video conferencing and collaborative software has the ability to include individuals who would have otherwise have been excluded from such conversations. Nonetheless, the employment of these technologies alone is not enough to ensure successful augmentation of planning-related conversations. A deeper understanding of the nature and structure of human communication in these settings is necessary to provide a starting point from which one can begin to pose relevant CDSM-related research questions. What follows are some opening questions and issues that can hopefully clear the way to such investigations. Issues and Questions for Research How does this technology change the balance of power in planning settings that are collaborative in nature? Access to these tools (or a lack thereof) may put certain parties at a disadvantage. Access is more than having a machine available running relevant software. It also involves having an understanding of the information base and functionality of the software contained in the machine. While policies of equal access may look good in writing, such a balance may be difficult to strike. This research has the ability to enlighten others about which levels of access are easily attainable, which are difficult, and how to determine the level of infrastructure and knowledge necessary to attain the desired level of access. How does it change the way people interact in the context of face-to-face communications? The availability of broadly manipulable tools in group planning contexts can lead to the consideration of a much broader range of alternative scenarios. While one might argue that this can lead to better-informed conversations, it can also make it difficult (or impossible) for a group to reach consensus. Furthermore, while multiple representations may minimize arguments based on "apples and oranges", they can also confuse or mislead. Just as this technology has the ability to create compelling representations of spatial scenarios, it has the ability to create compelling misrepresentations. While this issue is not new to spatial analysis, it can be exacerbated through the use of multiple representations in collaborative contexts, therefore it is important to understand the potential pitfalls of unintentional misrepresentation so that measures can be taken to minimize it. 171
How can these tools be effectively, inexpensively, and fairly delivered to the contexts that can best benefit from their use? Modular tools with spatial referencing (such as GIS components combined with WWW client and server software) are a step towards the effective delivery of a mechanism that augments recollection, description and speculation. However it is still necessary to develop conceptual designs so that these tools can be properly implemented. Such designs can result from an iterative process of observation, development, testing, and feedback. Finally, evaluative mechanisms need to be developed that provide feedback about where these computer-based tools fall short in their design, implementation and execution. Such mechanisms will have the capacity to expose whether the use of planning support systems such as these can lead to better-informed conversations, planning, and/or decision making. The best way to address these questions is through collaborative research initiatives such as that which is proposed here. It is hoped that such interactions can lead to a broader understanding of the methods, tools, and techniques used by others in previous and ongoing research. Biography Michael J. Shiffer is on the faculty of the Massachusetts Institute of Technology Department of Urban Studies and Planning as a Lecturer and Research Scientist. There, he teaches courses in analytic methods and new and emerging technologies for planning and decision support. Shiffer investigates how information technologies (such as multimedia, video conferencing, and world-wide networking) can better inform public debate and decision making with a specific focus on geographic information. Shiffer received his Ph.D., and Master's of Urban Planning, from the University of Illinois at Urbana-Champaign. Shiffer has had additional training in communications, human-computer interaction, and psychology. He has earned a Bachelors degree in Geography from De Paul University in Chicago. In addition to his academic work, Shiffer consults with a variety of public and private agencies on information technology and communications issues. He is an active professional speaker and author on the application of information technology in the area of city planning and development. Relevant Publications & Papers Shiffer, M.J., (1995) "Multimedia Representational Aids in Urban Planning Support Systems", in Marchese, F. (ed.), Understanding Images, (New York: Springer-Verlag), pp.7790. Shiffer, M.J., (1994) "A Geographically-Based Multimedia Approach to City Planning", in Plaisant, C. (ed.), Human Factors in Computing Systems, (New York: Association for Computing Machinery), pp.265-266. Shiffer, M.J., (1993) "Environmental Review with Hypermedia Systems", in R.E. Klosterman and S.P. French (eds.), Proceedings of the Third International Conference on Computers in Urban Planning and Urban Management, vol. 1, pp. 587-606 (also forthcoming in Environment and Planning B: Planning and Design, volume 22).
172
Shiffer, M.J. and Wiggins, L.L., (1993) "The Union of GIS and Multimedia", in Castle, G.H. (ed.), Profiting from a Geographic Information System, (Ft. Collins, CO: GIS World, Inc.), pp. 336-341. Shiffer, M.J. (1992) "Towards a Collaborative Planning System", Environment and Planning B: Planning and Design, volume 19. pp. 709-722. Wiggins, L. L. and Shiffer, M. J. (1990), "Planning with Hypermedia: Combining Text, Graphics, Sound, and Video", Journal of the American Planning Association, Spring, 1990. pp. 226-235.
Position paper for I-17 Dr Stephen J. Carver (
[email protected]) Dept of Geography University of Leeds, Leeds, England Dr Ian Heywood (
[email protected]) Dept of Environmental & Geographical Sciences The Manchester Metropolitan University, Manchester, England Steven J. Tomlinson (
[email protected]) Dept of Environmental & Geographical Sciences The Manchester Metropolitan University, Manchester, England This is a position paper for Initiative 17: Collaborative Spatial Decision-Making. We have been working on the use of computers as tools for spatial decision making in the following areas. 1. The development of Idea Generation Systems (IGS) which utilise the spatial exploration tools embedded within Geographical Information Systems (GIS) to enable a greater understanding of the use of spatial and non spatial information for decision making. 2. The development of prototypes which facilitate the use of meta spatial models to integrate data from existing spatial models(GIS and non GIS based). This allows a more detailed understanding of a problem domain to be constructed than individual models can supply and provides an overview of the consensus and conflict caused by the integration of the models. 3. Using the above ideas we have developed software prototypes for a variety of real world case studies in participatory decision making. For example, the "House Hunting Game" which uses Idrisi and Toolbook. 1.0 Introduction The development of computer systems which facilitate understanding and raise awareness of environmental problems are important to help us manage the environment in which we live.
173
This type of computer system which utilises spatial and non spatial data, will become increasingly important as more information sources become available along with the need to understand its impact on people, projects and the environment - this can be termed computer based spatial decision making. The use of computers to explicitly assist with spatial decision making is a relatively new occurrence. GIS are not complete decision making systems because they lack many of the requirements for decision making such as good user interfaces, modelling capabilities and so on (Densham, 1991, Heywood & Carver, 1994, Tomlinson, 1994). As well as the facilities that the GIS lack, they are not easy to use by non GIS specialists. Computer based spatial decision making should not be solely in the domain of the technical scientist who is adept at manipulating GIS and other software for research goals but should also be available for the less technologically proficient who makes the decisions or on whom decisions impact i.e. the policy or decision maker and the general public. Through the design of more appropriate computer systems which address the needs of the users, such as managers and decision makers, the use of technology for spatial decision making can be taken from the technical domain into the general domain. This will empower people to utilise the technology to make decisions and better understand their environment. 2.0 Issues in Collaborative Spatial Decision Making (CSDM) Prior to considering the uses and problems of CSDM it is first necessary to determine who the users of such systems are because this will impact upon how the systems should be developed and their eventual success. In the information systems literature, the integration of the potential users has been considered as a necessary part of the development of successful systems (Szajna & Scamell 1993, Lawrence & Low 1993, Wetherbe 1991, Joshi 1991). This is more so in the case of CSDM because the user is not a single identifiable person but potentially a group of people with a large "split personality". Thus, any system should be very easy to comprehend and use and be able to view problems from multiple perspectives which are dependent on the decision maker and problem domain. CSDM systems should be used as a medium of communication which enable the understanding and analysis to take place. Using a GIS, solely for such CSDM analysis is akin to looking through a fogged window. Through techniques of software linking, such as Object Linking and Embedding(OLE), Dynamic Data Exchange(DDE) and loosely/tightly coupled software applications, it is possible to construct working environments which aid spatial decision making. For example, we have linked Asymetrix Toolbook, Visual Basic and Idrisi(DOS). Such linkages form the core of supra applications which provide the decision maker with the necessary tools from disparate software applications in a single environment providing a more information rich environment. Systems constructed using such techniques are the " House Hunting Game" and the "Kirklees System" which are described later. The users, of our example systems, have been the general public and policy/decision makers at city council level. The development of CSDM systems requires a fundamental change in our approach to information management and use. If we are to use systems which enable multiparticipatory decision making, then these system must be easy to use and adaptable to various situations to enable the creative process of group stimuli and interaction to be transported into the CSDM system and give appropriate levels of feedback to the user(s). The CSDM must become part of the group and able to be used by all members to see what is happening and have control over the CSDM, this could be through a single user or multiple user interface systems.
174
One potential approach is that of the Idea Generation System(IGS). IGS is concerned with the development of CSDM systems to enable the decision maker to visualise their information in a dynamic environment which supports participatory decision making. Examples such as Sim City, integrate a variety of models and visually demonstrate change to the user. Environments which permit the decision maker to see what will happen given x or y and are then able to respond to such visual stimuli enable better decisions to be made through an awareness of not only the initial problem domain but of the impacts of their decisions on the problem. Methods employed in the "House Hunting Game", see later, are enabled by the development of such systems because multi user participation is produced whereby different people can take control of the IGS and thus impact upon the outcome or comment on other users of the system. The IGS is an attempt to focus the research not on the methods of using GIS but what is actually being done with the technology. Thus non GIS information, which is relevant to the decision making process such as user background, political or private agendas be incorporated into an IGS system to enable a more rounded approach to spatial decision making. The modelling of the world in mathematical terms, such as co-ordinates and attributes is a valuable operation but when trying to "map" such information for decision making, it becomes unstuck because it does not fully relate to the decision makers real world view. Other contextual information must be used to make sense of the data and information. Through the use of an IGS, areas of consensus and conflict could be examined and the impacts of changes to decisions investigated and responses seen. This type of approach will require that there is a change in the culture of using GIS/computer systems whereby the user(s) perceives that the CSDM contains all of the measured information as well as their biases they have brought to the solution. However, the use of IGS systems may prove problematic because it challenges the status quo of existing system usage in that the CSDM is used as a creative as opposed to supportive tool. An alternate approach, is that of the development of the meta spatial modelling system. A meta spatial model is a collection of the results of a series of other spatial models which can be integrated using for example, multicriteria analysis to determine a wider viewpoint of a problem domain(Heywood & Tomlinson, 1995). For example, an area could be modelled in terms of traffic flow, air pollution and noise pollution, these models could then be allocated quality measures and combined together with weightings determined by the user(s) using multicriteria analysis. Areas of conflict and consensus between the models could be produced and then used in decision making whether by changing the base models of the combination of the model results in the meta spatial model. The meta spatial model makes use of a Geographical Operating Environment(GOE) which enables access to spatial and non spatial data and the functions associated with the data files. For example, a common work area can be defined in which the user can visualise a spreadsheet and a map and apply functions to both data files from the applications which created them without having to use the individual applications directly (Tomlinson 1994). Such an environment allows the limiting of the functions available to those that the user require. Function overload is very much part of GIS. The meta spatial model is different from the IGS because it is specifically aimed at the development of systems which use modelling explicitly as the means of decision making. The IGS is a more flexible open ended environment which allows data/information exploration and is not specific to modelling as the means of decision making/analysis.
175
3.0 Real World Case Studies The proposals above, taken from various papers, have been prototyped in two forms the "House Hunting Game" and the "Kirklees System", these are described below. House Hunting Game - looking for a place to live To demonstrate the applicability of multiparticipatory decision making using multicriteria analysis we have developed a simple to use computer system which is based upon looking for a place to live(Heywood, Oliver & Tomlinson, 1995). Multicriteria analysis has been selected because it is easy to understand in a non technical sense and forms part of the Idrisi functionality and is immediately available for use, any other algorithm could be used. When selecting a location to live, we are faced by decisions on the neighbourhood, insurance level, location of schools, modes of transport and many other issues. This system has been presented at conference workshops where people are grouped into families. Each family is assigned a character type, such as old retired, young couple and so on which they use to determine how they view the area and ultimately perceive the data. The system developed, presents the family with a series of maps which represent the factors and constraints. The factors are numerous and include insurance and schools. For example the family may select to live in an area which has as low insurance price and is near a school. The constraints are for example "I don't want to live near a rubbish dump", "I don't want to live near a motorway". Once they have decided how the factors and constraints fit with each other, they can use the system to produce a map showing the best and worst areas in which they would like to live by according weights to the factors and constraints. The interface to the system presents the family with maps representing the factors and constraints plus information on how the maps were formed and what they mean. The family then decide what is important for where they want to live and using a geographical equaliser they can alter the relative importance of factors and constraints which are then used in the analysis. The geographical equaliser is a tool using sliders bars to represent the various factors and their relative importance. The multicriteria analysis uses Idrisi and is performed on a real data set relating to an area of the County of Chesire, England. The system enables group decision making to occur so that the family can see the effect of their decisions. They can then go back and alter their priorities, using the slider bars and see what the new map would look like. They can produce individual maps and compare the results to identify areas of potential conflict and consensus. This has been performed in rooms of 15 PC workstations where groups of people run the analysis and then examine each others results. It presents non GIS specialists with the opportunity to utilise GIS technology by non GIS methods - i.e. they family do not realise that they are using a GIS, they relate to the information. The use of the slider bar enables complex decision making to occur because the family can see the effect of the relative weights of the factors and constraints in a simple visual manner. This enables them to concentrate on the task of decision making rather than how to actually perform the decision making. Work is current with Kirklees Metropolitan Council and local community groups in the village of Holmfirth, County of West Yorkshire, England to develop a consensus based decision making system. The Kirklees systems uses the same multicriteria analysis technique as the "House Hunting Game" for the assessment of local community attitudes towards their environment which can be used by the council for use in Local Agenda 21 proposed by the United Nations Agenda 21. The system is under development within initial trials in June 1995 and use in August 1995. The system will allow local people to identify what is important to 176
them for their environment and weight these in order of importance to various development proposals from the Council. This will produce a series of personal maps which can be used to identify the conflict and consensus within the community with which the Council can then use to better develop policies for local sustainable development. The methods used are based upon group community usage of technology to understand their environment. 4.0 Conclusion This paper has presented a brief view of our joint research work in the field of CSDM. The issues outlined below and those proposed through Initiative 17 are, we believe, important for the future development of CSDM. Issues in CSDM that should be discussed at the workshop · What areas of application are appropriate for CSDM research and how can we identify these ? · How can we integrate various methods of data access into a single environment so that CSDM can take place ? · What user interface mechanisms are appropriate ? · What analytical techniques can be included within a CSDM environment ? · What visual methods can be used to differentiate between ideas/data/information/ decisions and should there be multiple methods of representation for multiple users preference ? Through the production of prototypes and testing of ideas we can further develop the use of GIS techniques and technology to aid our understanding of the human and physical environments. The application of such techniques and technology should not remain in the domain of the specialist but be available to all who require such tools for decision making and understanding. References Densham P.J, (1991), Spatial Decision Support Systems: Chapter 26: Geographical Information Systems Eds Maguire Goodchild and Rhind), Longman, London. Heywood.D.I & Carver.S.J,1994,Decision Support or Idea Generation: The role of GIS in policy formation, Angewandte Geographische Informationsverarbeitung VI, Salzburg Heywood D.I, Oliver J & Tomlinson S.J, (1994), Building an exploratory multi criteria modelling environment for spatial decision support: Chapter 11, Innovations in GIS 2 Ed Fisher.P, Taylor & Francis, London Heywood.D.I & Tomlinson S.J,(1995), Modelling Uncertainty, Consensus and Conflict: The Need for Spatial Meta Models in Environmental Decision Making, GISDATA Conference, Stockholm, Sweden. Szajna.B & Scamell.R, (1993), The Effects of Information System User Expectations on Their Performance and Perceptions, MIS Quarterly, December 1993 pp 493-516 Wetherbe.J, (1991), Executive Information: Getting it Right, MIS Quarterly, March 1991 pp51-65 177
Joshi.K, (1991), A Model of Users' Perspective on Change: The Case of Information Systems Technology Implementation, MIS Quarterly, June 1991 pp 229-242 Lawerance.M & Low.G, (1993), Exploring Individual User Satisfaction within User-Led Development, MIS Quarterly, June 1993 pp195-209 Tomlinson S.J,(1994),Developing a Geographical Operating Environment (GOE),Decision Support 2001 Conference, Toronto. Tomlinson S.J,(Thesis, in prep), Towards the development of a generic Geographical Operating Environment (GOE), Manchester Metropolitan University Biographies Dr Stephen J. Carver (
[email protected]) Dept of Geography University of Leeds, Leeds, England Dr Carver is currently a Lecturer in Geography in the School of Geography, University of Leeds,UK. Previous posts held include Research Associate at the University of Newcastle upon Tyne working within the NERC/ESRC Land Use Programme (NELUP) on developing planning and socio-economic aspects of the NELUP decision support system; University Research Fellow in Geographic Information Handling within the Centre for Urban and Regional Development Studies at the University of Newcastle upon Tyne working on methods of estimating error in digital map overlay operations and developing new error handling tools for GIS. His doctoral thesis focused on the application of GIS to siting radioactive waste disposal facilities in Britain with particular emphasis on developing workable links between GIS and multicriteria evaluation. Current research interests focus on environmental and social applications of GIS and on developing new methodologies for decision making and support. Dr Ian Heywood (
[email protected]) Dept of Environmental & Geographical Sciences The Manchester Metropolitan University, Manchester, England Dr Heywood is currently a Senior Lecturer in the Department of Environmental & Geographical Sciences at The Manchester Metropolitan University, UK. Previous posts have included Lecturer at the University of Salford, Research Associate, University of Newcastle upon Tyne and Visiting Professor, Institute of Geography, University of Salzburg, Austria.. Dr Heywood is one of the co founders of the International Distance Learning Diploma/Msc in GIS, co-director of the Idrisi Resource Centre UK and member of the GISDATA initiative on Spatial Data Modelling. Research activities focus on Spatial Decision Support, Telematics and Distance Learning. Steven J. Tomlinson (
[email protected]) Dept of Environmental & Geographical Sciences The Manchester Metropolitan University, Manchester, England Mr Tomlinson is a Lecturer in the Department of Environmental & Geographical Sciences at The Manchester Metropolitan University, UK. Previous posts have included Research Assistant at the University of Salford, UK working on a research project for Greater Manchester Fire Authority investigating the incidence of fire calls and the relevance of socioeconomic factors used in decision making for the allocation of resources. His thesis ( in prep )
178
is an investigation into the production of a generic Geographical Operating Environment(GOE) which can be used for spatial an non spatial access for decision support. His research interests include Spatial Decision Support and the development of techniques/technology which make GIS more accessible to non technical users. A combined list of some relevant references Carver,S & Openshaw,S.(1995) Using GIS to explore the technical and social aspects of site selection. in Proceedings of Conference on the Disposal on the Geological Disposal of Radioactive Wastes, Royal Lancaster Hotel, London, March 1995 Carver.S, (1991) Integrating multicriteria evaluation with GIS, International Journal of Geographical Information Systems 5(3), 321-339 Carver.S, (1991) Spatial decision support systems for facility location: a combined GIS and multicriteria evaluation approach. in Proceedings of 2nd International Conference on Computers in Urban Planning and Urban Management, Oxford UK, July 1991, 75-90 Carver.S,(1991), A prototype decision support system for siting radioactive waste disposal facilities using Geographic Information Systems and multicriteria evaluation. North East Regional Research Laboratory Report No. 91/1. University of Newcastle upon Tyne. Carver.S. Myers.A & Newton.M, (1992), The role of public perception in the response planning for major incidents: a proposal for a GIS-based strategy. North East Regional Research Laboratory Report No 92/1, University of Newcastle upon Tyne.
A Collaborative GIS Decision Support Model on Internet Jeff Wang Lockheed-Martin Service Group Visualization Center of National Environmental Supercomputing Center U.S. Environmental Protection Agency 1. Introduction The international Geographical Information System (GIS) community has experienced enormous growth in the past decade because of the advancement of computer, remote sensing, and space technologies. The typical size of a GIS dataset has grown in magnitude from megabytes a decade ago to gigabytes now. The typical use of GIS has evolved from simple cartography to multimedia decision making support in the same period. Typical users have expanded from the geographical survey community to virtually all communities. It is no longer possible to put all GIS data into a centralized location and use one computer to handle the data processing, let alone intensive data analysis for decision support. However, the society demands more GIS data and better utilization of these data.
179
The most promising solution to the GIS growth problem is the Internet. The Internet, which is defined as interconnection of computers around the world, has grown from tens of computer hosts two decades ago to tens of millions of computer hosts today. It is one of the fastest spreading technology/communication tools in the United States and around the world. Meanwhile, the Internet community has been agonizing over how to develop applicable programs to use the full capacity of Internet in the future. Collaborative Spatial Decision Making (CSDM), or Collaborative GIS, will advance to be one of the most popular applications on the Internet. Future GIS data can be managed and served in a distributed system at the county/metropolitan or township level. In such a system, the data can be updated constantly by the people who are most familiar with the environment. A huge computer network will connect all of these computers. A user of the GIS data will run a client anywhere and be able to discover and filter the GIS data, retrieve wanted data, conduct analyses, and archive results. The analytical results are then used for decision making. An intelligent agent will be used for optimizing the solutions and audio-visual tools will be used to conduct conferences and utilize human expertise. Fortunately, the GIS community does not have to reinvent the wheel in order to build collaborative GIS. The Internet community has developed many of the needed technologies to accommodate the future growth of collaborative GIS. These include research and development of the WWW, gophers, the Wide Area Information Service (WAIS), Computer-Supported Collaborative Work (CSCW) environment, object-oriented programming (OOP), client/server paradigm, and information agents. This paper will propose a CSDM model and discuss the related major issues. 2. Important Issues in a CSDM In this section, we will discuss some of the important issues in development of a CSDM model. We will only provide some brief discussions on each issue and will provide in-depth discussion of each issues in separate studies. 2.1 GIS Data Model Most of the current GIS data models are based on relational database technology in a centralized location. This can no longer continue because the "modern" (compared to 10 years ago) GIS applications demand more efficient use of memory and a shorter application life cycle. Therefore, the future data model will be object-oriented and reusable. Furthermore, the GIS data model will take "open system design" approach, so the data model is interoperable, reconfigurable, and can be grouped with other data models to form a more powerful metamodel. One of the current practices in telecommunication applications, which will be continued through the next few decades, is bandwidth on demand. Users can choose their bandwidth configurations based on cost. Therefore, GIS applications will face different users groups in different geographical locations with different bandwidth capacity. One of the solutions to this problem is to implement sharable objects in the data model, so we can build a collaborative GIS data model. 2.2 Distributed vs. Centralized Although many GIS applications are still using a centralized approach for data storage and management, few will dispute that we are unable to continue using a centralized approach. The
180
most popular technology paradigm nowadays is the enterprise client/server environment, in which the more powerful data processing machines are used as data servers, and the less powerful desktop PCs are used as clients. Obviously, the old, centralized GIS applications will be obsolete, and the new, client/server GIS environment will be established. 2.3 GIS Information Archive, Retrieval, Discover, and Management on Internet In a client/server computing environment with reasonable bandwidth, we can do much more on GIS information archive, retrieval, discover, and management. For example, WWW (also called "the Web") uses universal resource locators (URLs), hypertext transmission protocol (HTTP), and search engines to facilitate information archive, retrieval, discover, and management. The efficient use of computers and bandwidth contributes a great deal to the popularity of the Web; and of course the user-friendly graphical user interface (GUI) contributes a lot too. Without a major development effort, we should be able to achieve satisfactory results by using the existing software environment. In fact, a prototype of the GIS information discovery and management model can be implemented using WWW and its associated software programs. In WWW, a data server is a Web server that serves text, HTML documents, and images; a client is a Web browser such as NCSA Mosaic or NetScape. We can run a mail robot around the Web to pull out information we want at any time. If we implement URLs in a certain format on all the GIS data servers, the mail robot program can identify these special URLs and discover what we want in a reasonable time frame. And we can archive our data by File Transfer Protocol (ftp) into the data server. These can all be done by clicking on the homepage. Later in this paper, we will propose a CSDM model with 3-tier client/server environment. This model will make use of the WWW as well as the local client/server environment on the Local Area Network (LAN) or Metropolitan Area Network (MAN). 2.4 Audio-visual Conference and Other Means of Communications The necessity of having an audio-visual conference capability depends on the intended application. In some applications, such as Intelligent Vehicle Highway System (IVHS) and emergency road service, a conference system is necessary because the scene is too chaotic to be described clearly by other means. But in most of the cases, especially those involving scientific research and analysis, audio conference with very low bandwidth video conference should be sufficient. Use of the Differential Global Position System (DGPS) will be very helpful in gathering and updating the GIS data, as well as the utilization of GIS data to do analysis. Even the traditional mail delivery can make a difference: if we take the sharable object approach, the users can order the data, presumably on a CD-ROM, by mail. When the decision makers call on a conference, each party can insert the CD-ROM, and only use the network to pass control commands, so all parties can share applications and conserve the use of bandwidth. 2.5 Visual Interface and GUI A consistent GUI and visual interface across all platforms is one of the secrets of success in this client/server environment. In fact, the success of NCSA Mosaic is not purely luck. It is the only program that can run on IBM-compatible PCs, Macintosh computers, and UNIX Workstations while retaining a remarkably consistent interface. And it is free of charge! 181
In a 3-tier client/server environment, the Web server on the Internet can be hidden from the user clients, so we can still give the users the impression of a consistent GUI. The GUI should also hide the underlying file management process from the users, and yet give the users freedom to troubleshoot the results. 2.6 Intelligent Agent Anyone who has ever run a search engine or mail robot program on the Web has been overwhelmed by the huge amount of information available for his/her search subject. But all these information may or may not be related to the subject, depending on how people find them. For the GIS datasets, things can be more complicated because of the size of the data, and it may take much longer to search for a piece of data. Therefore, an intelligent search engine is needed to filter out some unwanted information before they reach the users. This intelligent search engine is called "intelligent agent," or "information agent." The building of the intelligent agent is a combination of computer network, universal resource location, data organization and indexing, and artificial intelligent. The GIS community should take the lead in applying these advanced technologies to solve the distributed GIS problem. 2.7 Automation of Decision Support Process Automation of the decision support processes is crucial to the success of CSDM. A decision making process usually involves a tremendous amount of data analysis and "what-if" simulations. Actually, the major problem is not the analysis, but the file management. A decision support system should hide all of these low level works from the users, but at the same time still give users the flexibility to change parameters, conduct quality assurance of the process, and extract comprehensive information through the decision making process. Furthermore, an optimization program should be available to the decision makers so they can run "what-if" scenarios in batch mode and obtain the "best-guess" solutions. This is itself a big topic in the decision support theory, and it is beyond the CSDM research domain. Yet CSDM should utilize this knowledge for its own benefit. 2.8 Joint Application with Other Discipline Even a very powerful CSDM cannot solve all of the current problems. If CSDM works with other decision support systems in other disciplines, the system can be very successful. Therefore, CSDM should be open, object-oriented, reusable, and able to accommodate major data format in the market (e.g., HDF, NETCDF, etc.) A good example of CSDM cross-discipline application is the ecosystem management system in the environmental field. On one hand, an ecosystem management system demands a lot of GIS data, on the other hand, the ecosystem management system needs to use environmental modeling and simulation to support the decision making. Hence, by using the existing environmental decision support systems and the CSDM, one can easily extend the decision making to the earth's ecosystem. However, at this point, the two communities have been unable to build something together that is truly integrated and interoperable.
182
3. A CSDM Model 3.1 Data Model The data model of this CSDM system will be object-oriented and closely disseminate real world geographical objects. 3.2 System Architecture The system will be open, modular, and object-oriented. It will be expandable so it can work with other decision support systems to form a meta decision support system for large scale, complex problems. 3.3 Distributed Desktop Environment The system will use 3-tier client/server structure. The first layer is the client layer, the local clients will be connected with a local GIS server, which usually be the file server on a LAN. The collection of these GIS servers is the second layer. The third layer is the Internet layer, which connects all the GIS servers together. The command and control centers of the GIS server network are strategically placed in different locations all over the country (or world). These centers are called "GIS meta-centers." Under this distributed environment, the clients can be run by a wide range of UNIX workstations, IBM PCs, and Macintosh computers. The local GIS servers can be run on typical server machines, which have more memory and storage capacity. In the meta-center, supercomputers and high density storage are used to handle the management tasks. 3.4 Collaborative Environment For co-authoring, document sharing, and collaborative work, the model will use the shared object approach. The users may obtain/purchase a copy of GIS data via CD-ROM or via Internet applications like ftp and WWW before the collaboration, then load the software and data to their computers when the conference begins. This approach is a collaborative process in asynchronous mode. For the video and audio conferencing, the model will use the Internet (e.g. MBONE) or ISDN to conduct video-audio conference. So in the collaboratory process, users can start the videoaudio conference, run the CSDM model, and apply remote control to manipulate the shared objects. This approach is a collaborative process in distributed synchronous mode. 3.5 GUI and Visual Interface X/Motif-like GUI is the de facto standard in current GUI development industry, therefore, the model will use X/Motif to construct the GUI and Visual Interface of the GIS model. 3.6 Information Archive, Retrieval, Discovery, and filtering The model will use the newly-built or existing Internet tools to archive, retrieve, and discover GIS information on the Internet.
183
4. Concluding Remarks In this paper, we presented a CSDM model and discussed issues we are facing currently. We proposed a comprehensive CSDM model that will work on the Internet and will provide different levels of opportunity of participation. We used the Internet client/server environmental as our backbone and decision support as our goal, and we conclude that this model, if realized, will benefit the GIS and environmental science community at large. Today, Internet technology is utilized at an ever increasing rate. USEPA has already used satellite TV and MBONE to transfer environmental technology to the user community. Further, more and more divisions inside EPA and other government agencies are providing their staffs with WWW access and establishing their own WWW home pages in order to provide increased access to public information as well as convey information to the public and other government institutions. At the same time, the GIS community has been spearheading the utilization of Internet to make GIS data available to the general public. It is inevitable that CSDM model will use Internet as a major testbed for applications. In the future, the U.S.EPA Scientific Visualization Center (SVC) pursue the support of scientific visualization of ecosystem management and combine GIS into environmental scientific visualization. SVC's goals are to support the decision making processes used by environmental decision makers, and to convey the scientific research results more effectively to the general public. We will be actively supporting and participating in the development and deployment of the CSDM models. Biography Jeff Wang, Ph.D., System Manager/HPCC,
[email protected] Voice: 919-541-7662 Fax: 919-541-0056
U.S. EPA Scientific Visualization Center P.O. Box 14365 86 Alexander Drive, MS24/ERC1 Research Triangle Park, NC 27709
Jeff Wang, Ph.D. is a technical leader in the Visualization Group of National Environmental Supercomputing Center of USEPA. Dr. Wang is an advocate for the use of Internet technologies in the environmental decision support community. He organized the first-timeever MBONE broadcast of an EPA workshop to the Internet community and developed several World Wide Web (WWW) information service sites to promote decision support in different industries. Dr. Wang also have extensive experience in GIS applications. His research interest is collaborative GIS model on the Internet.
184