Collecting high frequency panel data using mobile phones Kevin Croke, Andrew Dabalen, Gabriel Demombybes, Marcelo Giugale and Johannes Hoogeveen1
Abstract: As mobile phone ownership rates have risen dramatically in Africa, there has been increased interest in using mobile telephony as a data collection platform. This paper draws on two pilot projects using mobile phones for high frequency data collection in Tanzania and South Sudan. The experience was a largely a success. Data has been collected on a wide range of topics in a manner that is cost effective, flexible (i.e. questions can be changed over time) and rapid. And once households are included in the survey, they tend to stick with it: respondent fatigue is not an issue. Attrition and non-response have been an issue in the Tanzania survey, but in ways that are related to the way this survey was originally set up and that are fixable. This paper discusses lessons learned and offers suggestions for future applications of mobile phone surveys in developing countries, such as those planned for the World Bank’s “Listening to Africa” initiative.
1
All authors work for the World Bank with the exception of Kevin Croke who works at the Gates Foundation. Correspondence regarding this paper can be sent to Johannes Hoogeveen:
[email protected].
1|Page
Collecting high frequency panel data using mobile phones 1. Introduction Timely, high quality information about socioeconomic outcomes related to well-being, service delivery, income, security, health and many other topics is not readily available in Africa. This is so because such data is typically collected by nationally representative, face-to-face household surveys. Such surveys are expensive and time-consuming and are, for this reason, not implemented very frequently. Needless to say that there is huge demand for more timely welfare and monitoring information. Decision makers would benefit from information that allowed them to monitor the situation in their country in a more “real time” manner. How else could they know, for example, whether reports about a looming crisis are overblown extrapolations based on (newspaper) stories, or true signs of an emerging disaster? Statisticians, likewise, would benefit from more frequent welfare information, for instance to validate GDP estimates with farmer-based crop forecasts and price information. Program managers, too, would benefit from information that assesses whether their activities are on track, just as civil society groups could use representative information to make their case. The scientific community could equally take advantage from high frequency surveys. It would open new a field of research and it could offer opportunities to assess the trajectory of effects in impact evaluations. It could also offer opportunities to make impact evaluations more efficient. McKenzie (2012), for instance, argues that when outcome measures are relatively noisy and weakly autocorrelated such as is the case with business profits, household incomes and expenditures, and episodic health outcomes, impact evaluations that use smaller samples and multiple follow-ups are more efficient than the prototypical baseline and follow-up model. This paper presents an approach that is able to collect a wide range of data related to household welfare with high frequency and at low cost. The approach uses the fact that the coverage of mobile phone networks is now widespread in Africa to propose a mobile phone survey model which combines a standard baseline survey with the distribution of mobile phones to respondents at the time of baseline, who then are called regularly (weekly or every two weeks) with follow up questions. These questions can be comparable to questions asked before to track changes over time, or can be new and collect data on emerging issues. This paper is not the first to suggest that a mobile phone platform can be used to collect high quality panel data. Brian Dillon (2009) for instance, used mobile phones to carry out 14 rounds of interviews (every three weeks) to track how farmer expectations of their next harvest changed over time. This paper differs from Dillon’s work in that it proposes the creation of nationally representative (panel) surveys that ask mobile phone questions every two weeks and whose (anonymized) data is publicly released within 4 weeks after their collection. The Africa Region in the World Bank intends to roll out such surveys to every country in Africa, in an exercise that data users might refer to as ‘Listening to Africa’ and data producers might think of as ‘Meeting the high frequency data challenge’.
2|Page
This paper describes how nationally representative mobile surveys are envisaged and draws on experiences from two mobile surveys, in South Sudan and Tanzania. Of these two, the survey in Tanzania has been running longest (33 rounds to date), while the survey in South Sudan is the survey that operates under the more difficult conditions. The structure of the paper is as follows. In section 2 we explain how mobile surveys work. Section 3 discusses the Listening to Africa initiative, after which section 4 presents some results from the mobile surveys in Tanzania and South Sudan. Section 5 discusses non-response and attrition, while section 6 discusses the representativeness of the Tanzania survey. Section 7 talks about other aspects of data quality, followed by section 8 which provides details about survey costs before ending with conclusions in section 9. 2. Mobile phone surveys Conducting surveys by phone is standard practice in developed countries, but has typically not been considered feasible in poor countries, because phone ownership rates are too low (especially in the premobile phone era). In Tanzania, for example, just 1% of households own a landline phone (DHS 2010). However, the rapid rise of mobile telephony in Africa has changed this. Again in Tanzania, mobile phone ownership increased from 9% of all households according to the 2004-05 DHS, to 28% by 2007-082. By 2010, this number had almost doubled again, to 46% of households. Even higher rates of phone ownership have been recorded in urban areas: Phone ownership was 28% for urban households in the 2004-05 DHS, more than doubled to 61% in 2007-08 and had reached 78% by 2010. In the Tanzania baseline survey in Dar es Salaam, mobile ownership was found to be 83%. In Kenya, the sub-Saharan country that is leading in terms of mobile phone ownership, the Afrobarometer survey of November 2011 shows that households own on average 2.4 mobile phones and that 80% of Kenyan adults have their own mobile phone while only 7% report that they never use a mobile phone. Phones are actively used: 81% use their mobile phone to make a call at least once a day and 61% send or receive a text message at least once a day; a remarkable 23% sends or receives money or pays a bill via mobile phone at least once a day.3 With such high rates of mobile phone ownership, representative household surveys using mobile phones become an option. Phone ownership rates above 80% are at or beyond the threshold at which reliable survey research can be conducted: For example, only 80% of US households own landlines, but political polling typically still uses landline samples only. The point estimates provided by these surveys are widely considered reliable when corrected by re-weighting.4 This suggests that phone ownership in Kenya or in urban Tanzania is already high enough for reasonable inference to be made from surveys that exclusively rely on mobile phones. In many rural settings, mobile surveys could equally be used provided one provides respondents with a mobile phone. This too is realistic as reliable phones can be 2
This figure is from the 2007-08 Tanzania HIV/AIDS and Malaria Indicator Survey These data have been provided by Gabriel Demombynes. 4 Blumberg et al, “Wireless Substitution: Early Release of Estimates from the National Health Interview Survey, July-December 2008.” Atlanta, GA: Centers for Disease Control. For an example of a reputable survey firm applying these approaches see: http://www.ipsos-na.com/download/pr.aspx?id=11397. 3
3|Page
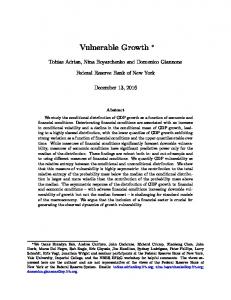
bought for $20 or less. Only respondents living in areas not covered by a mobile phone signal would be left out of such surveys, but even these respondents could be included if, for instance, use was made of a local enumerator who would visit the respondents, collect their responses and then find a place with a cell phone signal to relay the responses to the survey administrators. Figure 1: Evolution of mobile phone ownership in Tanzania 1 0.9 0.78
0.8 0.7
0.61
0.6
0.49
0.5 0.4 0.2 0.1
2007
0.28
0.3
2004-05 0.28
2010
0.09
0 all Tanzania
urban only
mobile phone ownership
Source: Demographic and Health Surveys, 2004-5, 2007-08, 2010 Another reason to consider using mobile phones for household surveys is because mobile surveys have been found to produce quality data. Lynn and Kaminska (2011), for instance, investigate whether data collected through interviews using mobile phones differs from data collected using landlines. They identify four reasons why the quality of data collected using mobile and fixed phone interviews may differ: line quality, the extent of multi-tasking amongst survey respondents, the extent to which survey respondents are distracted from the task of answering questions, and the extent to which other people are present and able to overhear what the survey respondent is saying. The authors evaluated the extent to which differences in these features affect survey measures by analysing data from a randomised experiment. In the experiment, a sample of people who had both mobile and fixed phones were randomly assigned to be interviewed either on their mobile phone or on their fixed phone. They find only few and small differences in survey measures between the mobile phone interviews and the fixed phone interviews. The few differences that are found suggest that data quality may be higher with mobile phone interviews. This they attribute to survey respondents having greater control over whether other people are within earshot and whether others can listen in from another line. When other people can hear the responses being given – which may be more likely when responding on a fixed line – respondents may have a tendency to censor their responses to avoid socially undesirable answers.
4|Page
3. Listening to Africa Mobile surveys, such as the proposed “Listening to Africa” project will most of the time not exclusively rely on interviews over the phone but will employ a face-to-face baseline survey during which household and respondent characteristics are collected and during which the respondent for the mobile phone part of the survey is selected. 5 Listening to Africa aims to collect population data, necessitating that an (adult) respondent is randomly selected from the household. The baseline survey will often be a new survey, but it could also be an existing survey whose households are being revisited. The latter may seem a sensible way to reduce cost but as households probably need to be revisited in any case, to select the respondent, to obtain permission for participation, to familiarize respondents with the mobile phone part of the survey and to agree on a good time for phone interviews, the cost advantage of using an existing survey is likely to be small. The baseline survey is also the time to distribute phones and, in locations with limited access to electricity, solar chargers. Alternatively, a village kiosk owner who provides phone charging services could be contracted to offer free phone charging to participating households. Once the baseline has been completed, respondents receive calls from a call centre at regular intervals (every week, every two weeks) during which additional questions are asked. In this way a high frequency panel is created. Answers from respondents can be collected in various ways as mobile phones offer a multitude of opportunities to obtain feedback, including through SMS, WAP, IVR and USSD.6 When this paper mentions mobile surveys, it refers to surveys carried out by call centers in an approach where operators call respondents, interview them and enter the responses into a database using a CATI (computer aided telephone interview) system. The decision to rely on call centers for mobile phone data collection is informed by experiences with WAP, IVR and USSD in the early stages of the Tanzania mobile survey. The flexibility call centers offer to vary questions from one round to the next, the ability to ask complex questions (which may require explanation), the possibility to accommodate illiterate respondents and respondents owning low end phones without internet connectivity, makes voice the technology of choice for most of sub-Sahara Africa. Call centers are able to deal with respondents with different mother tongues, good enumerators can build rapport between respondent and phone operator and call centers offer the opportunity to ask in-depth (qualitative) questions. Reliance on voice to collect data does not mean that other opportunities offered by mobile phones must remain unexploited. Respondents can be alerted that an interview is due through SMS, and following the successful completion of an interview, respondents can receive a token of appreciation in the form of phone credit that is transferred by the call centre to their mobile phone. Another way to motivate 5
In Kenya, Gabriel Demombynes of the World Bank will lead a pilot to investigate the possibility of creating a mobile survey without a baseline survey whereby respondents are drawn from the data base of phone numbers held by the dominant phone company and whereby a baseline survey is implemented over the phone. Whichever the approach, at the onset of the mobile survey, a representative set of respondents needs to have been identified along with their core characteristics (location, gender, age, education, wealth etc.). 6 Smith et al. (2011) provide an overview of different ways to gather data using mobile phones.
5|Page
respondents is by keeping them informed about how their data has been used: in Tanzania, for instance, respondents are notified by SMS when newspapers report stories with data provided by the respondents. Remuneration of the respondent may seem inevitable if the aim is to motivate respondents to remain in the sample for a long period of time. The remuneration does not have to be very sizeable, and could largely be seen as a token of appreciation. In Tanzania, for instance, the phone credit that is transferred after every interview varies from $ 0.17 to $ 0.42, with no discernable impact on response rate (see Table 1). However, it is good to keep in mind that mobile surveys which distribute phones, which provide respondents with call credit and which frequently ask respondents questions about a large variety of topics are, by their very nature, an intervention. Particularly for respondents that did not own a phone prior to the mobile survey, participation changes their access to information and their ability to connect with others. Moreover, all respondents are required to regularly consider aspects of their lives and state facts or opinions about it. In future research we intend to explore the degree to which this empowers respondents and changes their behavior. A randomized experiment in which some respondents in the baseline participate in the mobile survey and others don’t, followed by a second face-to-face interview a year later, would be a good way to assess the impact of participation in the mobile phone survey. 4. Some results from the Tanzania and South Sudan mobile surveys. The mobile survey in South Sudan revisited, in late 2010, 1,000 respondents in 10 urban areas covered in South Sudan’s 2009 National Baseline Household Survey, selected respondents, handed out mobile phones (half of them with integrated solar chargers) and called respondents on a monthly basis using a call centre operating from Nairobi using interviewers capable of speaking South Sudan’s main languages. Respondents who successfully completed an interview were rewarded with an amount varying from $ 2 to $ 4. The survey in Tanzania, visited in August 2010, 550 households in Dar es Salaam, administered a baseline survey, randomly selected an adult respondent for the mobile survey, and called respondents on a weekly basis (25 rounds), and later (8 rounds) every two weeks. The survey in Dar es Salaam did not distribute phones. Only recently, after round 33, have some phones been distributed to respondents who had never before participated in the survey. Both surveys are still running. The mobile survey interview format does not appear to pose major limitations on what can be asked, except that the length of an interview should probably not be more than 20 – 30 minutes (Dillon’s interviews lasted 27 minutes on average; interviews in the Tanzania survey are generally significantly shorter). So an elaborate consumption module, for example, or a detailed health module with birth histories, is less suited for this type of survey.7 Mobile surveys in Sudan and Tanzania collected (and still collect) information on a wide variety of issues including on health, education, water, security, nutrition, 7
This raises another issue for future research: whether it is possible to track changes in consumption by using poverty mapping techniques (Elbers, Lanjouw and Lanjouw 2002) with a set of correlates that is more sensitive to changes in consumption levels than assets which is currently used in poverty mapping.
6|Page
travel times, prices, electricity and governance. The surveys have been used to ask perception questions on topics varying from what respondents considered most pressing problems to be addressed by the city government to people’s opinion about the draft constitution. They have also been used to collect baseline information for large scale programs on food fortification. One of us, Kevin Croke, has used the Tanzania mobile survey to collect additional data, when it turned out that the baseline survey lacked some variables needed to answer a particular research question. The data can be used to report on a single issue but becomes of greater interest when the same information is tracked over time (Figure 2). Figure 2: In the last month, how often if ever, have you or a member of your household gone without enough food to eat? Never Many Times or Always
Once, Twice or Several Times
100
Percentage
80
60
40
20
0
December
January
February
March
Source: South Sudan mobile survey By combining the information with information from the baseline survey more meaningful results are obtained: below results are disaggregated by wealth quintile, using an indicator that was constructed using asset information collected during the baseline survey. Figure 3: In the last week, did your child receive any homework?, broken down by quintile
7|Page
75%
80% 70%
62%
60%
53%
58%
62%
50% 40% 30% 20% 10% 0% Poorest
2
3
4
Wealthiest
Wealth quintile
Source: Tanzania mobile survey, 2012
Because questions can be changed every round of the survey, it is possible to accommodate new data requests or to respond to emerging issues. The question below, for instance, was included in the Dar es Salaam survey after major floods hit the city in December 2011, to get a sense of the fraction of people that had been affected. Had the survey’s sample size been somewhat larger, it would have been possible to gauge what percentage of affected households were reached with help by the government, thereby proving real time impact on an important and salient government activity. Figure 4: Questions asked early January 2012 in response to the December floods in Dar es Salaam 16
14.9
14
Percent
12 10 8
6.7
6 4 1.4
2 0
Did water leak into Did you have to leave Are you still unable to your home? your home? return to your home?
Source: Tanzania mobile survey, 2012 Mobile surveys can also ask the main respondent to pass the phone on to someone else in the household, if this is needed to get certain questions answered. Figure 5, for instance, presents responses to questions asked to children attending primary school about the presence of their teacher. 8|Page
Finally, though this has not been tried yet, the mobile survey can be used to field screening questions to indentify respondents who qualify for in-depth interviews. In this way, qualitative and quantitative research methods could be combined smoothly. Figure 5: Questions asked early January 2012 in response to the December floods in Dar es Salaam
[to be generated with round 34 data] Source: Tanzania mobile survey, 2012 5. Non-response and attrition
A key challenge for high frequency mobile surveys is non-response (a respondent participates in some but not all rounds) and attrition (a respondent drops out of the survey completely). Attrition is a challenge for all panel surveys, and may be particularly an issue for mobile surveys when their frequency creates respondent fatigue. Non-response, in the sense defined here as a respondent who does not answer one round, but then participates in another, may be more particular for mobile phone surveys. In this section we focus on evidence from the Tanzania survey as this is the longest running mobile survey. In considering this survey it is important to be aware that when this survey was initiated by Twaweza (one of us, Johannes Hoogeveen worked at Twaweza at the time), a main objective was to explore which technology would be most suited for a nationally representative mobile survey and to identify the systems needed to collect, process, analyze and disseminate survey data on a weekly basis. It explains why no mobile phones were distributed and why households without a mobile phone were allowed to drop out of the mobile part of the survey. Bearing this in mind, there is much that can be learned from this survey. During the Tanzania baseline, households were assigned one of four technologies: Interactive voice response (IVR), USSD (an approach allowing direct transmission of questions from a phone company server to the respondent’s phone; this technology also works on low-end phones), WAP (web-based mobile phone surveys, suited for high-end phones with internet capability) and voice (a call centre).8 Following the baseline and during the first 7 rounds of the mobile survey there were numerous problems with the different technologies: the number of internet enabled phones turned out to be very low, support from the phone company to run USSD was minimal (especially once mobile banking started to claim the available bandwidth), IVR turned out to be clumsy as questions had to be broken down to avoid too many response options. Voice not only did not have any of these drawbacks, it showed other advantages as 8
Because of its limitations SMS was not considered.
9|Page
indicated in the previous section. Hence after a relatively short period of time (7 rounds), voice became the technology of choice and all those who were reachable and had access to a mobile phone were put through the call centre. Following this decision the survey ran for another 18 weeks before it was discontinued by Twaweza.9 Management of the survey was then transferred to the World Bank who had indicated interest in using the survey to generate feedback on its programs. The World Bank appointed consultants who were tasked with identifying questions and (independent) reporting of the findings (Kevin Croke one of the co-authors is the lead consultant). The original survey firm, DataVision, was contracted to continue to implement the mobile survey, and after a gap of four months the survey was restarted. Under this new arrangement interviews are conducted every two weeks. At the time of writing (February 2012) 7 rounds have been completed in the World Bank survey.10 Figure 6: Number of respondents per round (starting round 8)
Number of respondents
370 350 330 310 290 270
Round 8 Round 9 Round 10 Round 11 Round 12 Round 13 Round 14 Round 15 Round 16 Round 17 Round 18 Round 19 Round 20 Round 21 Round 22 Round 23 Round 24 Round 25 Round 26 Round 27 Round 28 Round 29 Round 30 Round 31 Round 32 Round 33
250
Source: Tanzania mobile survey, 2012 So what does the Tanzania mobile survey tell us about attrition and non-response? On the negative side, there was a large initial burst of attrition. This can largely be attributed to the fact that the survey team did not hand out phones. When the team initially visited and administered the baseline survey to 550 respondents, it was found that 418 owned their own 9
Based on the experience with mobile surveys in Dar es Salaam, Twaweza is currently in the process of setting up a nationwide mobile survey. 10 Reports and data produced, including the baseline data can be obtained from: http://monitor.publictransparency.org/
10 | P a g e
phone, 69 had a household member who owned a phone, 6 would access a phone through a friend and 57 had no phone. Obviously, owning a phone is different from using someone else’s phone and when the mobile survey started in earnest in round 8, it was determined that 458 respondents could realistically be reached.11 Once the mobile survey began in earnest an average of 304 respondents, or 66%, participated during the first 19 rounds of the survey. Later, once the survey was put under World Bank management and oversight was tightened (but after a four months gap in interviews!) the number of respondents increased to 343 respondents on average (75% of the sample). So after 33 rounds of mobile interviews, the overall response rate is 75% from the 458 households in the sample that had access to phones (62% of the 550 households in the baseline survey). The rate of attrition, narrowly defined as those who did not respond at all to the mobile survey is much lower: only 4% of 18 out of the 458 households never responded to a mobile survey, while 66% responds to at least two out of every three surveys. Figure 7: Number of rounds respondents participated in the 26 rounds of the Tanzania mobile survey
Number of respondents
60 50 40 30 20 10 0 0 1 2 3 4 5 6 7 8 9 10 11 12 13 14 15 16 17 18 19 20 21 22 23 24 25 26 Number of rounds (out of 26) that a respondent participated
Source: Tanzania mobile survey, 2012
While we are not aware of comparable cases involving mobile phone panel surveys, the rate of non-response and attrition appears comparable to that attained by a number of non-mobile 11
Some respondents could not be reached either because their numbers had been captured incorrectly, or because they never seemed to have their phones on.
11 | P a g e
phone (i.e. face-to-face) panel surveys. For example, the Cebu Longitudinal Health and Nutritional survey in Philippines had almost 66% attrition (Miguel et al. 2008), while Alderman et al. (2001) note that the Bolivian Preschool Pre-School Program Evaluation Household Survey had 35% attrition and the Kenya Ideational Change survey had 28% attrition for women (and 41% for couples), over a two year interval in all three cases. Panel surveys that revisit respondents after extended intervals often have relatively high attrition; for example the Kagera Health and Development Survey lost 31% of their respondents from 1994-2004. However, specially designed panels such as the Indonesia Family Life Panel or the Kenya Family Life panel, which place high priority on minimization of attrition (though tracking of migrants, for example), have achieved much lower attrition rates: The Indonesia panel attrition rate was only 9%-13% over 4 separate survey waves (Thomas et al. 2010), while the Kenya Life Panel Survey had 17% attrition over seven years (Miguel et al. 2010), and the South Africa KIDS survey had 16% attrition over 5 years. Dillon (2010) achieved an attrition rate of 2%. Over shorter periods of time (comparable to our survey’s 1-2 year period), many recent randomized controlled trials have managed to track the vast majority of their beneficiaries from baseline to follow up.12 If one takes into account that there was a considerable time lag between baseline survey and mobile survey (of 8 rounds) and another four months lag when management of the survey was transferred to the World Bank, the rate of non-response and attrition is not only relatively low, there is ample room for improvement. Distributing phones and enhanced enumerator and respondent training should make it feasible to largely avoid the initial reduction in the sample from 550 to 458. Distributing solar chargers, for instance to those with limited access to electricity would enhance response rates further: for instance those with access to electricity answered on average in 18.6 rounds versus 16.4 for those without access to electricity. And this is in Dar es Salaam where electricity is relatively easily accessible, at least in comparison to rural areas. Even the choice of phone provider matters, as those using the premium network respondent significantly more often (20.1 times) than those using any of the other networks (16.9 times). 6. Is the Tanzania mobile survey representative? Attrition and non-response are particularly problematic when they occur in a non random manner. If attrition is truly random, then the representativeness of the post-attrition sample is comparable to that of the baseline sample, meaning that while sample size has decreased (and standard errors have increased), the point estimates of the follow up survey are still unbiased estimates of the true population mean. If attrition and non-response are non-random and are 12
See Duflo, Glennerster, and Kremer, “Using Randomized Experiments in Development Economics Research: A Toolkit”, section 6.4 for a discussion of attrition issues in randomized controlled trials.
12 | P a g e
associated with observable characteristics of respondents which have been recorded in the baseline survey, then it is also a manageable problem, and can be addressed by re-weighting the remaining respondents by the inverse of the probability of attrition.13 A final possibility is that attrition is non-random but associated with unobservable characteristics of respondents. In this case, attrition is quite harmful to the representativeness of the survey: since attrition is based on unobservable characteristics, the survey sample cannot be reweighted according to these (unknown) characteristics.14 This is certainly possible in our survey, as in any panel survey, but it is essentially untestable. The question that we address here is whether, given the sizeable attrition and non-response in the Tanzania mobile survey (at least in comparison to the baseline), the Tanzania survey can still be considered representative. Given our detailed baseline survey, we can use regression analysis to see whether attrition is closely linked to observable demographic and behavioral characteristics, or whether it appears to be largely random. Table 1 presents regression analysis of the determinants of attrition. In the regressions presented below, the dependent variable is the number of rounds (out of 25) in which the household participated.15 Column one presents a model including all 550 initially-visited households. In this model, economic status is significant predictor of survey participation: households without a phone, those using non-premium phone providers and those in the second poorest income quintiles are significantly less likely to participate relative to households of median wealth. Unsurprisingly for a survey that did not distribute mobile phones, wealth is found to be correlated with survey participation. In column two, when we restrict the regression to households that were identified as reachable in round 8, we find that the impact of wealth largely disappears. In this regression, location (living in rural Dar es Salaam) and using the premium provider remain significant variables.
13
Alderman et al (2001) suggest that even where attrition is non-random, key parameter estimates are often not affected, using examples from Bolivia, Kenya, and South Africa. Fitzgerald et al (1988) draw similar conclusions from the US-based Panel Survey on Income Dynamics, as does Falaris (2003) with respect to surveys in Peru, CoteD’Ivoire and Vietnam (cited in Thomas et al 2010.) 14 Frankenberg et al al and Beegle, DeWeerdt, and Dercon 2008 suggest that attrition in developing country settings is likely to be related to unobservable traits, in part because attrition is often linked to migration. 15 As will be explained later, in the third regression round 1 is used to determine persistence in non-response. To avoid autocorrelation, this round is omitted from the sum of rounds in which the household participated.
13 | P a g e
Table 1: Three OLS regressions on participation in the mobile phone survey. Dependent variable is the number of times a respondent participated in the last 25 survey rounds Regression 1
Regression 2
D-unreachable in round 1 D-male
-1.176 -0.017 -1.5 0.0 D-owns phone 6.003 1.468 6.3 1.4 Age -0.008 -0.017 -0.3 -0.6 Years of schooling 0.048 0.031 0.4 0.2 D-rural -0.640 -1.786 -0.6 -1.7 D-house has electricity -0.074 -0.130 -0.1 -0.3 D-poorest quintile -2.126 -0.815 -1.6 -0.6 D-second quintile -2.181 -1.774 -1.8 -1.5 D-fourth quintile 0.890 1.164 0.7 1.0 D-wealthiest quintile -1.086 -0.576 -0.8 -0.5 D-receives Tshs 300 -0.247 0.150 -0.3 0.2 D-receives Tshs 400 -1.144 -0.635 -1.2 -0.7 D-Vodacom 5.755 2.016 4.7 1.7 D-Tigo 2.580 -0.907 2.7 -0.9 Contant 9.313 17.399 4.3 7.5 Obs 542 450 R-squared (adj) 0.18 0.04 T-values in italics underneath the coefficient. Significant coeffients (p


![Gendered Language - Editorial Express [PDF]](https://m.moam.info/img/260x300/gendered-language-editorial-express-pdf_6479c557098a9ef16d8b4666.jpg)