Collectively Representing Semi-Structured Data from the Web Bhavana Dalvi School of Computer Science Carnegie Mellon University Pittsburgh, PA 15213
[email protected]
William W. Cohen School of Computer Science Carnegie Mellon University Pittsburgh, PA 15213
[email protected]
Abstract In this paper, we propose a single lowdimensional representation of a large collection of table and hyponym data, and show that with a small number of primitive operations, this representation can be used effectively for many purposes. Specifically we consider queries like set expansion, class prediction etc. We evaluate our methods on publicly available semi-structured datasets from the Web.
1
Introduction
Semi-structured data extracted from the web (in some cases extended with hyponym data derived from Hearst patterns like “X such as Y”) have been used in several tasks, including set expansion (Wang and Cohen, 2009b; Dalvi et al., 2010) automatic setinstance acquisition (Wang and Cohen, 2009a), fact extraction (Dalvi et al., 2012; Talukdar et al., 2008)), and semi-supervised learning of concepts (Carlson et al., 2010). In past work, these tasks have been addressed using different methods and data structures. In this paper, we propose a single low-dimensional representation of a large collection of table and hyponym data, and show that with a small number of primitive operations, this representation can be used effectively for many purposes. In particular, we propose a low-dimensional representation for entities based on the embedding used by the PIC algorithm (Lin and Cohen, 2010a). PIC assigns each node in a graph an initial random value, and then performs an iterative update which brings together the values assigned to near-by nodes, thus producing a one-dimensional embedding of a graph. In past work, PIC has been used for unsupervised clustering of graphs (Lin and Cohen, 2010a); it has
Jamie Callan School of Computer Science Carnegie Mellon University Pittsburgh, PA 15213
[email protected]
also been extended to bipartite graphs (Lin and Cohen, 2010b), and it has been shown that performance can be improved by using multiple random starting points, thus producing a low-dimensional (but not one-dimensional) embedding of a graph (Balasubramanyan et al., 2010).
2
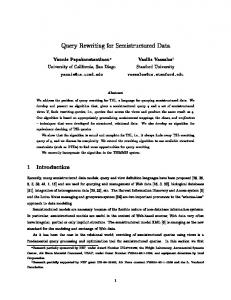
The PIC3 Representation Entity-suchas bipartite graph suchas
Entity-column bipartite graph entity
table-column
Figure 1: Entities on the Web
We use PIC to produce an embedding of a tripartite graph, in particular the data graph of Figure 1. We use the publicly available (Dalvi et al., 2012) entity-tableColumn co-occurrence dataset and Hyponym Concept dataset. Each edge derived from the entity-tableColumn dataset links an entity name with an identifier for a table column in which the entity name appeared. Each edge derived from the Hyponym Concept Dataset links an entity X and a concept Y with which it appeared in the context of
a Hearst pattern (weighted by frequency in a large web corpus). We combine these edges to form a tripartite graph, as shown in Figure 1. Occurrences of entities with hyponym (or “such as”) concepts form a bipartite graph on the left, and occurrences of entities in various table-columns form the bipartite graph on the right. Our hypothesis is that entities co-occurring in multiple table columns or with similar suchas concepts probably belong to the same class label. Since we have two bipartite graphs, entitytableColumn and entity-suchasConcept, we create bipartite PIC embeddings for each of these in turn (retaining only the part of the embedding relevant to the entities). Specifically, we start with m random vectors to generate m-dimensional PIC embedding. Since we have two bipartite graphs, entitytableColumn and entity-suchasConcept, we create PIC embeddings for each of them separately. The embedding for entities is then the concatenation of these separate embeddings (refer to Algorithm 1). Below we will call this the PIC3 embedding. Figure 2 shows the schematic diagrams for final and intermediate matrices while creating the PIC3 embedding. We have experimented with a version of this algorithm in which we create PIC embeddings of the data by concatenating the dimensions first instead of computing separate embeddings and later concatenating them. We observed that the version showed in Algorithm 1 performs as good as or better than its variant.
Algorithm 1 Create PIC3 embedding 1: function Create PIC3 Embedding(E, XT , XS , m):
XP IC3 2: Input: E: Set of all entities,
3: 4: 5: 6: 7: 8: 9: 10: 11: 12: 13: 14: 15: 16:
XT : Co-occurrence of E in table-columns, XS : Co-occurrence of E with suchasConcepts, m: Number of PIC dimensions per bipartite graph Output: XP IC3 : 2*m dim. PIC3 embedding of E. XP IC3 = φ t = a small positive integer for d = 1 : m do V0 = randomly initialized vector of size |E| ∗ 1 Vt = PIC Embedding(XT , V0 , t) Add Vt as dth column in XP IC3 end for for d = 1 : m do V0 = randomly initialized vector of size |E| ∗ 1 Vt = PIC Embedding(XS , V0 , t) Add Vt as dth column in XP IC3 end for end function
Our hypothesis is that these embeddings will cluster similar entities together. E.g. Figure 3 shows a one dimensional PIC embedding of entities belonging to the two classes “city” and “celebrity”. The value of embedding is plotted against its entityindex, and color indicates the class of an entity. We can clearly see that most entities belonging to the same class are clustered together. In the next section, we will discuss how the PIC3 embedding can be used for various semi-supervised and unsupervised tasks.
n * m PIC embedding m