Collision Awareness Using Vibrotactile Arrays Aaron Bloomfield∗
Norman I. Badler†
The University of Virginia
The University of Pennsylvania
A BSTRACT What is often missing from many virtual worlds is a physical sense of the confinement and constraint of the virtual environment. To address this issue, we present a method for providing localized cutaneous vibratory feedback to the user’s right arm. We created a sleeve of tactors linked to a real-time human model that activates when the corresponding body area collides with an object. The hypothesis is that vibrotactile feedback to body areas provides the wearer sufficient guidance to acertain the existence and physical realism of access paths and body configurations. The results of human subject experiments clearly show that the use of full arm vibrotactile feedback improves performance over purely visual feedback in navigating the virtual environment. These results validate the empirical performance of this concept. Keywords: haptics, sensory substitution, tactile array, tactor Index Terms: I.3.7 [Computer Graphics]: Three-Dimensional Graphics and Realism—Virtual Reality H.5.2 [Information Interfaces and Presentation]: User Interfaces—Haptic I/O; Evaluation/Methodology H.1.2 [Models and Principles]: User/Machine Systems—Human Factors 1 I NTRODUCTION The virtual experience of a confined space may be satisfying in a visual but not haptic sense. By flying through the space one can get excellent visual impressions of its shape and relationships. Yet there are important reasons for going beyond visual realism. If one needs to reach or maneuver inside the space – say to do complex equipment maintenance or repair – then the flying eye and the disembodied hand are no longer adequate paradigms for virtual equivalents of physical presence in the scene. Thus, applications which require experiencing and testing the feasibility of physical access for the entire body cannot be supported in realistic (i.e. low) cost virtual environment configurations. Such an application is maintenance and repair, as learning techniques on a real device exposes it to additional wear and tear, and may require taking it off line. If the appropriate hardware were readily available, complex repairs could be practiced first in a virtual environment. Currently, the end-effector haptic experience of the Phantom device is one of the few practical devices that provide a sense of confined immersion. To feel fully immersed in a virtual environment, haptic feedback should extend beyond the end effector. In the real world, one feels tactile feedback across the entire skin surface, and not just as a force applied to the hands. Simulating this sense of fullbody tactile feedback ought to increase the user’s sense of presence in the virtual world. Moving the point of view in a virtual environment is easily accomplished by direct sensing of head position or via interactive input device surrogates such as mice or 3-D widgets. Likewise, observing one’s body pose through an avatar in the virtual environment is relatively easy with commercially available motion cap∗ e-mail: † e-mail:
[email protected] [email protected]
ture systems. While obtaining spatially-limited force feedback at an end-effector is relatively straightforward, e.g. with a Phantom device, supplying a user with force or tactile feedback on a larger body area is very difficult. Typically an exoskeleton approach, which is expensive, clumsy, relatively non-portable, and possibly even dangerous to wear, is the only method [6]. As an alternative to an exoskeleton, we propose using a tactile actuator (tactor) instead of force feedback. A tactor is a small pneumatic or electronic controlled pressure point that can be actuated as a cutaneous stimulus. The tactor lowers the complexity as well as the cost of the system, while still providing sufficient haptic feedback to allow the user to ascertain when a collision occurs. One highly successful application of tactors is in a flight jacket that is worn next to the skin of a pilot, which provides spatial, gravitational, or threat information during flight [17, 24]. There are many possible tactor designs available today, including voice coil motors, shape memory alloys, or piezo-electric benders [6, 12]. We used vibratory motors. In our system, motion capture is used to find the body pose in 3-D space; the tactor locations are computed from the body pose and the known positions of the tactors on the subject. Intersections between tactor locations and virtual object geometry are checked hierarchically with bounding volumes then with detailed object geometry to optimize performance. Once a collision occurs, the corresponding tactor is energized. The vibrotactile sensation is meant to augment a visual view of the scene and aid the user in establishing a collision-free pose in the space. 2
R ELATED W ORK
The related work falls into three main categories: the use of tactor arrays, cutaneous stimulation, and sensory substitution. 2.1
Tactor Arrays
Rupert has studied the use of tactor arrays for haptic feedback with the goal to better inform a pilot of their aircraft state. The system used an array of tactors in a flight jacket to signal the true gravity vector (among other aspects) to the pilot’s torso during complex flight maneuvers [17]. Similar research has been performed by van Erp [27], and by Cholewiak with sensory-impaired (blind and deaf) individuals [9, 10]. Tan has used a wearable haptic display consisting of a tactor array sewn into a vest and worn on the back. Subjects tested the system on an aircraft that moved in and out of free fall. These experiments studied how subjects experience various haptic sensations in altered gravity [26]. They found that using the device showed limited improvement, due in part to the subject’s excitement from being in free fall. Other researchers have constructed tactile array systems, with the goal of providing haptic feedback to the user. Nakamura [23] placed tactors in a vest to impart information to the user. Lindeman [21] used a 3×3 tactor array placed on a subject’s back, and focused on identifying which of the vibratory tactors were active, as well as examining sensitivity issues. Yano created a 12 tactor array used to aid navigation in a virtual world [29]. None of these systems used tactor arrays to provide body pose collision awareness.
2.2
Cutaneous Stimulation
There has been significant research in cutaneous stimulation, much of it in the medical field. Only the most relevant is discussed here. Burdea [6] provides a good overview of how human nerve sensors cease sending signals to the brain when exposed to a constant stimulation. We analyzed skin habituation in separate experiments to ensure it would not be encountered in our experiments. Burdea also discusses the two-point limen, which is the minimum distance that various parts of the body can differentiate two distinct points (for example, the points of a draftsman’s compass) from a single point. Weinstein did an extensive experimental study of the two-point limen distance [28], which we used in our decision of how and where to place the tactors. Although further research has provided alternate means of measuring the limen [11], this did not affect our tactor placement. Researchers have also focused on the efficacy of different types of tactile sensation [3]. We chose vibratory stimulation because it could be reproduced easily in other haptic environments, it is relatively inexpensive, and the components are easily obtainable. 2.3
Sensory Substitution
Bach-y-Rita et al. define sensory substitution as “the provision to the brain of information that is usually in one sensory domain . . . by means of the receptors . . . of another sensory system . . . examples include sign language for the deaf, and Braille for the blind” [2]. Kaczmarek et al. present a good overview of the various factors that need to be considered for sensory substitution systems [16]. We took these into account when designing our system. Prior research has found that providing haptic feedback will improve a user’s task training performance in a virtual environment. Adams used force feedback in a VR environment for constructing a LEGO airplane [1], and found an increase in the user’s performance. Cheng substituted vibratory feedback for force feedback, but not for collision detection [7]. Neither of these domains contained vibrotactile feedback for collision detection. Our experimental design allows us to largely avoid a common difficulty of multiple feedback modalities that can confuse the user. A common example is the McGurk effect, where the visual modality is used to cause the subject to interpret the auditory modality differently [13]. Ernst and Banks have presented a formal model for how the mind combines inputs across different modalities [14]. Using estimates of a perception, such as slant [15], the model uses a weighting based on the variance of the estimates. Our research focuses on a performance metric, and does not yield a perception estimate that can be used with this model. This is planned for future research. Lederman studied how humans process multi-modal inputs [20], including conflicting and resolving multi-modal inputs [19]. She suggests that haptic feedback is better for material and texture based identification tasks, and vision is better for spatial perception tasks. Choi and Tan dealt with identification of textured surfaces, and had mixed results as to which modality (haptic or vision) plays a more dominant role [8]. This is largely due to the choice of task, which will directly influence the result. 3
H ARDWARE
We constructed vibratory tactors from commercially available parts. We attached a direct current motor with an eccentric mass to a Velcro mount. When a voltage is applied, a vibratory sensation is felt. Our initial use of Velcro straps to attach the tactors to the arm allowed for a very flexible design, but the tactors’ vibrations that were transmitted around the arm created too diffuse a sensation. Thus, we created three customized tactor sleeves made from longsleeve, skin-tight elastic athletic shirts of various sizes [4, 5]. The Under Armour shirt (Turf Shirt, item 0032) is thin enough to transmit the vibrations yet strong enough to affix the Velcro mounts. The
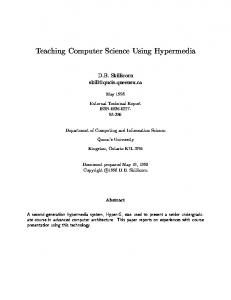
shirt held the tactors flat against the subject’s skin, allowed freedom of movement, and stretched to fit many different sized people. Figures 1(a) and 1(b) show the suit without and with the tactors and motion capture markers attached. The tactors were located in four “rings” of four tactors each, which were arranged along the forearm and upper arm, as shown in Figure 2(a). Because the required task was designed to provide more sensation to the forearm than the upper arm, the former had three rings of tactors, and the latter had one ring. Eight tactors were placed on the hand; four around the base of the hand, and on each of the digits except the little finger (Figure 2(b)). The hand model (Figure 2(b)) was not intended to be realistic; rather it was designed to provide sufficient feedback to the various parts of the hand and lower the computational load on the real-time collision detection routines. The little finger was intentionally removed, as it was not supplied with a tactor. For the experiment, the subject was placed in a room-sized wireless (infrared) motion capture device (a ReActor by Ascension Technology Corporation). One of the walls of the motion capture device consisted of a large projection screen, which provided the visual display. The tactors were activated by a series of three relay boards. Each relay board was only capable of switching the power on or off – voltage regulation was not possible. Thus, the amplitude of the tactors’ vibration was fixed, but their frequency was modified, as discussed below. The latency from the visual display was approximately 43 ms, and the latency from the haptics hardware was approximately 68 ms [4]. The visual display updated almost immediately, and the haptic sensations followed shortly (25 ms) thereafter. These latencies are considered low and medium latency, respectively [22]. No subjects reported sensing a delay between the visual alerts and the haptic sensation, based on informal questioning. 4 E XPERIMENTAL D ESIGN The experiment consisted of a simple reaching exercise1 . The subjects had to reach their right arm into each of the six puzzles shown in Figure 3(a). The objective was to touch the sphere at the end of each puzzle with his or her virtual hand, without colliding with the rest of the puzzle. Touching the sphere would signal a successful puzzle completion; the puzzle would then disappear, and the subject would move on to the next one. The puzzles could be completed in any order. If a collision did occur (other than the hand colliding with the sphere), the puzzle would not complete. This ensured that the subjects made an effort to minimize the number of collisions. A partially completed experiment is shown in Figure 3(b). Although the puzzles look small in the figure, they were displayed on a 2 m high by 2.5 m wide (6’ × 7.5’) projection screen, which the subject was facing. To reduce the chance of simulator sickness, the perspective was fixed, and did not change as the subject moved [18]. Thus, as the subject moved his or her arm, a disembodied arm and shoulder was displayed moving about the virtual environment. The arm was shown translucent (α = 0.5) so that the subject could see the parts of the puzzle it occluded. Although the translucent arm is difficult to see in Figure 3(b), it is more visible in Figure 4(b). This particular puzzle perspective was chosen so that, in some of the puzzles, it was difficult or impossible to see all of the hand when it was inside the puzzle. The puzzles required the arm be inserted up to about the elbow in order to touch the sphere, as shown in Figure 4(a). Note that the puzzles are shown translucent and the arm opaque to create this image; in the simulation, the reverse was true. A test version of the simulation experiment provided to the first few subjects was a full 1 The experimental design and procedure described in this article was approved by the Institutional Review Board of the Office of Regulatory Affairs of the University of Pennsylvania (protocol number 708331).
(a) Tactor suit
(a) Initial simulation
(b) Partially completed (b) Tactor suit with the tactors attached Figure 3: Collision experiment simulation task Figure 1: Tactor suit
(a) Arm reach depth required in puzzles (a) Arm model
(b) Visual collision alerts (b) Hand model Figure 2: Arm and hand models with tactor placements
Figure 4: The virtual arm
arm reach task where the subjects had to insert their entire arm, up to the shoulder, into a puzzle. This was found to be too difficult for the subjects to perform; many could not complete the experiment at all. Thus, the puzzles were made tractable by reducing the amount of reach required. The length of the subject’s forearm and upper arm were normalized to a fixed length within the graphical coordinate system, regardless of the length of the subject’s actual arm. This ensured that each subject had to perform the same amount of reach into the puzzles. 4.1
Feedback Modalities
This experiment provided the subjects two types of feedback: visual and haptic (tactors). Each of the two feedbacks could be either on or off for a particular subject. This created four experimental groups, as shown in Table 1, to which the subjects were randomly assigned.
Visual feedback
off on
Haptic feedback off on None Tactile Visual Both
Table 1: Experimental group names
The arm was shown translucent so the subjects could see the occluded sides. The parts of the arm that collided with an object turned red, as shown in Figure 4(b); this was the visual feedback. The parts of the arm that are not colliding are blue. The collisions are colored magenta in the figure to increase contrast. The colliding areas (the elbow, the middle of the forearm, and the hand) are a lighter shade of gray in the gray scale version of Figure 4(b). Note that all groups saw their arm moving in the virtual environment; the visual feedback consisted of seeing the areas of the arm turn red that were colliding with a virtual object. 4.2
Collision Depth
We classified subject-object collisions into three categories, based on the depth d of the collision. Shallow collusions, d < δ , did not provide any indication that a collision occurred (Figure 5(a)): neither the tactors nor the visual collision alerts were activated. There are two reasons why collisions do not provide noticeable feedback. First, they prevent a light or sliding contact with the object, as opposed to an impact collision with the object, from activating the tactor and causing the subject to feel they are “inside” the object. Thus, a collision would not occur if the arm was just brushing or contacting an object. The second reason that shallow collisions do not provide feedback is that the surface of the skin can deform to allow movement that an arm with a rigid skin surface could not do. Using a deformable skin surface was beyond the scope or necessity of these experiments [25]. To ensure a perceptible sensation, we used a combination of medium and deep collisions. Medium depth collisions, δ ≤ d ≤ ∆, had the tactor constantly activated until the colliding body part was removed from the object (Figure 5(b)). Deep collisions, d > ∆, were indicated by a pulsing tactor with a 200 ms pulse period (Figure 5(c)). The reason for the pulsing tactors on the deep collisions was to provide a more “urgent” sensation to the user to indicate the deep collision. This pulse period was chosen based on prior informal experiments, as that frequency provided the most noticeable tactile sensation for the subjects. The values of δ and ∆ were determined by informal trial runs prior to the formal human subject experiments. During a collision, all the tactors on those parts of the arm that were colliding with an object were activated (deep collisions in a
pulsing manner). Thus, for the group with both feedback modalities, they saw the visual collision alerts on the same parts of the arm that they felt the vibrations. 5
E XPERIMENTAL P ROCEDURE
Right-handed subjects were recruited from the student and staff population at the University of Pennsylvania. All subjects were fluent English speakers, and all had at least a high school (or equivalent) level of education. Subjects were paid for their participation. The experiment was performed in front of a flat projection screen. The subjects were shown a video demonstration, with narration, of the task that they needed to perform in the experiment. The narration was intentionally designed to be easy to understand (Flesch-Kincaid reading level2 of 6.1). The subjects were allowed to ask questions about the demonstration. Two questionnaires were given, one after the demonstration and before the experiment, and the other after the experiment. The subjects were told that all the puzzles pointed straight back, and this particular perspective made them look like the outside puzzles were pointing inward. Confusion over this perspective in prior experiments caused a number of the subjects to angle their arms inward, preventing them from completing the puzzles with the minimum number of tactor activations. The subjects were told how the height of the puzzles was adjusted, and were instructed how to lower them to their preferred height. Lastly, in an effort to lower the number of objectives for the experiment, the subjects were told that it did not matter how long they took to perform the experiment; the objective was solely to lower the number of collisions. Subjects were randomly assigned to one of the four experimental groups shown in Table 1. Subjects who were in one of the two groups that used tactile feedback were given a demonstration of what a constant tactor activation and a pulsing tactor activation felt like, so that they could compare the two. They were told that the pulsing tactor activation was used to indicate deep collisions. All subjects wore all the tactors, even if the tactors were not going to be activated for their experimental runs. This was to ensure that arm fatigue would not be a differentiating factor between the experimental groups. For subjects in the two groups that received tactile feedback, the tactors were checked to ensure they were all working after suiting the subject up and prior to running through the simulation. 6
S TATISTICS
AND
E XPERIMENTAL M EASURES
The main data point was the number of tactor activations (described below) that occurred. Each group performed six trials of the simulation, where each trial consisted of completing the six puzzles shown in Figure 3(a). The first two trials counted as training runs, and thus the last four trials were averaged to produce this metric. The results showed that the subjects’ performance stabilized after the first two trials, as shown in Figure 6(a). Time taken to complete the simulation was also measured, but the subjects were told that time taken did not matter. Other metrics recorded included the number of collisions on the arm and hand, and the number of deep collisions. The number of tactor activations per trial is a weighted metric. The total number of tactor activations for each frame of the motion capture system (which ran at 33 frames per second) was summed to create this metric. Thus, a single tactor active for 1 second would count as 33 activations. For the groups without tactile feedback, the activations were computed as if they had activating tactors. 2 The Flesch-Kincaid grade reading level is computed by .39 × AW S + 11.8 × ASW − 15.59, where AW S is the average words per sentence, and ASW is the average number of syllables per word. It corresponds to the US grade-school reading level of the given document.
(b) δ ≤ d ≤ ∆
(a) d < δ
(c) d > ∆
Figure 5: Collision depth (d)
7
E XPERIMENTAL R ESULTS
A total of 42 valid experimental trials were performed, 25 males and 17 females. 7.1
Demographics
The demographics of the valid subjects are shown in Table 2. Demographic data (sex, age, and education completed) was analyzed across all the groups using t-tests, and no statistically significant differences were encountered (α = 0.05). Group All None Visual Tactile Both
n 42 11 10 11 10
♂ 25 8 4 8 5
♀ 17 3 6 3 5
%♂ 59.5 72.7 40.0 72.7 50.0
t-tests were used to analyze the trial runs. Significant differences existed in the total number of tactor activations, but not in the average time taken per trial. This is also discussed in more detail below. A graph of the average number of tactor activations per group per trial appears in Figure 6(a). The average number of activations dropped off significantly after the first two trials, and generally plateaued by the third trial. None of the plotted lines monotonically decrease.
Avg age 24.6 25.3 24.5 26.5 22.0
Table 2: Subject demographics
7.2
Objective Results
The main metric for the objective results is the number of tactor activations, given in Table 3. Only the average of the last four trials was used unless otherwise indicated. Group
n
All None Visual Tactile Both
42 11 10 11 10
Avg tactor activations 3365.6 4886.1 4355.6 1915.8 2298.1
Activations st.dev. 2549.4 3423.4 1674.4 1391.9 1580.3
Completion time (sec) 91.2 86.2 92.5 88.4 98.5
(a) Average tactor activations per trial
Table 3: Experiment subject performance: tactor activations and time
As can be seen in Table 3, the groups with tactile feedback performed significantly better than the groups without tactile feedback. One result that we were not expecting was that the group with only tactile feedback performed better than the group with both tactile and visual feedback. This is discussed below. The average time taken to complete the trials is also given in Table 3. The subjects were told to take as much time as they needed, and thus we do not use the time taken as a measure of performance. However, it is interesting to compare the times, which is done in more detail below.
(b) Average time per trial Figure 6: Graphs of simulation performance metrics
To analyze the length of the learning curve, a one-way ANOVA was run on the number of collisions, where each trial/group combination was an ANOVA group. A Tukey post-hoc analysis showed that all the groups showed a significant improvement between the initial trial and either the 3rd or 4th trial (the group with both feedback modalities was significant at α = 0.10, all others at α = 0.05). However, there was no significant change between trials 3 and 6 for any of the groups (at α = 0.10). Thus, we proceeded with our initial assumption that the first two trials constituted the learning curve, and the performance generally plateaued for the last four trials. A visual inspection of the graph in Figure 6(a) further confirms this hypothesis. An interesting and unexpected feature can be seen in the plotted data of the group without any feedback between trials three and four: the number of activations increased. While all the groups had an increase at some point, the increase for this group is more pronounced. Our hypothesis as to the cause of the decrease in performance is that this group had more arm fatigue from the first two trials than the other groups, as they took longer for the first trial. The decrease in performance (increase of tactor activations) from trials three to four for the group with no feedback was from 3268.7 to 6552.1. Because of the wide standard deviation for the group with no feedback during trial four, this decrease in performance is not statistically significant. However, the decrease in performance from trial three to trial five (3268.7 to 5949.7) is statistically significant (at α = 0.05). A graph of the average time taken per trial for each group can be seen in Figure 6(b). The group with no feedback took longer to perform the first trial than the other groups. This is not a statistically significant increase in time over the average (at α = 0.05). This supports (but does not prove) the hypothesis that arm fatigue led to decreased performance in trial four. Other metrics that were analyzed (hand activations, arm activations, deep activations, etc.) did not produce any further interesting results. 7.3
Subjective Results
The questions asked on the questionnaires are summarized in Table 4, along with the results. The first five questions were on the pre-experiment questionnaire. Questions 7 to 14 dealt with the tactors, and thus only two of the groups answered them. Likewise, question 6 dealt with the visual collision alerts, and only two of the groups answered that question. Each question was rated on a Likert scale of 1 to 5, where 1 meant “very low” or “very little” and 5 meant “very high” or “very much”. The amount of 3-D experience was the main subjective metric used for comparing the groups, and this is discussed in more detail in the analysis. The exact question was, “How much experience have you had with 3D environments (games, animation programs, graphical programming, etc.)?” Essentially, there was no statistically significant difference between the 3-D experiences of any of the group combinations. The amount of virtual reality experience is a less useful metric – it was much less common to have virtual reality experience than 3-D experience, and thus a larger number of subjects would be required before we could effectively compare this result. The motion sickness and eye strain questions were on the questionnaire to ensure that the subjects would not encounter these from using the system. A number of design decisions were made to ensure the comfort and accuracy of the tactor suit. The suit was considered moderately comfortable, with an average response of 3.43. The tactor activations were considered highly accurate, with an average response of 4.24. The tactile feedback seemed to help subjects more than the visual feedback (average responses of 4.57 versus 3.40). This agrees
with the objective results, described below, which show that the groups with tactile feedback performed better than the groups with no tactile feedback. Subjects felt they encountered skin saturation very rarely (average response of 1.52), as was indicated by previous skin habituation experiments. The pulsing tactor was considered more intense of a signal than the constant tactor (average response of 3.43), which is fairly close to the value of 4.0 obtained from previous tactor pulsing experiments. Question 11 had some disappointing results. The exact wording of the question is, “How much did you feel the tactor acted only as a signal (telling you that there was a collision somewhere, but not where that collision was) as opposed to a spatial indicator (telling you exactly where the collision occurred)?” The allowed responses ranged from only as a signal for 1, to both as a signal and a spatial indicator for 3, to only as a spatial indicator for 5. The result, 2.67, was less than we had expected. It was consistent across the two groups that used the tactors. However, the objective results described below show a significant improvement with the use of the tactors. Thus, while the subject’s intuition may have caused them to rate the tactor activations more as a signal, it may still have served quite well as a spatial indicator. The fact that multiple tactors were activated at any given time also contributed to the lower than expected result for this question. Lastly, the pulsing tactors did not seem to be of much use to the subjects. They were somewhat difficult to sense (average response of 2.52), and were not perceived to help significantly (average response of 2.48). One factor that affected this was that during a collision, all the colliding tactors were activated, which made it difficult to sense which individual tactors were pulsing. In future research we would like to lower the number of tactors that activate during a collision, so that only one tactor would activate, for example, one chosen to indicate the shortest exit vector. 7.4
Analysis
A one-way ANOVA was performed on the average number of activations for the last four trials for each group (F(3, 12) = 6.989, p = 0.0057). A Tukey analysis indicated that the greatest differences existed between the tactile group and the group with no feedback, and between the group with both feedbacks and the group with no feedback. A one-way ANOVA for time did not show any statistically significant differences between the groups (F(3, 12) = 0.6085, p = 0.62). t-tests were run on the average number of activations for the last four trials for each group. The results of the t-tests are shown in Table 5. The last column shows the exact significance level (α value) for that row. This table contains the main data analysis that supports our hypothesis. Note that it does not make sense to compare the remaining group combination (visual feedback versus tactile feedback) via t-tests, as one cannot be considered a control for the other. Group feedback None None None Visual Tactile
Group feedback Visual Tactile Both Both Both
ν (dof)
t value
Significance (α)
19 20 19 18 19
0.457 2.666 2.257 2.826 -0.586
0.321 0.007 0.014 0.006 0.275
Table 5: t-test tactor activation analysis results
In the three combinations where the difference between the two groups included the addition of tactile feedback (the middle three rows), the results were all significant (at α = 0.05). Furthermore, in the two combinations where the only addition was the tactile
Question 1 2 3 4 5 6 7 8 9 10 11 12 13 14
Amount of prior 3-D experience Amount of prior VR experience Motion sickness susceptibility Computer eye strain susceptibility Perceived difficulty of demo actions Collision realization aided by visual feedback Collision realization aided by tactile feedback Comfort of wearing the tactors Amount that skin saturation was encountered Tactor was a signal (1) or spatial indicator (5) Accuracy of the tactor activations Intensity of a pulsing tactor vs. a constant tactor Ability to sense pulsing tactors Amount the pulsing tactors helped
All n = 42 2.76 1.74 1.45 1.36 2.07 3.40 4.57 3.43 1.52 2.67 4.24 3.43 2.52 2.48
Feedback type None Visual Tactile n = 11 n = 10 n = 11 2.45 2.50 3.18 1.36 1.70 1.91 1.36 1.80 1.36 1.36 1.30 1.45 2.18 2.30 1.82 3.60 4.27 3.55 1.45 2.64 4.36 3.73 2.36 2.27
Both n = 10 2.90 2.00 1.30 1.30 2.00 3.20 4.90 3.30 1.60 2.70 4.10 3.10 2.70 2.70
Table 4: Experiment questionnaire questions and results
feedback (the second and fourth rows), the results were highly significant (at α = 0.01). For the two groups where the difference between the two groups did not include the addition of tactile feedback, and thus was only the addition of visual feedback (the first and fifth rows), the results were not significant (at α = 0.05). There is also a significant increase from the group with no feedback to the group with both feedbacks (the middle row). While it is significant at α = 0.025, it is not as significant an increase in performance as with the two combinations where the only addition was the tactile feedback (the second and fourth rows). We were expecting the increase in performance that we found with the addition of the tactile feedback. What we were not expecting was the decrease in performance from the tactile only group to the group with both feedbacks. This difference in performance, between the tactile only group and the group with both feedbacks (the bottom row in Table 5) is not significant. Our hypothesis is that the addition of both feedback modalities added too much information, causing the subjects to be distracted by the visual alerts, and to not respond to the tactile alerts as well as the tactile only group. This was supported by a few informal subject comments after the experiments. There were two questions that had statistically significant differences on the questionnaires (at α = 0.05). The group with no feedback differed significantly with both the tactile feedback group and the group with both feedbacks on question 2 (amount of prior VR experience). The tactile group and the group with both feedbacks differed significantly on question 7 (collision realization aided by tactile feedback). The results from these questions are shown in Table 6, along with the performance results reported above. The questionnaire results that were statistically significantly different are shown in bold in each column. Group
n
All None Visual Tactile Both
42 11 10 11 10
Tactor activations 3365.6 4886.1 4355.6 1915.8 2298.1
Q2 avg 1.74 1.36 1.70 1.91 2.00
Q2 stdev 0.66 0.64 0.64 0.67 0.45
Q8 avg 4.57
Q8 stdev 0.73
4.27 4.90
0.86 0.30
Table 6: t-test statistically significant questionnaire differences
The differences in the amount of virtual reality experience (question 2) concerned us. As mentioned above, it is much less common to have VR experience than 3-D experience, and thus a larger pop-
ulation would be required before we could effectively compare this result. Because there were no statistically significant differences in the amount of 3-D experience, and due to the small population (n = 42), we did not feel that the virtual reality experience metric differentiated the experimental groups. The difference in how much the tactors helped between the groups is very high for both groups (4.27 and 4.90). It is interesting to note that of the two groups with tactile feedback, the group that performed worse (the group with both feedbacks) felt that the tactile feedback was more important than the group with only tactile feedback, perhaps because they judged it based on the visual feedback, and the visual feedback may have hindered them. 7.5
Discussion
The result we found most surprising was that the tactile group performed better than the group with both feedbacks (1915.8 and 2298.1 activations per trial, respectively). There are a number of possible explanations for the lack of increase in performance for the group with only visual feedback. One explanation is that the virtual environment may have handicapped the visual only group more. The perspective of the puzzles, as well as the transparency of the arm itself, was purposely designed to occlude the subject’s view of the inside of the puzzle. However, the highly statistically significant results (the two combinations where tactile feedback was added both had results that were statistically significant at α = 0.007) implies that this is not the sole cause of the lack of performance from the visual only group, and that the haptic feedback modality provided a major influence in the performance differences. An alternative explanation is that the simultaneous collision caused an overload of tactile feedback. During a collision, all the tactors that were colliding with the offending object were activated at once. Although the subjects were obviously able to discern the exit vector direction, as evidenced by their performance results, this method of tactile feedback can be improved upon. Only activating one tactor, which would indicate the shortest exit vector, would reduce the amount of tactile saturation and sensation overload the subjects experienced. The fact that this system worked well with this sensation overload indicates that even better results could be obtained if the sensation overload was reduced or removed. Despite the research on multi-modal input modalities, a question remains on how much weight is assigned to each of the modalities in a specific input situation. The results of this and other studies yield the hypothesis that each type of input modality is best for perceiving a different type of information. The input modality that is “best” will weight most heavily. In this context, “best” is a subcon-
scious decision of the mind. There is currently no qualitative way to determine a priori what the “best” input modality is for a given situation. This promises rich avenues for future research. 8
C ONCLUSIONS
Full body haptic feedback is an eventual necessity for a fully immersive experience in a virtual world. One cannot feel completely “in” a virtual world when only the hand is receiving haptic feedback. In the Star Trek “holodeck”, for example, participants feel the physicality of the virtual environment. While we are a long way from applying the physics of the external world, cutaneous stimulation can contribute part of this tactile experience. There are many virtual situations that may benefit from haptic feedback; awareness of collisions being only one of them. Refinements on our experiments suggest promising options for future research in full body haptic feedback for improved collision perception. The question that motivated this research was whether (whole body) tactile feedback can guide reach and access maneuvers in a virtual confined environment. Our system used a number of small, vibratory tactors on the user’s right arm and hand. Coupled with controlling hardware and simulation software, the result is a fully immersive simulation where the users feel collisions with virtual objects through vibrations applied to their skin. Through a large set of formal human subject experiments, the resulting data clearly show a significant reduction in virtual collisions in the subjects who used the tactors over those who did not. ACKNOWLEDGEMENTS This research was funded in part by NASA and the Office of Naval Research. R EFERENCES [1] R. J. Adams, D. Klowden, and B. Hannaford. Virtual training for a manual assembly task. Haptics-e (http://www.haptics-e. org), 2 (2), Oct.17 2001. [2] P. Bach-y-Rita, J. G. Webster, W. J. Tompkins, and T. Crabb. Sensory substitution for space gloves and for space robots. In Proceedings of Workshop on Space Telerobotics, volume 2, pages 51–57, 1987. [3] J. Biggs and M. A. Srinivasan. Tangential versus normal displacements of skin: Relative effectiveness for producing tactile sensations. In Proceedings of the 10th International Symposium on Haptic Interfaces for Virtual Environments and Teleoperator Systems, pages 121– 128, 2002. [4] A. Bloomfield. TRACE: Tactor Reach Access and Constraint Environment. PhD thesis, University of Pennsylvania, Philadelphia, PA, Dec. 2003. [5] A. Bloomfield and N. Badler. A low cost tactor suit for vibrotactile feedback. Technical Report MS-CIS-03-44, University of Pennsylvania, Philadelphia, PA, 2003. [6] G. C. Burdea. Force and Touch Feedback for Virtual Reality. John Wiley & Sons, New York, 1996. [7] L.-T. Cheng, R. Kazman, and J. Robinson. Vibrotactile feedback in delicate virtual reality operations. Proceedings of the Fourth ACM International Conference on Multimedia, pages 243–251, 1996. [8] S. Choi and H. Z. Tan. An analysis of perceptual instability during haptic texture rendering. In Proceedings of the 10th International Symposium on Haptic Interfaces for Virtual Environment and Teleoperator Systems, pages 129–136, Orlando, FL, 2002. [9] R. Cholewiak and A. Collins. The generation of vibrotactile patterns on a linear array: Influences of body site, space, and time. Perception & Psychophysics, 62 (6):1220–1235, 2000. [10] R. W. Cholewiak and M. Wollowitz. The design of vibrotactile transducers. In I. R. Summers, editor, Tactile Aids for the Hearing Impaired, pages 57–82. Whurr Publishers Ltd, London, 1992. [11] J. C. Craig and K. O. Johnson. The two-point threshold: Not a measure of spatial resolution. Current Directions in Psychological Science, 9(1):29–32, 2000.
[12] R. Fletcher. Force transduction materials for human-technology interfaces. IBM System Journal, 35 (3&4):630–638, 1996. [13] K. P. Green. Studies of the McGurk effect: Implications for theories of speech perception. In Proceedings of the Fourth International Conference on Spoken Language Processing, volume 3, pages 1652–1655, Oct.3–6 1996. [14] J. M. Hillis, M. O. Ernst, M. S. Banks, and M. S. Landy. Combining sensory information: Mandatory fusion within, not between, senses. Science, 298:1627–1630, 2002. [15] J. M. Hillis, S. J. Watt, M. S. Landy, and M. S. Banks. Slant from texture and disparity cues: Optimal cue combination. Journal of Vision, 4:967–992, 2004. [16] K. A. Kaczmarek, J. G. Webster, P. Bach-y-Rita, and W. J. Tompkins. Electrotactile and vibrotactile displays for sensory substitution systems. IEEE Transactions on Biomedical Engineering, 38 (1):1–16, Jan. 1991. [17] L. Knapp. Lost? Go vest, young man. Wired article available at http://www.wired.com/news/gizmos/0,1452,44376,00.html, June 2001. [18] E. M. Kolasinski. Simulator sickness in virtual environments. Technical Report 1027, US Army Research Institute, Alexandria, VA, May 1995. [19] S. J. Lederman, A. Martin, C. Tong, and R. L. Klatzky. Relative performance using haptic and/or touch-produced auditory cues in a remote absolute texture identification task. In Proceedings of the 11th International Symposium on Haptic Interfaces for Virtual Environments and Teleoperator Systems, pages 151–158, 2003. [20] S. J. Lederman, G. Thorne, and B. Jones. Perception of texture by vision and touch: Multidimensionality and intersensory integration. Journal of Experimental Psychology. Human Perception & Performance, 12:169–180, 1986. [21] R. Lindeman and Y. Yanagida. Empirical studies for effective nearfield haptics in virtual environments. In Proceedings of the IEEE Virtual Reality 2003 Conference, pages 287–288, California, Mar. 2003. [22] M. Meehan, S. Razzaque, M. C. Whitton, and F. P. Brooks Jr. Effect of latency on presence in stressful virtual environments. In Proceedings of the IEEE Virtual Reality 2003 Conference, pages 141–148, California, Mar. 2003. [23] M. Nakamura and L. Jones. An actuator for the tactile vest – a torsobased haptic device. In Proceedings of the 11th International Symposium on Haptic Interfaces for Virtual Environments and Teleoperator Systems, pages 333–339, 2003. [24] A. H. Rupert. An instrumentation solution for reducing spatial disorientation mishaps. IEEE Engineering in Medicine and Biology Magazine, 19 (2):71–80, Mar.–Apr. 2000. [25] H. Shin, J. Allbeck, D. M. Elliott, and N. I. Badler. Modeling A deformable human arm for constrained reach analysis. Digital Human Modeling Conference, June 2002. [26] R. Traylor and H. Tan. Development of a wearable haptic display for situation awareness in altered-gravity environment: Some initial findings. In Proceedings of the 10th International Symposium on Haptic Interfaces for Virtual Environments and Teleoperator Systems, pages 159–164, 2002. [27] J. B. F. van Erp. Tactile information presentation: Navigation in virtual environments. Proceedings of the First International Workshop on Haptic Human-Computer Interaction, pages 165–173, Aug.–Sept. 2000. [28] S. Weinstein. Intensive and extensive aspects of tactile sensitivity as a function of body part, sex, and laterality. In D. R. Kenshalo, editor, The Skin Senses, chapter 10. Charles C. Thomas, 1968. [29] H. Yano, T. Ogi, and M. Hirose. Development of haptic suit for whole human body using vibrators. Transactions of the Virtual Reality Society of Japan, 3 (3):141–148, 1998.