Collusive Communication and Pricing Coordination in a Retail Gasoline Market∗ Zhongmin Wang Department of Economics Northeastern University Boston, MA 02115
[email protected]
April 8, 2008
Abstract: This paper studies how communication is used by a retail gasoline cartel in Australia to coordinate price increases, a role of communication in collusion not highlighted by Genesove and Mullin (2001). A unique data set from the trial record allows for quantifying not only the pricing dynamics, but also the communication patterns. Both empirical and narrative evidence suggests the collusive communication and pricing behavior is well captured by the price cycle equilibrium of the Maskin and Tirole (1988) model.
JEL classification: L13, L41 Key Words: collusion, communication, war of attrition, pricing coordination
∗
I am grateful to Phillip Williams and staffs of the Federal Court Registry in Victoria, Australia for their help in accessing the trial record. For helpful comments, I thank seminar participants at the 2006 European Association for Research in Industrial Economics Conference, the 2007 International Industrial Organization Conference, and the Canadian Competition Bureau. I also thank the editor and two anonymous referees for their suggestions that considerably improved the paper. Any errors are mine only.
1.
Introduction What is the role of explicit communication in collusion? This is perhaps an open issue
in industrial organization.1 Models of collusion are typically concerned with tacit collusion, providing no role for explicit communication within a collusive equilibrium.2 Empirical studies of collusion abound,3 but few focus on the role of communication in collusion. A notable exception is Genesove and Mullin’s (2001) study of the Sugar Institute cartel. They document that meetings and notifications were used by the cartel to modify and adapt its rules, reduce misunderstandings, and investigate whether cheating occurred. They note that these roles of communication are not captured by existing models of collusion. Communication is often thought to facilitate pricing coordination, but this role is not highlighted by their study because the Sugar Institute did not directly fix prices. The current paper studies the role of communication in facilitating pricing coordination. For this purpose, we examine a price-fixing cartel recently uncovered in the Australian retail gasoline market of Ballarat. It is particularly interesting to study this retail gasoline cartel because a unique data set allows us to (1) measure quantitatively the collusive communication patterns among the firms and link the timing of communication with price increases, and (2) characterize both the pricing dynamics and the timing of communication by the Maskin and Tirole (1988, MT hereafter) Edgeworth price cycle equilibrium. These
1
Porter (2005, p. 167), for example, writes: “Arguably, illegal agreements are distinguished by communication. A cornerstone of antitrust law is the per se illegality of pricing negotiations, whether or not they result in higher prices. But what is the role of communication? …The outstanding issue is that we do not fully understand how communication affects market outcome.” 2 The existing models of collusion that incorporate explicit communication have largely focused on communication about private information. A cartel faces an information revelation problem if costs are privately observed (e.g., Cramton and Palfrey 1990, Athey and Bagwell 2001), or valuations of an auction item are only privately known (e.g., Graham and Marshall 1987, McAfee and McMillan 1992). Communication is useful in revealing private information. For example, a knockout auction is the mechanism by which a bidding ring communicates private valuation of an auction item. Communication is also useful when firms have private information about which cartel members have cheated previously (Compe 1998, Kandori and Matsushima 1998). 3 For example, there is a large literature on cartel behavior (see Levenstein and Suslow 2006 for a review).
1
features are, to the best of my knowledge, unique in the literature. Data on cartel communication are typically unavailable, and in the rare cases where data are available, pricing dynamics and communication timing may not be captured by a single collusive equilibrium.4 Besides communication and price data, we also rely on the findings of the Court and the testimonies of market participants in the trial to identify the specific roles that explicit communication plays in facilitating collusion. The main features of pricing and communication behavior in this market can be summarized as follows: First, the retail gasoline price exhibits a regular and asymmetric cycle. In the words of the Court, it “follow[s] a ‘sawtooth pattern’… prices increase rapidly over a short period of time and then steadily decrease.”5 Second, a large number of phone calls were used to coordinate price hikes, but not price decreases. Despite the large number of phone calls, a significant proportion of the price-hike attempts failed because one or more firms chose not to follow. Third, if all key gasoline sites followed the lead price hike within a few hours, a price-hike attempt would succeed, and the market price would then gradually decrease until a new price-hike attempt took place a few days later. Therefore, the obstacle to collusion in this market is a coordination problem that exists when firms increase price sequentially: Price increases by all would benefit all, but each firm would like to be the last to do so.6 The large number of phone calls were used to resolve the coordination problem by “getting the word of an increase to all competitors quickly,” 4
The lysine cartel is an example where the timing of communication among the collusive firms is largely observed (see Connor 2001 for details). The lysine cartel held many meeting to discuss prices, production levels, and market share allocations. In addition, a large number of phone calls were made to coordinate price changes and report sales information to the lysine association. It appears that neither the pricing dynamics nor the communication timing in the lysine cartel case can be captured by a single collusive equilibrium. 5 Federal Court of Australia 265, ¶3. 6 Harrington (2005, p.24) describes this coordination problem as follows: “During the time between when one firm raises its price and the other firms follow, the price leader could lose sales. This is not only costly to that firm but it could risk the stability of the cartel if the lost sales are sufficiently great to cause retraction of the price increase.” In many industries, the obstacle to collusion is incomplete and imperfect information, which makes it difficult to detect and punish secret price cutting (Stigler 1964, Green and Porter 1984).
2
verifying if other firms were to match, and mediating between the firms that strived to be the last to increase price. This paper presents evidence that these features of the communication and pricing behavior are well captured by the MT price cycle equilibrium. The MT dynamic oligopoly model is a tacit one, but a coordination problem, in the form of war of attrition, is embedded in the cycle equilibrium: Price increases by all at the cycle bottom would benefit all, but none would like to be the first to increase price. It is this war of attrition problem that captures the need for and the timing of coordination. Communication is a facilitating practice that helps resolve the war of attrition problem. Similar gasoline price cycles are currently being observed in many Australian and Canadian cities. The price hikes that abruptly end the gradual price decreases have invited public suspicion that collusion may be involved in those cycling markets.7 A few recent studies (e.g., Atkinson 2007, Eckert 2003, Eckert and West 2004, and Noel 2007a, b) have explained the observed gasoline price cycles through the lens of the MT cycle equilibrium. This literature, relying solely on price data, has so far paid little attention to the coordination problem inherent in the price cycles. The results in this paper suggest that, to fully understand the observed gasoline price cycles in a market, we need to address how the coordination problem is resolved. Regular price cycles have only been observed in gasoline markets, but the war of attrition problem is present in many other markets. It is interesting to note that firms pre-announced price increases, but not price decreases in the Airline Tariff Publishing Co. case (e.g., Borenstein 2004) and the Ethyl case (e.g., Hay 1999). This pattern is
7
For the controversies surrounding the gasoline price cycles in Australia and Canada, see the 2001 Australian Competition and Consumer Commission (ACCC) report and the 1998 Report of the Liberal Committee on Gasoline Pricing in Canada.
3
consistent with the thesis of this paper: Communication is needed to resolve the war of attrition problem that only exists when firms increase prices. The rest of the paper is organized as follows. Section 2 discusses the MT price cycle equilibrium. Section 3 provides the background to the case and describes the price and communication data set. Section 4 shows the pricing dynamics and section 5 presents the communication patterns and elaborates the roles of communication. Section 6 concludes.
2.
Theory Because the pricing and communication behavior of the retail gasoline cartel is in
many ways captured by the MT price cycle equilibrium, we briefly discuss the MT dynamic oligopoly model here. Since we do not attempt to carry out a comprehensive test of this model, we do not discuss the model in details. We emphasize that the war of attrition problem embedded in the price cycle equilibrium may generate the need for facilitating practices within the cycle equilibrium.
6
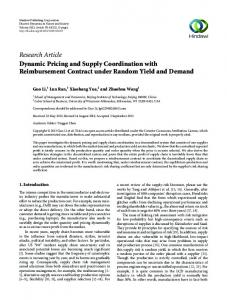
Figure 1: Maskin and Tirole (1988) Price Cycle Firm 2 price
0
1
2
3
4
5
Firm 1 price
1
3
5
7
9
11
13
15
17
19
21
23
25
27
Time
In the basic MT model, two identical firms produce a homogeneous product and engage in price competition for an infinite number of periods in a market with constant marginal cost and demand.8 Different from the standard supergame framework, firms set their prices alternatingly and play Markov reaction strategies. Figure 1 shows a numerical 8
Noel (2006) finds the cycle equilibrium still exists if the product is weakly differentiated.
4
example of the MT price cycle, where marginal cost is zero and market demand is D( p ) = 6 − p .9 In this equilibrium, two firms undercut each other gradually until the price
of one firm reaches marginal cost, at which point the two firms fight a war of attrition: Both firms would like price to be hiked, but neither would like to be the first to do so. MT assumes the two firms resolve the war of attrition problem tacitly by playing mixed strategies: Given the other firm’s price is at the competitive level, a firm’s best response is to attach positive probabilities to both relenting (hiking price) and fighting (keeping price at the competitive level). Once one firm eventually relents, the other firm follows in the next period because of the presence of strategic complementarity. However, in an MT model with three or more firms, mixed strategies lead to failed price-hike attempts. When simulating an MT model with three firms, Noel (2006) finds “‘delayed’ starts in which following firms do not follow immediately and even ‘false’ starts in which the relenting firm returns to the bottom when others do not follow soon enough.” The intuition for this finding is simple. In an MT model with 3 players, after one firm has hiked price, the two remaining firms both wish to follow, but each still has the incentive to be the last to hike price: The two remaining firms still face a war of attrition problem. Hence, the second firm to move may elect to keep its price at the cycle bottom, and the third firm to move is then not bound to hike price either. Consequently, the first firm may retract its price hike, leading to a failed price-hike attempt. It is not until two firms happen to hike their prices consecutively (with no firm withdrawing its price hike in between) that the force of strategic complementarity assures the success of a price hike attempt. The above logic suggests that as the number of firm becomes large the probability of all but one increasing prices consecutively becomes very small; thus the probability that a 9
This example is due to MT. Firms must charge one of seven integer prices (0, 1, 2, 3, 4, 5 or 6).
5
price-hike attempt is successful becomes very small as well. Therefore, this model provides firms with the incentive to coordinate price-hikes through facilitating practices other than mixed strategies within the cycle equilibrium. Facilitating practices include both tacit forms, such as price leadership, and explicit forms, such as direct communication. As mentioned in the introduction, recent literature has studied the regular gasoline price cycles observed in many Canadian and Australian cities. A common finding of this literature is that gasoline stations of major brands tend to hike price first, suggesting the presence of price leadership in these gasoline markets. In this paper, we also study gasoline pricing dynamics and document the use of price leadership. Different from the existing literature, however, our focus is on the timing of communication and the role of communication in coordinating price hikes.
3.
Background and Data
The price-fixing case is focused on the 18-month period between June 1999 and December 2000. Table 1 provides the basic information of the firms in the Ballarat market during this period. In this market, 12 gasoline firms operated or controlled about 50 retail sites. Seven of these firms are respondents to the price-fixing case. Four of the respondent firms (Leahy, Balgee, Chisholm, and Justco) admitted they initiated phone calls to coordinate price increases,10 and the other three respondents (Apco, Brumar, and Triton) contested the price-fixing claims against them. The case is thus about whether the three contesting firms were parties to the price-fixing cartel. The four admitting or initiating firms controlled the retail prices of about 33 sites in the market. Through firm-operated or consignment sites, Leahy, Balgee, and Chisholm sold BP, Mobil, and Ampol/Caltex branded gasoline, respectively, and Justco sold gasoline under 10
Balgee did not admit, but it did not contest the claims against it.
6
the independent brand, Swift. The three contesting firms controlled 12 gasoline sites. Apco was an aggressive independent price discounter11 and had two sites in this market. Brumar was a large Shell multi-site franchisee, and operated five sites in this market. As a large Shell wholesale distributor, Triton did not retail gasoline directly in the market, but supplied Shell branded gasoline to five independent retail sites. The Australian Competition and Consumer Commission (ACCC) alleged and the Court concluded that Triton effectively determined the retail prices of those sites through a price-support system (discussed in section 5). Table 1: Basic Information of the Firms in the Ballarat Gasoline Market Gasoline No. of High or Low Respondent Admitted to No. Firm Name Brand Sites Volume Sites? to the Case? Fixing Price? 1 Leahy 15 Both Y Y BP 2 Balgee 8 Both Y Y Mobil 3 Chisholm 5 Low Y Y Ampol/Caltex 4 Justo Swift 4-5 High Y Y 5 Brumar 5 High Y N Shell 6 Triton 5 Low Y N Shell 7 Apco Apco 2 High Y N 8 United United 1 High N 9 Road Pantry Ampol/Caltex 2 High N 10 Safeway Safeway 1 High N 11 Alien Alien 1 Low N 12 Liberty Liberty 1 Low N Notes: Brands in bold indicate major oil brands, the remaining are “independent”. According to the Australia Competition and Consumer Commission, Leahy controlled between 18 and 25 sites during the relevant period, but Leahy claimed it only controlled between 6 and 15 sites (Federal Court of Australia 265, ¶13, ¶75). Chisholm controlled about 17 sites in the greater Ballarat area, but only the 5 sites within the city of Ballarat were thought to be involved in price-fixing (Federal Court of Australia 265, ¶11, ¶64). The number of retail sites for the other firms is found at ¶13, ¶33 ¶107, ¶166, ¶168 and ¶257 of Federal Court of Australia 1678, at ¶10, ¶11, ¶13, ¶16 and ¶ 75 of Federal Court of Australia 265, and the testimonies of various individuals.
The other five firms in the market operated six retail sites, and are not respondents to the case. United Petroleum (United), a large independent gasoline firm, opened a site in this market in March 1999, just before the start of the period in question. As a result of United’s entry, “price competition increased.… This happened because United … aggressively
11
It operated 14 retail sites in the Australian state of Victoria.
7
challenged Apco’s position as the discount leader.”12 Safeway, a major supermarket chain, started to operate a gasoline site in Ballarat in early 2000. The Safeway site attracted large volumes of business because it offered a 6-cent per liter discount to those drivers who purchased a certain amount of grocery. Road Pantry, a Caltex franchisee, operated two sites in Ballarat. Alien and Liberty each operated one site. We will see in section 5 that the admitting firms initiated price increase phone calls to United, Road Pantry, and Alien; but, for reasons that are not in evidence, ACCC did not proceed against these firms. All parties to the case agreed that gasoline is a highly price sensitive product in this market. The Court stated that the drivers in this market were “so highly price sensitive that even a difference in price of less than one cent per liter (“cpl”) could significantly influence the volume of gasoline sold at a particular outlet.”13 Without quantity data, we are not able to independently quantify the level of price sensitivity in this market. However, Wang (2007) estimates the station level gasoline demand for eight sites in another Australian city with price cycles and finds that own price elasticities range from -5 to -20. Also important to our analysis, parties to the case classified the retail sites into two types: high visibility high volume sites, and low visibility low volume ones. The Court noted that the price movement of the high visibility sites has a particularly significant impact on the volume of gasoline sold at other sites, and the low visibility sites tend to follow the price movement of the high visibility sites. All the sites of Justco, Brumar, Apco, United, Safeway, and Road Pantry are high-volume ones, and all the sites of Chisholm, Triton, Alien, and Liberty are low-volume ones.
12 13
Federal Court of Australia 1678, ¶33. Federal Court of Australia 1678, ¶6.
8
3.1
Price and Communication Data
Because the focus of the price-fixing case is on price increases, the price data collected by ACCC covers mostly the many occasions of price increases.14 For the 90-day period between February 1 and April 30, 2000, ACCC collected all the positive price changes made by a sample of 9 retail sites, as well as the exact time and caller identity of every phone call among the 7 respondent firms and 3 non-respondent firms (United, Road Pantry, and Alien). In this market, communication takes the form of phone calls. Face-to-face meetings are rare, held mainly to discuss the impact of and reactions to the entry of United and Safeway. The 9 sample sites include the two Apco sites, a representative site for each of the other six respondent firms (Leahy, Balgee, Chisholm, Justco, Brumar, and Triton), and the United site. A site is representative of a firm’s pricing behavior because of unison pricing within each firm.15 On 16 of the 90 days, three or more stations significantly increased their prices. These 16 days are identified by ACCC and the trial Court as the price-increase days. A remarkable strength of the price data is that the exact hour and minute of most price increases are observed. However, negative price changes are only available on the priceincrease days, and only for the two Apco sites and the United site. ACCC also collected positive price changes by the 9 sample sites on 53 additional days identified as price-increase days during the rest of the sample period: June 22, 1999, to 14
The price and communication data is contained in two documents: Exhibit DA-13 and Annexure A. ACCC compiled these two documents from various price records, including hand-written day books, printed reports of electronic day books, cash register printouts and diaries recording price changes. Affidavit of David Ablett affirmed September 1, 2003, ¶25. This paper uses the amended versions of Exhibit DA-13 and Annexure A. The amended version of DA-13 is Exhibit NMA-6 to the affidavit of Natalie Maree Atrill sworn April 14, 2004. Further Amended Annexure A to the Statement of Claim is Exhibit NMA-5 to the affidavit of Natalie Maree Attrill sworn April 14, 2004. 15 Testimonies of various individuals suggest within-firm unison pricing. For example, a Balgee manager testified that he “had set retail prices at Balgee’s sites in unison.” Witness Statement of Robert Andrew Levick, ¶15. The price data also shows that the two Apco sites acted in unison: if Apco chose to hike price, the timing of price hikes by the two Apco sites is highly synchronized, typically only a few minutes apart, and these two sites almost always hiked to the same price level.
9
January 31, 2000, and May 1 to December 8, 2000.16 For these two periods, price changes on those days deemed by ACCC as non-price-increase days are typically not available. The only exceptions are price increases by the sample sites on the days immediately before or after one of the 53 price-increase days. Price increases on these days are recorded because they are likely associated with the price-increase days.
4.
Pricing Behavior
During the 18-month sample period, the retail price (for regular unleaded gasoline) in this market “was characterized by gradual decreases in price followed by a sudden and significant increase.”17 These descriptions of the pricing behavior are reminiscent of an MT price cycle. In this section, we quantify the “suddenness” and “significance” of the price-hike process. Figure 2 shows the available price changes (in Australian cents per liter) by two representative sample sites (the Balgee site and the Apco site at Skipton Street) during three price-increase days.18 It is clear that the price-increase processes in the Ballarat market evidently resemble those of an MT price cycle shown in figure 1. Because the data set only records a limited number of price decreases, we cannot show the entire price-decrease process. However, the descriptions by the Court and the various witnesses who testified in the case, together with the available price decrease data, offer an unambiguous picture of the price-decrease process.
16
There are missing observations on these 53 price-increase days. For a typical instance of a missing observation, a statement such as “United Howitt St No Record” was recorded. Price records are always available for three sample sites (Balgee, Brumar, and Leahy), and almost always available for three additional sites (the Chisholm site, the Apco Main Road site, and the Triton site). Price records are not available for the Justco site until the price-hike attempt on December 15, 1999. No record is available for the United site over 27 attempts. 17 Federal Court of Australia 1678, ¶29. 18 The horizontal axis of figure 2 is the hour at which price changes took place. Because the price increases always took place during the day, between 7 am and 6 pm, each 12 hour period in the figure constitutes a ‘day’.
10
80
82
84
86
Figure 2: Price Changes by Two Sites on Three Price-Increase Days
78
Balgee
0
12
24
36
48
60
Apco Skipton St
72
84
96
108
120
132
144
Hour
Size of Price Increases and Decreases In the MT price cycle equilibrium, the size of the price hike is much larger than that of the price decreases. Here we show that this feature holds in the Ballarat data. On the 69 price-increase days, there are 425 price increases for which the precise size is recorded.19 The average size of these price increases is 6.9 cents per liter, and only 6 of the 425 price increases are less than 3 cents per liter.20 The price data also contain 195 negative price changes made by the Apco and United sites. In sharp contrast with the price increases, 104 of the 195 negative price changes are exactly 0.2 cents. Although price decrease data is not available for other firms, it is clear from witness testimonies that the typical size of a price decrease is indeed 0.2 cents per liter (cpl). For example, the individual who set retail price for Chisholm described the price cutting process in the following words: “one or two [discounters’] sites in the region usually reduced their board prices by around 0.2 cpl, … [Chisholm and other firms] generally matched the board price reductions of price discounters … The price discounting would continue with price discounters again reducing their board prices by around 0.2 cpl …
19
For 16 cases, only a statement as “[Chisholm] Rowan View increases to 79.9” is recorded in the data. It is also interesting to note that it is almost always the case that a sample site only hiked its price once during a price-increase day. For a very few exceptions (8 instances in total), a site had two recorded price-hikes on a single price-increase day. In those cases, the second hike took place because the first hike was withdrawn. 20
11
[Chisholm and other firms] again matched these reductions …”21 Compared with the typical size of 0.2 cents of a price decrease, the price increases are indeed “significant.” When did firms attempt to hike price? Testimonies by market participants indicate price increases occurred when the price-cost margin became too low because of gradual undercutting. The individual who set retail price for Chisholm testified, “when board prices were below my usual buying price the margin on retail sales was reduced to only 2 cpl … I did not consider this to be a sustainable margin in the long term and thus preferred to have board prices [hiked].”22 Similarly, the individual who acted on behalf of Balgee testified that “[Balgee] made decisions to increase prices when Balgee’s gross margin on fuel was lower than acceptable.”23 No evidence exists in this case that indicates that the timing of retail price increases is linked with wholesale price increases. None of the parties to the case, including the contesting firms, contended that wholesale price increases caused retail price increases.
Uncommitted Price Followership and Failed Attempts A key feature of the pricing dynamics is that “on many of the price-increase days the price increase did not take effect as it was not matched during the day by all of the main competitors.”24 Here we estimate how frequently an individual firm did not match the lead price-hike and how many of the price-hike attempts failed. As argued in the theory section, the existence of failed price-hike attempts is consistent with the MT price cycle theory. What constitutes a price-hike attempt? A price-hike attempt must be credible and have a chance to achieve the strategic benefit of higher prices for all. Considering the facts of this case and aiming to arrive at a conservative estimate of the number of attempts, a price-
21
Witness Statement of Brendan John Zala, ¶37. Witness Statement of Brendan John Zala, ¶77. 23 Witness Statement of Robert Andrew Levick, ¶67. 24 Federal Court of Australia 1678, ¶290. 22
12
hike attempt is said to have occurred if one or more sample sites hiked price and a significant number of phone calls were made among the firms on the same day. By this standard, 68 of the 69 price-increase days identified by ACCC represent a distinctive price-hike attempt.25 Table 2 presents the estimated probability with which each sample site hiked price over the 68 price-hike attempts. It can be seen that while Leahy and Balgee always hiked their prices, some of the sample sites, especially Apco and United, often chose not to follow the lead price hike. Table 2: Estimated Probability of Hiking Price by Each Sample Site Apco Apco Sample Site Leahy Balgee Chisholm Justco Brumar Triton Skipton Main United Price record available 68 68 67 46 68 66 67 67 41 Price hike numbers 68 68 39 35 63 48 40 39 25 Price-hike probability 1 1 0.58 0.76 0.93 0.73 0.60 0.58 0.61 Note: Apco Skipton and Apco Main refer to the Apco sites at Skipton Street and Main Road, respectively.
A market participant can easily recognize whether an attempt was successful. A researcher would also be able to do so if all price changes, both positive and negative, were available, for the price collapses that indicate the failure of an attempt are very different from the gradual decreases that characterize the cycle falling phase. Because only a limited number of negative price decreases are available, we identify whether or not an attempt failed by utilizing the Court’s observation: “The price increase would not ‘stick’ unless all of the high visibility sites in the Ballarat market increased their retail prices to match the increase of the initiating respondents. If that did not occur within a relatively short period the price increase would collapse and the prices at the various retail outlets controlled by the initiating respondents, and any other respondents that had increased their prices, would return to the discounted levels they were at before the increase.” (Federal Court of Australia 1678, ¶25)
25
No credible price-hike attempt took place on a date other than the 69 price-increase days. The only priceincrease day that does not represent a price-hike attempt is the date of March 8, 2006. On this date, Apco and Untied changed their prices back and forth several times while other sample sites kept their prices unchanged.
13
At least one high-volume sample site (the sites of Apco, United, Brumar, or Justco) did not hike price over 34 of the 68 attempts, suggesting a failure rate of 50% . This is a rather high failure rate, given that the price-hikes were coordinated. Even if we count as failure only those attempts for which 2 or more high-volume sample sites did not match, we still have 26 failed attempts, implying a failure rate of 38.2% .26
Sequence and Duration of price-increase and -decrease processes In the MT price cycle theory, firms set prices sequentially, and the duration of the price-increase process is much smaller than that of the price-decrease process. Here we examine if these properties hold in the data. We limit attention to those 34 price-hike attempts for which all of the high-volume sites followed the lead price hike. Since the data record the exact hour and minute of price increases, we observe the precise timing by which the firms increased their prices.27 The evidence strongly suggests that the firms increased their prices sequentially. The Leahy site was the first to hike price on 25 of the 34 priceincrease days, and the sites of Balgee, Brumar, Triton, and Justco typically followed with median time lags of 1 hour and 17 minutes, 2 hours 4 minutes, 3 hours 7 minutes, and 4 hours 39 minutes, respectively. The two Apco sites were usually the last to hike price, with a median time lag of 5 hours 4 minutes. Note that these estimated median time lags are consistent with the estimated probabilities with which they follow the lead price-hike. Those sites (Leahy and Balgee) with a shorter time lag are the ones that always hiked prices, and
26
How much can we trust these estimates? The accuracy of the estimate relies on the accuracy of the price data collected by ACCC. On one hand, note that the price data went through the aggressive scrutiny of the parties to the case, and were consequently amended and further amended. On the other hand, note that the price data do not cover the two Road Pantry sites or the Safeway site, and the price records for two key sample sites (Justco and United) are not available for a considerable number of attempts. If some of these sites did not hike price on any of the 34 attempts that are deemed successful here, the estimated failure rate would be even higher. 27 The precise timing of the United site and the Chisholm site is largely unavailable.
14
those with longer time lags, especially the Apco sites, are the ones that often chose not to follow. The median duration of the 34 price-increase processes is 5 hours 20 minutes, thus confirming the Court’s observation that “prices increase rapidly in a short period of time.” In contrast, the median number of days between two successful price-increase attempts is 10 days. Therefore, consistent with the MT cycle theory, the price-decrease process is much longer than the price-increase process.
5.
Communication
5.1
Communication Patterns
Notification and follow-up calls were used by the admitting firms to coordinate the sudden and significant price hikes. Notification calls inform competitors of the price increase and follow-up calls are made to those firms that have not matched the lead price-hike shortly after the notification calls. We summarize the communication patterns from two aspects: the timing pattern and the cross-firm pattern. The war of attrition problem embedded in the MT cycle equilibrium suggests that the need for communication exists when firms attempt to increase their prices, but not when they are undercutting each other. Table 3 reports the number of sample sites that increased price and the number of bilateral phone calls among the firms on each of the 90 days from February 1 through April 30, 2000. The timing of communication is indeed highly correlated with the timing of price increases. On each of the 16 price-increase days, a large number of bilateral phone calls were made by the players: the average is 36.8 calls per day, and the minimum is 21. On the 74 non-price-increase days, however, only an average of 3.9 bilateral calls per day was made.
15
The strong correlation between the timing of price increases and communication supports the inference that the bilateral calls on the price-increase days were related to the price increases. This inference is corroborated by the four initiating firms’ admission that they made many phone calls on price-increase days, but made few if any phone calls on the other days. Several cross-firm patterns of bilateral communication can be observed in Table 4, which displays the total number of phone calls, by caller and receiver, on the 16 priceincrease days. A cell in this table records the total number of calls made by the row firm to the column firm. First, 509 (86%) out of the 589 bilateral phone calls on the 16 priceincrease days were initiated by the four firms that admitted to the price-fixing charge:28 Chisholm (236), Balgee (149), Leahy (65), and Justco (59). Second, there were no direct phone calls between the six non-admitting firms except for those between Triton and Brumar, both under the Shell brand. Third, the calls to the non-admitting firms (other than Triton) on the price-increase days are highly concentrated: 44 out of the 47 calls to Apco were from Leahy; the 26 calls to Brumar were all from Triton; the 18 calls to United were all from Justco; 61 out of the 62 calls to Road Pantry were from Chisholm. The cross-firm call patterns reflect the fact that the four initiating firms contacted the other firms through specific points of contact. The communication network is shown in figure 3. Leahy and, to a much lesser degree, Justco were the points of contact for Apco. Chisholm was the contact for Road Pantry, and Justco was the main contact for United. Three initiating firms contacted Triton, which served as the conduit to Brumar.
28
The phone record shows that Apco and Brumar initiated calls, but the Court concluded that those calls were initiated for purposes unrelated to price coordination.
16
Table 3: Daily Number of Retail Sites That Increased Price and Number of Bilateral Phone Calls February 1, 2000, to April 30, 2000 No. of sites Average size of No. of No. of sites Average size of No. of Date increased price price increases calls Date increased prices price increases calls 2/1 0 3 3/17 0 20 2/2 0 4 3/18 0 2 2/3 0 9 3/19 0 0 2/4 * 9 3.62 27 3/20 1 0.60 0 2/5 0 0 3/21 0 1 2/6 0 1 3/22 0 0 2/7 0 2 3/23 0 2 2/8 0 1 3/24 0 6 2/9 * 9 4.36 39 3/25 0 4 2/10 0 6 3/26 0 0 2/11 0 12 3/27 * 7 3.73 32 2/12 0 0 3/28 2 3.80 3 2/13 0 0 3/29 0 1 2/14 0 1 3/30 0 1 2/15 0 3 3/31 0 13 2/16 0 8 4/1 0 0 2/17 * 4 7.90 40 4/2 0 0 2/18 0 11 4/3 0 9 2/19 0 0 4/4 * 4 5.75 50 2/20 0 0 4/5 0 13 2/21 * 8 8.93 34 4/6 * 4 5.03 31 2/22 0 2 4/7 0 9 2/23 0 2 4/8 0 0 2/24 0 10 4/9 0 0 2/25 1 0.90 21 4/10 * 7 7.06 44 2/26 0 0 4/11 1 6.60 1 2/27 0 0 4/12 0 4 2/28 * 8 4.17 46 4/13 0 5 2/29 0 6 4/14 0 10 3/1 0 2 4/15 0 1 3/2 1 1.60 6 4/16 0 0 3/3 1 4.00 15 4/17 0 1 3/4 0 0 4/18 0 19 3/5 0 0 4/19 * 4 10.15 28 3/6 * 8 8.85 42 4/20 * 8 8.15 21 3/7 1 5.60 11 4/21 1 3.00 1 3/8 * 3 6.71 57 4/22 0 0 3/9 0 7 4/23 0 0 3/10 * 8 5.97 49 4/24 0 0 3/11 0 8 4/25 0 0 3/12 0 0 4/26 0 1 3/13 1 2.20 1 4/27 0 4 3/14 1 5.20 4 4/28 * 4 9.05 22 3/15 2 2.85 4 4/29 1 6.00 0 3/16 * 8 5.90 27 4/30 1 1.80 0 Note: Dates marked by “*” are identified by the ACCC as price-increase days. Price unit is Australian cents per liter.
17
Table 4: Number of Bilateral Phone Calls on the 16 Price-increase Days Firm Leahy Chisholm Balgee Justco Triton Brumar Apco United Road Pantry Alien Total Received
Leahy 1 54
Chisholm Balgee 5 16 89 71 24 5 9 5
11
Justco 66 16 3 7
Triton Brumar Apco 44 18 8 2 3 26 11
Road Pantry
Alien
61
1
18
1
6
18
62
7
United
1 7
66
109
116
99
39
26
47
Total Made 65 236 149 59 43 18 12 7 0 0 589
Note: The row player is the firm that initiated the call. The first four firms are the admitting firms.
Figure 3: Communication Network
Notes: Firms in shaded boxes are the admitting (initiating) firms. Arrows point to the recipient. The line width is proportional to the number of calls. The calls initiated by Apco and Brumar are ignored in this diagram because those calls were found by the Court to be initiated for purposes unrelated to price increases. Also ignored are the single call from Chisholm to Alien and the single call from Justco to Road Pantry for their lack of significance.
The evidence in the case suggests that the communication channels are related to the business and social relationships among the firms. Chisholm and Road Pantry are both under the Ampol/Caltex brand, and Triton and Brumar are both under the Shell brand. Apco took calls from Justco and Leahy because Apco had normal commercial transactions with those 18
two firms and because the director of Apco and the individuals acting on behalf of Justco and Leahy were either family friends or had known each other for many years.29
5.2
The Role of Communication
Why is communication needed to coordinate the price increases in this market? Price increases by all would benefit all; even the contesting firms agree that they would like the market price to be hiked. However, a price leader is worse off than a price follower. That is, as in the MT cycle theory, the firms face a war of attrition problem when they attempt to hike prices. Notification and follow-up calls play specific roles in coordinating price increases and improving the likelihood that a price-hike attempt would succeed. While notification calls between the initiating firms may have served as advance notice of future price increases, calls to other firms were often made after some sites had hiked their prices, sometimes in such words as “The market has moved” or “Go for a drive.” The Court concluded that Apco “was usually called when the increase had been made by one or other of the initiating respondents and has been matched or was in the process of being matched by other respondents.”30 Why did the initiators make notification calls? It is noted by ACCC and the Court that such calls shorten the time lag with which competitors are made aware of the price-hike attempt, thus potentially lessening the volume loss incurred by the initiators.31 The question then is why some firms may not observe a price increase quickly enough in the absence of notification calls. After all, gasoline price is posted on large boards for all to see.
29
Federal Court of Australia 1678, ¶149, ¶158. Federal Court of Australia 1678, ¶170. 31 For example, ACCC reasoned that “if word of an increase did not get to all competitors quickly, the first to rise would lose market share rapidly, and no-one would get the benefit of a non-competitive price.” Federal Court of Australia 1678, ¶76. 30
19
The key appears to be the internal structure of the firms. Consider Apco and Triton, two of the contesting firms, for which we have more information. The director of Apco set the retail price for its two sites in Ballarat, and relied on its franchisees to check competitors’ price (for the director was located in another city). The director agreed in cross-examination that “if [he] waited for the franchisees to do their next routine price check the increase may come and go and not stick.”32 The director also conceded that the phone calls “helped him to know precisely when to tell his franchisees to check [competitors’] prices… to confirm that his franchisees were providing him with price-increase information in a timely and accurate fashion.”33 Thus, the notification calls helped Apco monitor its franchisees and made Apco aware of the price-hike attempt more quickly. In the case of Triton, the site operators actually have the incentive not to report or increase price. Triton, a wholesale distributor that supplied Shell-branded gasoline to independent retail sites, exercised control over those sites’ retail price through a form of vertical restraint called the price support system.34 Suppose the Shell branded sites have the contractual obligation to pay Triton a wholesale price of 85 cents per liter over a period, but the prevailing retail price in the market is often below 85 cents. Because of this special arrangement, the retailers have to rely on the price support provided by Triton to survive. By changing the size of the price support, Triton was able to exert great, though not complete control over the retail price.35 When the price at some sites is hiked, those Shell sites gain market share while selling at a positive margin because of the price support, thus having no 32
Federal Court of Australia 1678, ¶153. Federal Court of Australia Full Court 161, ¶25. 34 Details of the price support system can be found at Federal Court of Australia 1678, ¶13 through ¶21. 35 It was Triton’s practice to provide a guaranteed 3 cents per liter margin to retailers. For example, if the prevailing retail price is 80 cents per liter, Triton would provide a price support of 3 cents per liter, thus lowering the effective wholesale price to 77 cents per liter. Although a retailer is entitled to set a price different from 80 cents per liter, it has little incentive to do so: a higher retail price loses market share while a smaller price squeezes the margin. 33
20
incentive to increase price. To hike the retail price at those sites, Triton had to make calls to those sites to reduce the price support. Therefore, it is important for the initiating firms to inform Triton of a price-hike attempt as quickly as possible. Follow-up calls appear to serve at least two functions. First, it allows the initiating firms to verify whether the firms that had not matched intend to match. For example, individuals who acted on behalf of Chisholm and Balgee testified that, after they made follow-up calls to Triton with regard to the Brumar sites, Triton would call them back and said Brumar was “on the way” or “wasn’t going to do anything.”36 Such information presumably helps the initiating firms with their decision of whether to hold or withdraw their already hiked price. Second, follow-up calls allow the initiating firms to serve as a facilitator among those firms that strived to be the last to increase price. For example, under cross examination, the director of Apco said that: “Not everybody was up in the market when they rang me the first time. United mightn’t have been up. So I’ve said, ‘Give me another ring in an hour, two hours. Check United again, give me a ring.’”37 Since these firms did not communicate with each other, the initiating firms sometimes acted as the facilitator and coordinated through follow-up calls. For example, in one round of follow-up calls, three initiating firms (Leahy, Balgee and Chisholm) were involved to mediate the war of attrition between Apco and Road Pantry. After learning Apco’s position that it would not hike its price until Road Pantry had done so, Leahy called Balgee, who then called Chisholm, who then relayed the information to Road Pantry. After learning that Road Pantry “was going to move [in] the next half-hour or move
36 37
Federal Court of Australia 1678, ¶214, ¶216. Federal Court of Australia 1678, ¶153.
21
at the next change of shift,” Chisholm passed this information back to Balgee, who then relayed it back to Leahy. The information that Road Pantry would match soon likely helped Apco with the timing of its price increase. This information also offered the initiating firms the incentive not to withdraw their hiked price immediately. The phone calls did not guarantee the success of the price-hike attempt, but do appear to have improved the chance that the price-hike attempt would succeed. It is interesting to recall from section 4 that a large portion of the price-hike attempts failed because one or more of the key firms decided not to follow the lead price-hike. Apco is one of the key firms that decided not to hike its price on many occasions even after receiving notification and follow-up calls. That is, Apco was not committed to increasing prices after receiving phone calls, even though (1) the calls helped Apco monitor the price increases in the Ballarat market and determine whether to follow, and (2) Apco was aware that the purpose of the calls was to persuade or encourage Apco to follow the lead price-hike. On the grounds that it was not committed to any price increase, Apco appealed the trial Court’s finding that it was a party to the price-fixing understanding.38 The Federal Court of Australia Full Court sided with Apco and concluded that, because of Apco’s lack of commitment, Apco “was not a party to any understanding that it would fix its prices….”39 The MT cycle theory does not predict the use of communication, but the war of attrition problem embedded in the cycle equilibrium generates the need for coordination and captures the timing of the documented communication. Note that the behavior of Apco and other firms that strived to be the last to increase price can be described literally as wars of attrition. 38
Apco is the only firm that appealed the case. This raises the legal question of what constitutes participation in a cartel, which is interesting but beyond the scope of this paper. 39 Federal Court of Australia Full Court 161, ¶44.
22
As in the Sugar Institute, the communication observed in this market facilitated collusion.40 A literature argues that communication may hinder collusion because such communication may allow firms to renegotiate out of punishments.41 The collusive agreement in this gasoline market is not based on punishment strategies. If the follower firms chose not to match, the initiating firms did not use prolonged price wars to punish the follower firms. Instead, the initiating firms simply retracted their increases and then coordinated, through communication, another price-hike attempt a few days later. This behavior of the initiating firms is captured by Tirole’s (1988, p.256) interpretation of the MT model: “if firms were stuck in the competitive price region, with the prospects of small profits in the future, a firm could raise its price dramatically, and lure its rival to charge a high price for at least some time.” Strategic complementarity is the lure, but this lure alone is not strong enough in this market – thus the need for communication.
6.
Conclusion
This paper uses the unique trial record to study the collusive communication and pricing behavior in an Australian retail gasoline market. The phone calls that took place in this market were used by the price leaders to coordinate price increases: notifying other firms of a price-hike attempt, verifying if price-hikes would be followed, and helping end the war of attrition between those firms that strive to be the last to increase price. Communication thus served as a facilitating practice in resolving the war of attrition problem that arises whenever firms increase price sequentially.
40
It appears that communication also helped the lysine cartel to collude. See McCutcheon (1997). Anderson and Wengstrom (2004) present experimental evidence supporting the idea that antitrust laws prohibiting communication may facilitate collusion.
41
23
Both the empirical and narrative evidence suggests that the communication and pricing behavior is well captured by the MT price cycle equilibrium. In particular, the war of attrition problem embedded in the cycle equilibrium captures the need for and the timing of pricing coordination. Because regular price cycles are currently being observed in many gasoline markets, the findings of this paper are of current policy interest. Because the war of attrition problem exists whenever firms increase price sequentially, the findings of this paper may have implications in other industries as well.
References
ACCC. 2001. “Reducing Fuel Price Variability.” Available at www.accc.gov.au. ACCC. Outline of ACCC Final Submissions. In the Federal Court of Australia Victoria District Registry. ACCC v Leahy Petroleum Pty Ltd and Others [2004] Federal Court of Australia 1678, December 17, 2004. ACCC v Leahy Petroleum Pty Ltd and Others [2005] Federal Court of Australia 254, March 17, 2005. ACCC v Leahy Petroleum Pty Ltd and Others (No 3) [2005] Federal Court of Australia 265, March 17, 2005. Anderson, Ola, and Erik Wengstrom. 2004. “Do Antitrust Laws Facilitate Collusion? Experimental Evidence on Costly Communication in Duopolies.” Forthcoming Scandinavian Journal of Economics. Apco Service Stations Pty Ltd v ACCC [2005] Federal Court of Australia Full Court 161, August 17, 2005. Athey, Susan, and Kyle Bagwell. 2001. “Optimal Collusion with Private Information.” RAND Journal of Economics 32(3): 428–465. Atkinson, Benjamin. 2007. “Retail Gasoline Price Cycles: Evidence from Guelph, Ontario Using Bi-Hourly, Station-Specific Retail Price Data.” Mimeo. 24
Borenstein, Severin, “Rapid Price Communication and Coordination: The Airline Tariff Publishing Case,” in John E. Kwoka, Jr., and Lawrence J. White, eds., The Antitrust Revolution: Economics, Competition, and Policy, 4th edn. New York: Oxford University Press, 2004, pp. 233-251. Compte, Olivier. 1998. “Communication in Repeated Games with Imperfect Private Monitoring.” Econometrica 66(3): 597-626. Connor, John M. 2001. Global Price Fixing: Our Customers Are the Enemy. Boston: Kluwer. Cramton, Peter C, and Thomas R. Palfrey. 1990. “Cartel Enforcement with Cost Uncertainty.” International Economic Review 31(1): 17-47. Eckert, Andrew. 2003. “Retail Price Cycles and the Presence of Small Firms.” International Journal of Industrial Organization 21: 151-170. Eckert, Andrew, and Douglas West. 2004. “Retail Gasoline Price Cycles across Spatially Dispersed Gasoline Stations.” Journal of Law and Economics 47: 245-71. Genesove, David, and Wallace P. Mullin. 2001. “Rules, Communication, and Collusion: Narrative Evidence from the Sugar Institute Case.” American Economic Review 91 (3): 379-98. Graham, Daniel A. and Robert C. Marshall. 1987. “Collusive Bidder Behavior at SingleObject Second-Price and English Auctions.” Journal of Political Economy 95(6): 1217-1239. Green, Edward J. and Robert H. Porter. “Non-cooperative Collusion under Imperfect Price Information.” Econometrica 52: 87-100. Harrington, Joseph E., Jr. “How Do Cartels Operate?” Foundations and Trends in Microeconomics 2(1): 1-105. Hay, George A., "Practices That Facilitate Cooperation: The Ethyl Case," in John E. Kwoka, Jr., and Lawrence J. White, eds., The Antitrust Revolution: Economics, Competition, and Policy, 3rd edn. New York: Oxford University Press, 1999, pp. 182-201. Kandori, Michihiro and Hitoshi Matsushima. 1998. “Private Observation, Communication and Collusion.” Econometrica 66(3): 627-652. Levenstein, Margaret C. and Valerie Y. Suslow. 2005. “What Determines Cartel Success?” Journal of Economic Literature 44(1): 43-95. McAfee, R. Preston and John McMillan. 1992. “Bidding Rings.” American Economic Review 82(3): 579-599.
25
McCutcheon, Barbara. 1997. “Do Meetings in Smoke-Filled Rooms Facilitate Collusion?” Journal of Political Economy 105(2): 330-350. Maskin Eric and Jean Tirole. 1988. “A Theory of Dynamic Oligopoly, II: Price Competition, Kinked Demand Curves and Edgeworth Cycles.” Econometrica 56(3): 571-599. Noel, Michael. 2006. “Edgeworth Price Cycles and Focal Prices: Computational Dynamic Markov Equilibria.” UCSD mimeo. Noel, Michael. 2007a. “Edgeworth Price Cycles: Evidence from the Toronto Retail Gasoline Market.” Journal of Industrial Economics 55(1): 69-92. Noel, Michael. 2007b. “Edgeworth Price Cycles, Cost-based Pricing and Sticky Pricing in Retail Gasoline Markets.” Review of Economics and Statistics 89(2): 324-334. Porter, Robert H. 2005. “Detecting Collusion.” Review of Industrial Organization 26: 147167. Stigler, George J. 1964. “A Theory of Oligopoly.” Journal of Political Economy 72(1): 44-61. Tirole, Jean. 1988. The Theory of Industrial Organization. Cambridge: MIT Press. Wang, Zhongmin. 2007. “Station Level Gasoline Demand in a Market with Price Cycles.” Northeastern University mimeo.
26