Color and Scale: The Spatial Structure of Color Images Jan-Mark Geusebroek? , Rein van den Boomgaard, Arnold W. M. Smeulders, and Anuj Dev?? Intelligent Sensory Information Systems, Department of Computer Science, University of Amsterdam, Kruislaan 403, 1098 SJ Amsterdam, The Netherlands;
[email protected] accepted by ECCV2000
Abstract. For grey-value images, it is well accepted that the neighborhood rather than the pixel carries the geometrical interpretation. Interestingly the spatial configuration of the neighborhood is the basis for the perception of humans. Common practise in color image processing, is to use the color information without considering the spatial structure. We aim at a physical basis for the local interpretation of color images. We propose a framework for spatial color measurement, based on the Gaussian scale-space theory. We consider a Gaussian color model, which inherently uses the spatial and color information in an integrated model. The framework is well-founded in physics as well as in measurement science. The framework delivers sound and robust spatial color invariant features. The usefulness of the proposed measurement framework is illustrated by edge detection, where edges are discriminated as shadow, highlight, or object boundary. Other applications of the framework include color invariant image retrieval and color constant edge detection.
1
Introduction
There has been a recent revival in the analysis of color in computer vision. This is mainly due to the common knowledge that more visual information leads to easier interpretation of the visual scene. A color image is easier to segment than a grey-valued image since some edges are only visible in the color domain and will not be detected in the grey-valued image. An area of large interest is searching for particular objects in images and image-databases, for which color is a feature with high reach in its data-values and hence high potential for discriminability. Color can thus be seen as an additional cue in image interpretation. Moreover, color can be used to extract object reflectance robust for a change in imaging conditions [4, 6, 17, 18]. Therefore color features are well suited for the description of an object. ? ??
This work is partly sponsored by Janssen Research Foundation, Beerse, Belgium, and by the Dutch ministry of economic affairs (IOP BeeldVerwerking)
Colors are only defined in terms of human observation. Modern analysis of color has started in colorimetry where the spectral content of tri-chromatic stimuli are matched by a human, resulting in the well-known XYZ color matching functions [20]. However, from the pioneering work of Land [16] we know that a perceived color does not directly correspond to the spectral content of the stimulus; there is no one-to-one mapping of spectral content to perceived color. For example, a colorimetry purist will not consider brown to be a color, but as computer vision practisers would like to be able to define brown in an image when searching on colors. Hence, it is not only the spectral energy distribution coding color information, but also the spatial configuration of colors. We aim at a physical basis for the local interpretation of color images. Common image processing sense tells us that the grey-value of a particular pixel is not a meaningful entity. The value 42 by itself tells us little about the meaning of the pixel in its environment. It is the local spatial structure of an image that has a close geometrical interpretation [13]. Yet representing the spatial structure of a color image is an unsolved problem. The theory of scale-space [13, 19] adheres to the fact that observation and scale are intervened; a measurement is performed at a certain resolution. Differentiation is one of the fundamental operations in image processing, and one which is nicely defined [3] in the context of scale-space. In this paper we discuss how to represent color as a scalar field embedded in a scale-space paradigm. As a consequence, the differential geometry framework is extended to the domain of color images. We demonstrate color invariant edge detectors which are robust to shadow and highlight boundaries. The paper is organized as follows. Section 2 considers the embedding of color in the scale-space paradigm. In Sect. 3 we derive estimators for the parameters in the scale-space model, and give optimal values for these parameters. The resulting sensitivity curves are colorimetrical compared with human color vision. Section 4 demonstrates the usefulness of the presented framework in physics based vision.
2
Color and Observation Scale
A spatio-spectral energy distribution is only measurable at a certain spatial resolution and a certain spectral bandwidth. Hence, physical realizable measurements inherently imply integration over spectral and spatial dimensions. The integration reduces the infinitely dimensional Hilbert space of spectra at infinitesimally small spatial neighborhood to a limited amount of measurements. As suggested by Koenderink [14], general aperture functions, or Gaussians and its derivatives, may be used to probe the spatio-spectral energy distribution. We emphasize that no essentially new color model is proposed here, but rather a theory of color measurement. The specific choice of color representation is irrelevant for our purpose. For convenience we first concentrate on the spectral dimension, later on we show the extension to the spatial domain.
2.1
The Spectral Structure of Color
From scale space theory we know how to probe a function at a certain scale; the probe should have a Gaussian shape in order to prevent the creation of extra details into the function when observed at a higher scale (lower resolution) [13]. As suggested by Koenderink [14], we can probe the spectrum with a Gaussian. In this section, we consider the Gaussian as a general probe for the measurement of spatio-spectral differential quotients. Formally, let E(λ) be the energy distribution of the incident light, where λ denotes wavelength, and let G(λ0 ; σλ ) be the Gaussian at spectral scale σλ positioned at λ0 . The spectral energy distribution may be approximated by a Taylor expansion at λ0 , 1 λ0 + ... . E(λ) = E λ0 + λEλλ0 + λ2 Eλλ 2
(1)
Measurement of the spectral energy distribution with a Gaussian aperture yields a weighted integration over the spectrum. The observed energy in the Gaussian color model, at infinitely small spatial resolution, approaches in second order to ˆ σλ (λ) = E ˆ λ0 ,σλ + λE ˆ λ0 ,σλ + 1 λ2 E ˆ λ0 ,σλ + . . . E λ λλ 2
(2)
where ˆ λ0 ,σλ = E
Z
E(λ)G(λ; λ0 , σλ )dλ
measures the spectral intensity, Z λ0 ,σλ ˆ = E(λ)Gλ (λ; λ0 , σλ )dλ Eλ measures the first order spectral derivative, and Z ˆ λ0 ,σλ = E(λ)Gλλ (λ; λ0 , σλ )dλ E λλ
(3)
(4)
(5)
measures the second order spectral derivative. Further, Gλ and Gλλ denote derivatives of the Gaussian with respect to λ. Note that, throughout the paper, we assume scale normalized Gaussian derivatives to probe the spectral energy distribution. Definition 1 (Gaussian Color Model). The Gaussian color model measures ˆ λ0 ,σλ , E ˆ λ0 ,σλ , E ˆ λ0 ,σλ , . . . of the Taylor expansion of the Gausthe coefficients E λ λλ sian weighted spectral energy distribution at λ0 and scale σλ . One might be tempted to consider a higher, larger than two, order structure of the smoothed spectrum. However, the subspace spanned by the human visual system is of dimension 3, and hence higher order spectral structure cannot be observed by the human visual system.
2.2
The Spatial Structure of Color
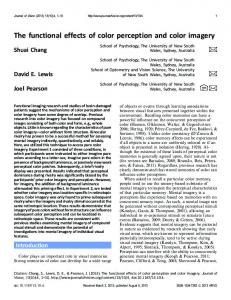
Introduction of spatial extent in the Gaussian color model yields a local Taylor expansion at wavelength λ0 and position x0 . Each measurement of a spatiospectral energy distribution has a spatial as well as spectral resolution. The measurement is obtained by probing an energy density volume in a three-dimensional spatio-spectral space, where the size of the probe is determined by the observation scale σλ and σx , see Fig. 1. It is directly clear that we do not separately consider spatial scale and spectral scale, but actually probe an energy density volume in the 3d spectral-spatial space where the “size” of the volume is specified by the observation scales.
Fig. 1. The probes for spatial color consists of probing the product of the spatial and the spectral space with a Gaussian aperture.
ˆ x) of light We can describe the observed spatial-spectral energy density E(λ, as a Taylor series for which the coefficients are given by the energy convolved with Gaussian derivatives: µ ¶T · µ ¶T · ¸ ¸µ ¶ ˆxx E ˆxλ x ˆx 1 x E E ˆ x) = E ˆ+ x E(λ, + + ... (6) ˆλx E ˆλλ ˆλ λ λ 2 λ E E where ˆxi λj (λ, x) = E(λ, x) ∗ Gxi λj (λ, x; σλ , σx ) . E
(7)
Here, Gxi λj (λ, x; σλ , σx ) are the spatio-spectral probes, or color receptive fields. ˆ x) represent the local image The coefficients of the Taylor expansion of E(λ, structure completely. Truncation of the Taylor expansion results in an approximate representation, optimal in least squares sense. For human vision, it is known that the Taylor expansion is spectrally truncated at second order [10]. Hence, higher order derivatives do not affect color as
observed by the human visual system. Therefore, three receptive field families should be considered; the luminance receptive fields as known from luminance scale-space [15] extended with a yellow-blue receptive field family measuring the first order spectral derivative, and a red-green receptive field family probing the second order spectral derivative. These receptive field families are illustrated in Fig. 2. For human vision, the Taylor expansion for luminance is spatially truncated at fourth order [21].
Fig. 2. A diagrammatic representation of the various color receptive fields, here truncated at second order. The spatial luminance only yields the well-known [15] receptive fields from grey-value scale-space theory (column denoted by 0). For color vision, the luminance family is extended by a yellow-blue family (column 1) measuring the firstorder spectral derivatives, and a red-green family (column 2) measuring the secondorder spectral derivatives.
3
Colorimetric Analysis of the Gaussian Color Model
The eye projects the infinitely dimensional spectral density function onto a 3d ‘color’ space. Not any 3d subspace of the Hilbert space of spectra equals the subspace that nature has chosen. Any subspace we create with an artificial color model should be reasonably close in some metrical sense to the spectral subspace spanned by the human visual system. Formally, the infinitely dimensional spectrum e is projected onto a 3d space c by c = AT e, where AT = (XY Z) represents the color matching matrix. The subspace¡ in which c resides, is defined by the color matching functions A T . The ¢ T range < A defines ¡ ¢ what spectral distributions e can be reached from c, and the nullspace ℵ AT defines which spectra e cannot be observed ¡ in ¢c. Since any spectrum e = e< ¡+ eℵ¢decomposed into a part that resides in < AT and a part that resides in ℵ AT , we define Definition 2. The observable part of the spectrum equals e< = Π< e where Π< is the projection onto the range of the human color matching functions A T .
Definition 3. The non-observable (or metameric black) part of the spectrum equals eℵ = Πℵ e where Πℵ is the projection onto the nullspace of the human color matching functions AT . ¡ ¢ The projection on the range < AT is given by [1] ¡ ¢ ¡ ¢−1 T Π< : AT 7→ < AT = A AT A A
(8)
and the projection on the nullspace ¡ ¢ ¡ ¢−1 T ⊥ Πℵ : AT 7→ ℵ AT = I − A AT A A = Π< .
(9)
Any spectral probe B T that has the same range as AT is said to be colorimetric with AT and hence differs only in an affine transformation. An important property of the range projector Π< is that it uniquely specifies the subspace. Thus, we can rephrase the previous statement into: ¡ ¢ Proposition 4. The human color space is uniquely defined by