Today, we are exposed to color images on a daily basis in print, photographs, television, computer ...... [19] H.R. Kang, Color Technology for Electronic Devices. Bellingham WA: ... Available: http://white.stanford.edu/~brian/scielab/scielab.html.
Copyright 2005 IEEE. Personal use of this material is permitted. However, permission to reprint/republish this material for advertising or promotional purposes or for creating new collective works for resale or redistribution to servers or lists, or to reuse any copyrighted component of this work in other works must be obtained from the IEEE.
FLOWER PHOTO © 1991 21ST CENTURY MEDIA, CAMERA AND BACKGROUND PHOTO: © DIGITAL VISION LTD.
[H. Joel Trussell, Eli Saber, and Michael Vrhel]
Color Image Processing [Basics and Special Issue Overview]
H
umans have always seen the world in color but only recently have we been able to generate vast quantities of color images with such ease. In the last three decades, we have seen a rapid and enormous transition from grayscale images to color ones. Today, we are exposed to color images on a daily basis in print, photographs, television, computer displays, and cinema movies, where color now plays a vital role in the advertising and dissemination of information throughout the world. Color monitors, printers, and copiers now dominate the office and home environments, with color becoming increasingly cheaper and easier to generate and reproduce. Color demands have soared in the marketplace and are projected to do so for years to come. With this rapid progression, color and multispectral properties of images are becoming increasingly crucial to the field of image processing, often extending and/or replacing previously known grayscale techniques. We have seen the birth of color algorithms that range from direct extensions of grayscale ones, where images are treated as three monochrome separations, to more sophisticated approaches that exploit the correlations among the color bands, yielding more accurate results. Hence, it is becoming increasingly necessary for the signal processing community to understand the fundamental differences between color and grayscale imaging. There are more than a few extensions of concepts
IEEE SIGNAL PROCESSING MAGAZINE [14] JANUARY 2005
Authorized licensed use limited to: Rochester Institute of Technology. Downloaded on February 3, 2009 at 14:32 from IEEE Xplore. Restrictions apply.
1053-5888/05/$20.00©2005IEEE
steps required to create a digital image from the analog radiance and perceptions that must be understood in order to produce information of a natural scene. The following article, titled successful research and products in the color world. “Demosaicking: Color Filter Array Interpolation’’ [5], focuses on Over the last three decades, we have seen several important one of the most important steps in a consumer digital camera contributions in the field of color image processing. While there imaging pipeline, where the methods of decoding mosaics of have been many early papers that address various aspects of color pixels to produce high-resolution continuous color images color images, it is only recently that a more complete underare discussed in detail. Having seen an example of an imaging standing of color vision, colorimetry, and color appearance has device, it is natural to discuss the underlying optimization techbeen applied to the design of imaging systems and image proniques that take into consideration all the individual steps in a cessing methodologies. The first contributions in this area were given system in an attempt to maximize its performance. The those that changed the formulation of color signals from simple article titled “System Optimization in Digital Color Imaging’’ [4] algebraic equations to matrix representation [8], [9], [15]. More chooses two examples of color printing and discusses the methpowerful use of the matrix algebraic representation was presentods and results of optimizing them, clearly highlighting the ed in [13], where set theoretic methods were introduced to color total gain achieved by considerprocessing. The first overview ing the system as a whole. extending signal processing conMETAMERISM IS BASICALLY COLOR At this point, the focus of cepts to color was presented in ALIASING AND CAN BE DESCRIBED BY the issue shifts from hardware IEEE Signal Processing MagaGENERALIZING THE WELL-KNOWN and system centric to image zine in 1993 [14]. This was folSHANNON SAMPLING THEOREM processing techniques that lowed by a special issue on color form the backbone of many image processing in IEEE FREQUENTLY ENCOUNTERED IN color systems and applications. Transactions on Image ProCOMMUNICATIONS AND DIGITAL The first of these is discussed in cessing in July 1997, where a SIGNAL PROCESSING. “Detection and Classification of complete review of the state of Edges in Color Images” [6], the art at that time was found in where the emphasis is placed on detecting discontinuities, i.e., [11]. More recently, we have seen the introduction of several transitions from one region to another, instead of similarities in texts that address color image processing [10], [12]. a given image. One of the most fundamental steps in many The articles selected for this special section concentrate, in applications and in the design of image processing techniques is general, on the processing and application of color for input and to ensure that a given image is optimized for noise and output devices. They have been chosen to provide the reader enhanced in quality. This is outlined in the article “Vector with a broad overview of color techniques and usage for hardFiltering for Color Imaging” [7], where the authors discuss and ware devices. However, innovative color applications extend far compare the various techniques outlining their strength, areas beyond the topics covered within this issue. To this effect, color of improvements, and future research directions. Finally, the has been widely utilized and exploited for its properties in many article titled “Digital Color Halftoning” [2] provides a complete applications, including multimedia and video, database indexing review of the methods employed by printers to reproduce color and retrieval, and exchange of information, to name a few. images and the challenges they face in ensuring that these Furthermore, the extension of color concepts to multispectral images are free of visual artifacts. imaging has been shown to provide significant increases in accuracy by recording more than the usual three spectral bands. FUNDAMENTALS OF THE EYE Applications of these special devices have been primarily conIt is assumed that the readers of this issue are familiar with the centrated in the fine arts [17]. basics of the human eye. Recommended texts that describe the To avoid much duplication among the selected articles, we eye in detail include those by Wandell [16] for an overall study have chosen to focus the balance of this article on a brief review of psychovisual phenomena, Barlow and Mollon [21] for physiof the fundamental concepts of color, thereby allowing each of ology, and Wyszecki and Stiles [22] for a brief description of the subsequent articles to concentrate on their particular topic. physiology and its relationship to photometric requirements. This introduction is followed by “Color Image Generation and This article provides a brief overview to set the stage for the Display Technologies’’ [1], where we describe the capabilities upcoming articles. and limitations of the primary hardware systems responsible for Incident light is focused by the cornea and lens to form an creating and displaying color images. In particular, we focus our image of the object being viewed on the retina. The retina, at the attention on the most popular input devices, namely scanners back of the eye, contains the rods and cones that act as sensors and digital cameras, and output devices such as LCD displays for the human imaging system and operate in different ways and and ink jet and laser printers. With digital still cameras becomat various light levels. The rods and cones are distributed ing so common and having outstripped film cameras in total unevenly throughout the retina. The rods are utilized for monorevenue generated, it is appropriate to review their fundamenchromatic vision at low light levels, termed “scotopic vision.” tals herein. This is accomplished by the article “Color Image The cones, on the other hand, are the primary source of color Processing Pipeline’’ [3]. In this article, the authors outline the
IEEE SIGNAL PROCESSING MAGAZINE [15] JANUARY 2005
Authorized licensed use limited to: Rochester Institute of Technology. Downloaded on February 3, 2009 at 14:32 from IEEE Xplore. Restrictions apply.
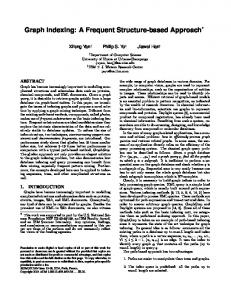
vision in bright light, a condition known as “photopic vision.” Three different types can be found in normal observers. These are called short (S), medium (M), and long (L) due to their enhanced sensitivity to short, medium, and long wavelengths of light. In particular, the S, M, and L cones are most sensitive to blue, green, and yellow-green light, respectively (Figure 1), providing a qualitative basis for representing a digital color image with red, green, and blue (RGB) monochrome images.
Cone Sensitivities 1 0.8
0.6
0.4
0.2 0 400
450
500
550
600
650
700
Wavelength (nm) [FIG1] Cone sensitivities.
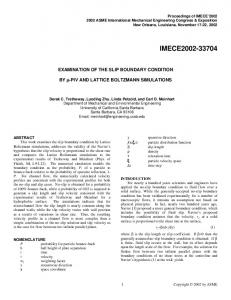
IMAGE FORMATION Before we begin to characterize the spectrum of a pixel, we need to define the physical quantity that we are measuring. For cameras, the quantity of interest is the radiant energy spectrum that is obtained in a solid angle emanating from the pixel on the focal plane. For scanners, the quantity of interest is the spectral reflectance of a pixel-shaped area on the image. The reflectance can be obtained since the radiant energy spectrum of the illumination of the scanner is known. Figure 2 provides an illustration of this process for a digital camera. From a physical point of view, the radiant power emitted by a source is measured in watts. Likewise, the power received by a detector is measured in watts. Since the power is a function of wavelength, the unit should be watts/nanometer. The total power integrated over all wavelengths is called “radiant flux.” We denote radiant flux per nanometer by r(λ). Discussions of radiometry are found in [22]. The details include factors relating to the angles of viewing, angles of reflectance, and the luminance efficiency function of the eye. MATHEMATICAL DEFINITION OF COLOR MATCHING A vector space approach to describing color is useful for expressing and solving complex problems in color imaging. For this reason, we will use this notation to describe the fundamentals of color matching. Let the N × 3 matrix S = [s1 , s2 , s3 ] represent the response of the eye, where the N vectors, s i , correspond to the response of the ith type sensor (cone) (Figure 1). A given visible spectrum can be represented by an N vector, f, a function whose value is radiant energy. Hence, the response of the sensors to the input spectrum is a three vector, c, obtained by c = S Tf.
(1)
Two visible N-vectors spectra f and g are said to have the same color if they appear the same to a human observer. In our linear model, this implies that if f and g represent different spectral distributions, they portray equivalent colors if
2-D CCD Array Focal Plane
S Tf = S Tg. Lens
Image Plane
[FIG2] Image formation process in digital still camera.
(2)
From this, it can be easily seen that many different spectra can result in the same color appearance to a given observer. This fasci´ er ism), and nating phenomena is known as metamerism (meh tam the two spectra are termed as metamers. In essence, metamerism is basically color aliasing and can be described by generalizing the well-known Shannon sampling theorem frequently encountered in communications and digital signal processing. It should be noted, however, that the level of metamerism may vary across various observers, dependent on their individual cone sensitivities. Since it is not practical to characterize the spectral sensitivity of all observers, the color community, in the form of the Commission Internationale de l’Eclairage (CIE), has tabulated a standard set of color matching functions that represent the response of a “standard observer” to matching monochromatic light at various wavelengths with varying intensities of three primary lights. These functions are shown in Figure 3 as dashed
IEEE SIGNAL PROCESSING MAGAZINE [16] JANUARY 2005
Authorized licensed use limited to: Rochester Institute of Technology. Downloaded on February 3, 2009 at 14:32 from IEEE Xplore. Restrictions apply.
lines. If we let the matrix Argb represent the relative amount of each of the primaries required to match a standard intensity of monochromatic light, then it can be shown that S can be obtained by a linear transformation of the color matching matrix, Argb . Indeed, any matrix that can be obtained by a linear transformation from Argb or S can be utilized for color matching. The derivations are discussed in detail in [14]. In practice, it is desirable to have a matrix of color matching functions that are nonnegative, so they can be physically realized as optical filters. This problem was addressed by the CIE, in 1931, yielding the X Y Z color matching functions shown in Figure 3 as solids lines. Hence, the matrix A can now be used to represent these functions. The Y value was chosen to be the luminous efficiency function, making it equivalent to the photometric luminance value. This standardization led to the precise definition of colorimetric quantities, such as tristimulus values and chromaticity. The term “tristimulus values” refers to the vector of values obtained from a radiant spectrum, r, by t = [X , Y, Z ]T = AT r (we recognize the inconsistency of denoting the elements of t by X, Y, Z, but since the color world still uses the X, Y, Z terms, we use it here). The chromaticity is then obtained by normalizing the tristimulus values yielding x =X/(X + Y + Z) y =Y/(X + Y + Z) z =Z/(X + Y + Z). Since x + y + z = 1, any two chromaticity coordinates aresufficient to characterize the chromaticity of a spectrum. In general, as a matter of convention, the x and y terms are used as the standard. A chromaticity diagram constructed from x and y, (as shown in Figure 6) is often employed to describe the possible range of colors that can be produced by a color output device. This maximum range is plotted as a horseshoe or shark fin shaped curve, which represents the chromaticities of monochromatic light. MATHEMATICS OF COLOR REPRODUCTION To reproduce a color image, it is necessary to generate new vectors in N space (spectral space) from those obtained by a given multispectral sensor. Since the eye can be represented as a three-channel sensor, it is most common for a multispectral sensor to use three types of filters. Hence, the characteristics of the resulting multispectral response functions associated with the input and output devices are critical aspects for color reproduction. Output devices can be characterized as being additive or subtractive. Additive devices, such as cathode ray tubes (CRTs), produce light of varying spectral composition as viewed by the human observer. On the other hand, subtractive devices, such as ink-jet printers, produce filters that attenuate portions of an illuminating spectrum. We will discuss both types in the following, clearly highlighting their differences. ADDITIVE COLOR SYSTEMS In additive devices, various colors are generated by combining light sources with different wavelengths. These light sources
RGB (Dashed) and XYZ (Solid) Color Matching Functions 2 1.5 1 0.5 0 −0.5 −1 400
450
500
550
600
650
700
Wavelength (nm) [FIG3] CIE RGB and XYZ color matching functions: RGB are shown in dashed lines, and XYZ are shown in solid lines.
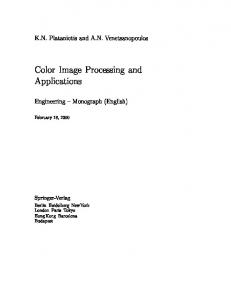
are known as primaries. An example of this is illustrated in Figure 4. In the figure, it can be easily seen that cyan, magenta, yellow, and white are generated by combining blue and green; red and blue; red and green; and red, green, and blue, respectively. The red, green, and blue channels of an example color image are also shown for illustration purposes. Other colors can be generated by varying the intensities of the red, green, and blue primaries. For instance, the screen of a television, or CRT, is covered with phosphoric dots that are clustered in groups. Each group contains these primary colors: red, green, and blue, which are combined in a weighted fashion to produce a wide range of colors. Additive color systems are characterized by their corresponding multispectral output response. For instance, a three-color monitor is represented by the N × 3 matrix, E, which serves the same purpose as the primaries in the color matching experiment. The amount of each primary is controlled by a three-vector c. The spectrum of the output is then computed as follows: f = Ec,
(3)
Hence, the tristimulus values associated with a standard observer who is viewing the screen are given by t = A Tf = A TEc.
(4)
There are several challenges that need to be considered when dealing with additive systems. One is to choose the control values so that the output matches the intended target values. This is not feasible for all possible colors due to the power limitations of the output device. Furthermore, the control values cannot be negative, i.e., we cannot produce negative light. In addition, we have the question of estimating the best values of c from some recorded data.
IEEE SIGNAL PROCESSING MAGAZINE [17] JANUARY 2005
Authorized licensed use limited to: Rochester Institute of Technology. Downloaded on February 3, 2009 at 14:32 from IEEE Xplore. Restrictions apply.
Red Image n
d Re
Gu
Green Image Blue Image n
u nG
ee
Gr
n
lue
Gu
and is related to the physical density of the material. The inks can be characterized by their density spectra, the N × 3 matrix D. Hence, the spectrum that is seen by the observer is the product of an illumination source, the transmission of the ink, and the reflectance of the paper. Since the transmissions of the individual inks reduce the light proportionately, the output at each wavelength, λ, is given by g(λ) = l(λ)t1 (λ)t2 (λ)t3 (λ)
(7)
B
where ti (λ) is the transmission of the ith ink and l(λ) is the intensity of the illuminant. For simplification, the reflectance of the paper is assumed perfect and is assigned the value of 1.0. The transmission of a particular colorant is related logarithmically to the concentration of the ink on the page. The observed spectrum is obtained mathematically by � � g = L 10−Dc +
+
where L is a diagonal matrix representing an illuminant spectrum and c is the concentration of the colorant. The concentration values are held between zero and unity and the matrix of density spectra, D, represents the densities at the maximum concentration. The exponential term is computed componentwise, i.e.,
=
[FIG4] Additive color system.
SUBTRACTIVE COLOR SYSTEMS Subtractive systems are characterized by the fundamental property that color is obtained by removing (subtracting) selected portions of a source spectrum. This is illustrated in Figure 5, where cyan, magenta, and yellow colorants are used to absorb, in this respect, the red, green, and blue spectral components from white light. The cyan, magenta, and yellow channels of a color image are also shown for illustration purposes. Hence, each colorant absorbs its complementary color and transmits the remainder of the spectrum. The amount of light removed, by blocking or absorption, is determined by the concentration and material properties of the colorant. The color is generally presented on a transmissive medium like transparencies or on a reflective medium like paper. While the colorant for subtractive systems may be inks, dyes, wax, or toners, the same mathematical representation outlined in previously can be used to approximate them. The main property of interest for imaging in subtractive systems is the optical density. The transmission of an optically transmissive material is defined as the ratio of the intensity of the light that passes through the material to the intensity of the source. This is illustrated by T=
Iout . Iin
10r = [10 r1 10 r2 . . . 10 rN ] T.
(6)
(9)
This simple model ignores nonlinear interactions between colorant layers. For a reflective medium, the model requires an additional diagonal matrix, which represents the reflectance spectrum of the surface. For simplicity, this can be conceptually included in the illuminant matrix L. The actual process for subtractive color reproduction is much more complicated and cannot, in general, be comprehensively modeled by the equations described here. Hence, these systems are usually characterized by look-up tables (LUTs) that capture their input-output relationships empirically. The details of handling device characterizations via LUTs are described in [19] and [18]. GAMUT The range of colors that are physically obtainable by a color system is called the gamut of the device. For an additive device, like a CRT, the gamut is easily described. Since the colors are linear combinations of three primaries, the possible colors are those obtained from the relation c = Cmax β
(5)
As a result, the optical density is defined by d = − log10 (T)
(8)
(10)
where Cmax is the matrix of tristimulus values for the maximum control value (usually 255) of each color gun and β is a vector whose values vary independently between zero and unity. The graphical rep-
IEEE SIGNAL PROCESSING MAGAZINE [18] JANUARY 2005
Authorized licensed use limited to: Rochester Institute of Technology. Downloaded on February 3, 2009 at 14:32 from IEEE Xplore. Restrictions apply.
resentation of the gamut is most often done using the chromaticity coordinates for a fixed luminance. Figure 6 shows the gamut of a CRT monitor, a dye-sublimation printer, and the sRGB color space. COLOR SPACES The proper use and understanding of color spaces is necessary for the development of color image processing methods that are optimal for the human visual system. Many algorithms have been developed that process in an RGB color space without ever defining this space in terms of the CIE color matching functions, or even in terms of the spectral responses of R, G, and B. Such algorithms are nothing more than multichannel image processing techniques applied to a three-band image, since there is no accounting for the perceptual aspect of the problem. To obtain some relationship with the human visual system, many color image processing algorithms operate on data in hue, saturation, lightness (HSL) spaces. Commonly, these spaces are transformations of the aforementioned RGB color space and hence have no visual meaning until a relationship is established back to a CIE color space. To further confuse the issue, there are many variants of these color spaces, including hue saturation value (HSV), hue saturation intensity (HSI), and hue chroma intensity (HCI), some of which have multiple definitions in terms of transforming from RGB. Since color spaces are of such importance and a subject of confusion, we will discuss them in detail. There are two primary aspects of a color space that make it more desirable and attractive for use in White Light color devices: 1) its computational expediency in transforming a given set of data to the specific color space and 2) conformity of distances of color vectors in the space to that observed perceptually by a human subject, i.e., if two colors are far apart in the color space, they look significantly different to an observer with normal color vision. Unfortunately, these two criteria are antagonistic. The color spaces that are most suited for measuring perceptual differences require complex computation, and vice versa. UNIFORM COLOR SPACES It is well publicized that the psychovisual system is nonlinear and extremely complex. It cannot be modeled by a simple function. The sensitivity of the system depends on what is being observed and the purpose of the observation. A measure of
sensitivity that is consistent with the observations of arbitrary scenes is well beyond our present capabilities. However, much work has been done to determine human color sensitivity in matching two color fields that subtend only a small portion of the visual field. In fact, the color matching functions (CMFs) of Figure 3 are more accurately designated by the solid angle of the field of view that was used for their measurement. A two-degree field of view was used for those CMFs. It is well known that mean square error is, in general, a poor measure of error in any phenomenon involving human judgment. A common method of treating the nonuniform error problem is to transform the space into one where Euclidean distances are more closely correlated with perceptual ones. As a result, the CIE recommended, in 1976, two transformations in an attempt to standardize measures in the industry. Neither of these standards achieve the goal of a uniform color space. However, the recommended transformations do reduce the variations in the sensitivity ellipses by a large degree. In addition, they have another major feature in common: the measures are made relative to a reference white point. By using the reference point, the transformations attempt to account for the adaptive characteristics of the visual system. The first of these transformation is the CIELab space defined by
−
Yellow Layer
Magenta Layer
Cyan Layer
Final Image
−
−
[FIG5] Subtractive color system.
IEEE SIGNAL PROCESSING MAGAZINE [19] JANUARY 2005
Authorized licensed use limited to: Rochester Institute of Technology. Downloaded on February 3, 2009 at 14:32 from IEEE Xplore. Restrictions apply.
=
�
�1 Y 3 − 16 Yn �� � 1 � � 1 � X 3 Y 3 a∗ =500 − Xn Yn �� � 1 � � 1 � Y 3 Z 3 b∗ =200 − Yn Zn
L∗ =116
(13)
�1 Y 3 L =116 − 16 Yn u∗ =13L∗ (u − un) �
∗
u=
(12)
for (X/X n), (Y/Yn), (Z/Zn) > 0.01. The values X n, Yn, Zn are the CIE tristimulus values of the reference white under the reference illumination, and X, Y, Z are the tristimulus values, which are to be mapped to the CIELab color space. This maps the reference white to (L∗ , a∗ , b∗ ) = (100,0,0). The requirement that the normalized values be greater than 0.01 is an attempt to account for the fact that at low illumination the cones become less sensitive and the rods (monochrome receptors) become active. Hence, a linear model is used at low light levels. A second transformation is the CIELuv space defined by
∗
4X X + 15Y + 3Z 9Y v= X + 15Y + 3Z 4X n un = X n + 15Yn + 3Zn 9Yn . vn = X n + 15Yn + 3Zn
(11)
(14) (15)
∗
v =13L (v − vn)
(17) (18) (19) (20)
The un and vn tristimulus values represent a reference white and the formula is good for (Y/Yn) > 0.01. Errors between two colors c1 and c2 are measured in terms of � �1/2 ∗ = (L∗1 − L∗2 )2 + (a∗1 − a∗2 )2 + (b∗1 − b∗2 )2 �Eab � �1/2 ∗ = (L∗1 − L∗2 )2 + (u∗1 − u∗2 )2 + (v∗1 − v∗2 )2 . �Euv
(21) (22)
∗ with a new weighted version, The CIE has since updated �Eab ∗ which is designated �E94 [24]. The new measure weights the ∗ measure by a funchue and chroma components in the �Eab tion of chroma. Specifically, the measure is given by
(16) ∗ �E94
where
�� =
�L∗ kL SL
�2
� +
�C∗ab kC SC
�2
� +
�Hab∗
�2 �1/2
kH SH
(23)
where SL = 1
0.9
∗ SC = 1 + 0.045Cab
sRGB Dye-Sub Gamut Apple Monitor Gamut
0.8
∗ SH = 1 + 0.015Cab
� ∗ Cab = (a∗ )2 + (b∗ )2 � ∗ )2 − (�L∗ )2 − (�C ∗ )2 �Hab∗ = (�Eab ab
0.7 0.6 0.5
(24) (25) (26)
y
and for reference conditions
0.4
kL = kC = kH = 1.
0.3 0.2 0.1 0
0
0.1
0.2
0.3
0.4 x
0.5
0.6
[FIG6] Color gamuts shown in chromaticity space.
0.7
0.8
(27)
∗ , used in (24) can be taken as a reference The color term, Cab color against which many comparisons are made. If only a single color difference is computed between two samples, then the ∗ of the samples is used. geometric mean of Cab The just noticeable difference thresholds of �Eab and �E94 are much lower in the experimental setting of psychovisual experiments than in pictorial scenes. Color difference measures, such as the �Es in the sCIELab space [23], have been developed to provide an improved measure for pictorial scenes. The uniform color spaces can be utilized as a means to display
IEEE SIGNAL PROCESSING MAGAZINE [20] JANUARY 2005
Authorized licensed use limited to: Rochester Institute of Technology. Downloaded on February 3, 2009 at 14:32 from IEEE Xplore. Restrictions apply.
the gamut of a particular device, as shown in Figure 7 for a dyesublimation printer and a CRT. The CIELab and CIELuv color spaces can be used to visualize color attributes such as hue, chroma, and lightness. These perceptual color terms, as well as saturation (which is frequently confused with chroma), are defined in Wyszecki and Stiles [22, p. 487]. Figure 8 displays a three-dimensional plot of the CIELuv space and quantities that correlate with these attributes. A similar figure can be generated for CIELab.
Monitor: Grid, Printer: Solid
100 80 60 L*
DEVICE INDEPENDENT (UNRENDERED) AND DEPENDENT SPACES The terms “device independent” (DI) and “device dependent” (DD) color spaces are frequently used in problems dealing with accurate color recording and reproduction. A color space is defined to be DI if there exists a nonsingular transformation between the color space and the CIEXYZ color space. These spaces are also called “unrendered” since the values in the space describe the colorimetry and are not used to drive an output device. If there is no such transformation, then the color space is a DD color space. DD spaces are typically related to some particular output or input device. They are often used for the simple reason that most output and input devices report or accept values that are in a DD space. A simple example is the eight-b/channel RGB scanner that provides values that are contained in a cube defined by the points (0, 0, 0) and (255, 255, 255). This cube is a DD color space. The space, however, is still useful since the DD RGB values can be sent directly to a monitor or printer for image display. However, it is often the case that the output image will not look like the original scanned image. STANDARD DD (RENDERED) SPACES To maintain the simplicity of the DD space but provide some degree of matching across input and output devices, standard DD color spaces have been defined. These spaces will be referred to as standard DD spaces. An example of such a color space is sRGB [20]. These spaces are well defined in terms of a DI space. As such, a device manufacturer can design an input or output device such that, when given sRGB values, the proper DI color value is displayed. Because the values in these spaces can be used to drive output devices, they are often referred to as rendered spaces. COLOR MEASUREMENT INSTRUMENTS To measure color accurately, a given instrument must have carefully controlled lighting conditions, optical geometry, and sensors (filters and detectors). If the color of a reflective material is to be measured, the illumination must be precisely known and matched with the sensors. Media properties such as specular reflectance and translucence should be taken into account to achieve accurate results. However, if only the tristimulus values or some derivative of them, such as L∗ a∗ b∗ values, are desired, a colorimeter may be used. This device has spectral sensitivities designed to match the vector space defined by the eye. Thus, the measurement is limited to a given set of viewing conditions. As a result, the colorimeter needs to measure only the quantities that
40 20 0 100 50
100 0 b*
−50
−50
0
50
a*
[FIG7] Color gamuts shown in CIELab space: monitor grid, printer solid.
can be transformed into tristimulus values. The minimal system consists of three filters and three detectors or changeable filters and a single detector. Colorimeters are much less expensive than those devices designed to measure the entire spectrum. The most complete information is obtained by measuring the entire visible spectrum, thereby allowing the user to compute tristimulus values under any viewing condition. This is achieved by utilizing a spectroradiometer to measure radiant spectra or a spectrophotometer to measure reflective spectra. To measure the spectrum, it is required that the spectrum of the light be spread physically. This can be done with a prism, as Newton did in his famous early experiments, or more accurately, by utilizing optical gratings, which are more precise and compact than prisms.
[FIG8] CIELuv color space and its relationship to commonly used color perception terms.
IEEE SIGNAL PROCESSING MAGAZINE [21] JANUARY 2005
Authorized licensed use limited to: Rochester Institute of Technology. Downloaded on February 3, 2009 at 14:32 from IEEE Xplore. Restrictions apply.
To this effect, a system of lenses is used to focus the spectrum onto the detector to obtain the measurements. After the spectrum is spread, the intensity of the light at each wavelength is measured accurately. This can be done in several ways. The most common method, currently, is to use a linear CCD array. A movable slit can also be used to limit the wavelength band being measured. The exact spread of the spectrum on the array is determined by measuring a known source. Interpolation methods are then used to generate the data at the specified wavelengths. The high-quality optics required for this task greatly increase the cost of these color measurement instruments. AUTHORS H. Joel Trussell received the B.S. degree from Georgia Institute of Technology in 1967, the M.S. degree from Florida State in 1968, and the Ph.D. degree from the University of New Mexico in 1976. He joined the Los Alamos Scientific Laboratory in 1969. During 1978-1979, he was a visiting professor at Heriot-Watt University, Edinburgh, Scotland. In 1980, he joined the Electrical and Computer Engineering Department at North Carolina State University, Raleigh, where he is professor and director of graduate programs. His research has been in estimation theory, signal and image restoration, and image reproduction. He was as associate editor for IEEE Transactions on Acoustics, Speech, and Signal Processing and IEEE Signal Processing Letters. He was a member and past chair of the Image and Multidimensional Digital Signal Processing Committee of the IEEE Signal Processing Society and was on the Board of Governors. He is a Fellow of the IEEE and the corecipient of the IEEE-ASSP Society Senior Paper Award and the IEEE-SP Society Paper Award. Eli Saber is an associate professor in the Electrical Engineering Department at the Rochester Institute of Technology. From 1988 to 2004, he was with Xerox. He received the B.S. degree from the University of Buffalo in 1988 and the M.S. and Ph.D. from the University of Rochester in 1992 and 1996, respectively, all in electrical engineering. From 1997 until 2004, he was an adjunct faculty member at the Electrical Engineering Department of the Rochester Institute of Technology and at the Electrical and Computer Engineering Department of the University of Rochester. He is a Senior Member of the IEEE and a member of the Electrical Engineering Honor Society, Eta Kappa Nu, and the Imaging Science and Technology Society. He is an associate editor for IEEE Transactions on Image Processing, Journal of Electronic Imaging, IEEE Signal Processing Magazine Applications column, and guest editor for the special section on color image processing for IEEE Signal Processing Magazine. He is chair of the Technical Committee on Industry DSP Technology. He was finance chair for the 2002 International Conference on Image Processing and general chair for the 1998 Western New York Imaging Workshop. Michael Vrhel is a distinguished engineer at Conexant Systems, Redmond, Washington. He graduated summa cum laude from Michigan Technological University with a B.S. in 1987 and the M.S. degree in 1989 and a Ph.D. in 1993, from North Carolina State University, all in electrical engineering. From 1993
to 1996, he was a National Research Council, research associate at the National Institutes of Health (NIH) Bethesda Maryland, where he researched biomedical image and signal processing problems. In 1996, he was a Senior Staff Fellow with the Biomedical Engineering and Instrumentation Program at NIH. From 1997 to 2002, he was the senior scientist at Color Savvy Systems Limited, Springboro, Ohio. From 2002 to 2004, he was the senior scientist at ViewAhead Technology, in Redmond, Washington. He has two patents and several pending. He has published more than 40 refereed journal and conference papers. He is a Senior Member of the IEEE and a member of the SPIE. He is a guest editor for IEEE Signal Processing Magazine. He was a Conference Session chair for ICIP-2002, ICIP-2000, and SPIE Wavelet Applications in Signal and Image Processing IV 1996. REFERENCES [1] M. Vrhel, E. Saber, and H.J. Trussell, “Color image generation and display technologies,’’ IEEE Signal Processing Mag., vol. 22, no. 1, pp. 23–33, Jan. 2005. [2] F.A. Baqai, J.-H. Lee, A.U. Agar, and J.P. Allebach, “Digital color halftoning,’’ IEEE Signal Processing Mag., vol. 22, no. 1, pp. 87–96, Jan. 2005. [3] R. Ramanath, W.E. Snyder, Y. Yoo, and M.S. Drew, “Color image processing pipeline,’’ IEEE Signal Processing Mag., vol. 22, no. 1, pp. 34–43, Jan. 2005. [4] R. Bala and G. Sharma, “System optimization in digital color imaging,’’ IEEE Signal Processing Mag., vol. 22, no. 1, pp. 55–63, Jan. 2005. [5] B.K. Gunturk, J. Glotzbach, Y. Altunbasak, R.W. Schafer, and R.M. Mersereau, “Demosaicking: Color filter array plane interpolation,’’ IEEE Signal Processing Mag., vol. 22, no. 1, pp. 44–54, Jan. 2005. [6] A. Koschan and M. Abidi, “Detection and classification of edges in color images,’’ IEEE Signal Processing Mag., vol. 22, no. 1, pp. 64–73, Jan. 2005. [7] R. Lukac, B. Smolka, K. Martin, K.N. Plataniotis, and A.N. Venetsanopoulos, “Vector filtering for color imaging,’’ IEEE Signal Processing Mag., vol. 22, no. 1, pp. 74–86, Jan. 2005. [8] J.B. Cohen and W.E. Kappauf, “Metameric color stimuli, fundamental metamers, and Wyszecki’s metameric blacks,” Amer. J. Psychol., vol. 95, no. 4, pp. 537–564, Winter 1982. [9] B.K.P. Horn, “Exact reproduction of colored images,” Computer Vision, Graph. Image Processing, vol. 26, pp. 135–167, 1984. [10] K.N. Plataniotis and A.N. Venetsanopoulos, Color Image Processing and Applications. Heidelberg: Springer, 2000. [11] G. Sharma and H.J Trussell, “Digital color processing,’’ IEEE Trans. Image Processing, vol. 6, no. 7, pp. 901–932, July 1997. [12] G. Sharma, Ed., Digital Color Imaging Handbook. Boca Raton, FL: CRC Press, 2003. [13] H.J. Trussell, “Applications of set theoretic methods to color systems,’’ Color Res. Applicat., vol. 16, no. 1, pp. 31–41, Feb. 1991. [14] H.J. Trussell, “DSP solutions run the gamut for color systems,’’ IEEE Signal Processing Mag., vol. 10, no. 2, pp. 8–23, Apr. 1993. [15] B.A. Wandell, “The synthesis and analysis of color images,” IEEE Trans. Pattern Anal. Machine Intell., vol. PAMI-9, no. 1, pp. 2–13, Jan. 1987. [16] B.A Wandell, Foundations of Vision. Sunderland, MA: Sinauer Assoc. 1995. [17] P.L. Vora, J.E. Farrell, J.D. Tietz, and D.H. Brainard, “Image capture: simulation of sensor responses from hyperspectral images,’’ IEEE Trans. Image Processing, vol. 10, no. 2. pp. 307–316, Feb. 2001. [18] M.J. Vrhel and H.J. Trussell, “Color printer characterization in MATLAB,’’ ICIP 2002, vol. 1, Sept. 2002, pp. 457–460. [19] H.R. Kang, Color Technology for Electronic Devices. Bellingham WA: SPIE Press, 1997. [20] M. Anderson, R. Motta, S. Chandrasekar, and M. Stokes, “Proposal for a standard default color space for the internet—sRGB,’’ in Proc. IS&T/SID 4th Color Imaging Conf.: Color Science, Systems Applications, Nov. 1996, pp. 238–246. [21] H.B. Barlow and J.D. Mollon, The Senses. Cambridge, U.K.: Cambridge Univ. Press, 1982. [22] G. Wyszecki and W.S. Stiles, Color Science: Concepts and Methods, Quantitative, Data and Formulae. 2nd ed. New York: Wiley, 1982. [23] X. Zhang and B.A. Wandell, “A spatial extension of CIELAB for digital color image reproduction,’’ in Proc. SID Symp., 1996, pp. 731–734. [Online]. Available: http://white.stanford.edu/~brian/scielab/scielab.html [24] CIE, “Industrial colour difference evaluation,’’ Tech. Rep. 116-1995.
IEEE SIGNAL PROCESSING MAGAZINE [22] JANUARY 2005
Authorized licensed use limited to: Rochester Institute of Technology. Downloaded on February 3, 2009 at 14:32 from IEEE Xplore. Restrictions apply.
[SP]