3rd International Conference on Science, Ecology and Technology Rome, ITALY 14-16 August 2017
COLOUR FEATURE-BASED CLASSIFICATION OF WHEAT GRAIN USING ANN WITH BAYESIAN REGULARIZATION LEARNING ALGORITHM A. Kayabası*, B. Yildiz, K. Sabanci, E. Yigit, A. Toktas, M. Tekbas Karamanoğlu Mehmetbey University, Engineering Faculty, Department of Electrical and Electronics Engineering, TURKEY (
[email protected],
[email protected],
[email protected],
[email protected],
[email protected],
[email protected]) Corresponding Author‟s e-mail:
[email protected]
ABSTRACT
In this paper, a color feature-based classification of the wheat grains into bread and durum using artificial neural network (ANN) model with bayesian regularization (BR) learning algorithm is presented. Images of 200 wheat grains are taken by a high resolution camera in order to generate the data set for training and testing processes of the ANN-BR model. Data of 3 main colour features (R, G and B) for 200 wheat grains (100 for durum and 100 for bread) are acquired for each grain using image processing techniques (IPTs). Features of R, G and B are separately determined by taking arithmetic average of the pixels within each grain. Several colour features of R/TRGB, G/TRGB, B/TRGB, R-G, G-B and R-B where TRGB is the total of R+G+B are reproduced. Then ANN-BR model input with the 9 colour parameters are trained through 180 wheat grain data and their accuracies are tested via 20 data. The ANN-BR model numerically calculate the outputs with mean absolute error (MAE) of 0.0060 and classify the grains with accuracy of 100% for the testing process. These results show that the ANN-BR model can be successfully applied to classification of wheat grains.
Keywords: Classification, wheat grains, image processing technique, artificial neural network, bayesian regularization learning algorithm 174
3rd International Conference on Science, Ecology and Technology Rome, ITALY 14-16 August 2017
1. INTRODUCTION
Classifying of agricultural products is very important for economic reasons. The wheat grains with different quality are used in making bread, pasta and cakes which are end products. The quality of wheat grain is related to the amount of protein it possesses. Durum wheat has more protein than the bread wheat. The bread wheat grains mixing into durum grains lead to a reduction in its protein content. Therefore, classification of wheat grains is very important to increase the quality and decrease the cost. Image processing techniques (IPTs) can be employed to classify the products through the visual features. Furthermore, artificial intelligence techniques (AITs) are integrated to the IPTs for classification applications [1-2]. Artificial neural network (ANN), support vector machine (SVM), adaptive neuro-fuzzy inference system (ANFIS), decision tree (DT), K-nearest neighbors (KNN), Naive Bayes (NB) and discriminant analysis (DA) are the most used AITs for classifying agricultural products[ 3-7]. Over a last decade ANN which is widely used AIT model adopts remarkable importance in classification of agricultural grains due to its fast and accurate modeling. Several works for classifying of various agricultural products have been studied in the literature. Berman et al. classified wheat grains using near infrared hyperspectral image analysis [8]. The efficiencies of the cotton seeds were appointed by classifiers depending on DT and multilayer perceptron (MLP) by Jamuna et al. [9]. In classification of the wheat and barley seeds, DA and KNN were used to form a classifier [10]. Progressive analysis and metamulticlass method were employed to classify the wheat grains by Zapotoczny [11]. A study using classifiers and ultraviolet visible spectrophotometry conducted to classify the spice through the KNN [12]. Prakash et al. studied the classification of objects for machine vision implementations with classifier algorithms of the KNN and Naive Bayes [13]. ANN and ANFIS were utilized to classify rice grains into five species with respect to the morphologic features [14]. A MLP-based ANN was modeled by Muñiz-Valencia et al. for classification of coffee grains according to their mineral content [15]. The ANN with the NB was designed by De Oliveira et al. for classification of green coffee grains into four group [16]. It is seen that those proposed classifiers varied among the used techniques, the features of products taken into account and the classification accuracy. Some of them might be difficult to implement while several took into account fewer parameters in classification. Therefore, their mean errors concerning the accuracy of the classification maintained limited.
175
3rd International Conference on Science, Ecology and Technology Rome, ITALY 14-16 August 2017
In this study, a model using ANN with bayesian regularization (BR) [17] learning algorithm is designed to classify wheat grains into bread or durum according to their colour features with high accuracy. The ANN-BR model is built on feed forward back propagation (FFBP) based on multilayer perceptron (MLP). 3 colour features (R, G and B) of 200 wheat grains are acquired for each grain through IPTs for input ANN-BR model. The feature data of 180 grains and 20 grains which are uniformly selected from the total number of 200 grains are respectively employed to train and test the accuracy of the model. The ANN-BR model correctly classifies the wheat grains into durum and bread with 100 % for the training and testing process.
3. IMAGE PROCESSING TECHNIQUE In this section, images are taken and they are imposed to the IPTs to acquire data related to the colour features of the wheat grains in order to the ANN-BR model as illustrated in Figure 1. A setup including a computer, a camera and a box arranged by camera holder and a strip LED lighting is used in order to obtain the images. The camera is Logitech C920 CCD having specifications of full HD (1080p), 15 MP, H.264 encoding, Carl Zeiss optics. The photographs are taken by the camera fixed at 35 cm height from the wheat at the bottom of the box which is closed and self-illuminated. The inside of the box is covered with black background.
Figure 1. Flowchart of extracting colour features
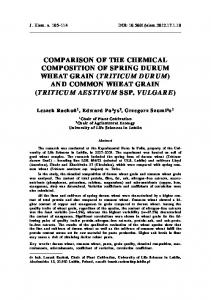
The images of the wheat grains for bread and durum taken by the camera are illustrated in Figure 2. The bread wheat grain is close to yellow in color, while the durum wheat grain is darker yellow. Therefore features related to color is considered in this study to model a classifier based on IPT. In order to acquire feature data of the wheat grains (cultivated in 176
3rd International Conference on Science, Ecology and Technology Rome, ITALY 14-16 August 2017
Konya, Turkey) for classification, photographs of 100 bread wheat grains (Figure 3(a)) and 100 durum wheat grains (Figure 3(b)) are taken with the high-resolution camera.
(a)
(b)
Figure 2. The images of the grains for a) bread wheat, b) durum wheat
(a)
(b)
Figure 3. The RGB images of 100 grains for a) bread wheat, b) durum wheat
The IPTs are conducted through MATLAB® software to acquire the feature data. Firstly, the RGB level of the each pixel in the images are determined. These images are then converted to grayscale format as shown in Figure 4a and 4b. Secondly, the grayscale images seen from Figure 4c and 4d are converted to binary images (black/white) using Otsu's method [18] in accordance with threshold values of 0.30588 and 0.25882 for bread and durum grains, respectively. Thus the noise of each image is eliminated using morphological process. Thirdly, the each grain‟s position is fixed and they are tagged according to its position through segmentation process. 177
3rd International Conference on Science, Ecology and Technology Rome, ITALY 14-16 August 2017
(a)
(b)
(c)
(d)
Figure 4. The images of 100 grains for a) grayscale of bread wheat, b) grayscale of durum wheat a) binar images of bread wheat, b) binar images of durum wheat (originally given in Figure 3)
4. DATA ACQUISITION The visual data related to colour features of each grain is extracted to constitute data set (Table 1). R, G and B in Table 1 are separately determined by taking arithmetic average of the pixels within each grain. Likewise, several colour features of R/TRGB, G/TRGB, B/TRGB, R-G, G-B and R-B where TRGB is the total of R+G+B are reproduced. Colors features of the wheat grains are considered in this study to ANN-BR model. Table 1. The main and reproduced colur feature data
Input data Main data Reproduced data
Input # 3 6
Colour R, G, B R/TRGB, G/TRGB, B/TRGB, R-G, G-B, R-B
178
3rd International Conference on Science, Ecology and Technology Rome, ITALY 14-16 August 2017
In Figure 5, 3D scattering of the grains are illustrated to show how durum and bread grains discriminate among each other according to the mentioned colour features. R, G, B from the colour is considered for examining their behavior. It is seen that from the Figure 5 the durum and bread grains cluster distinctly on opposite sides with respect to visual features of colour. This results demonstrate that the durum and bread grains have different features according to colour. Therefore, these colour features can be successfully utilized to classify the wheat grains.
Figure 5. 3D scattering of 100 durum and 100 bread grains according to colour features of R, G and B
5. THE ANN-BR MODEL Different learning algorithms are used for ANN networks. Some famous type of different backpropagation learning algorithms are Levenberg-Marquardt (LM), Bayesian regularization (BR), cyclical order incremental update (COIU), Powel-Beale conjugate gradient (PBCG), Fletcher-Powel conjugate gradient (FPCG), Polak-Ribiere conjugate gradient (PRCG), one step secant (OSS) and scaled conjugate gradient (SCG) [17]. In this study, the BR algorithm was used in ANN model as learning algorithm. LM and BR are able to obtain lower mean squared errors than any other algorithms for functioning approximation problems. LM was especially developed for faster convergence in backpropagation algorithms. BR learning algorithm updates the weight and bias values according to the LM optimization and minimizes a linear combination of squared errors and weights. It also modifies the linear combination so that at the end of training the resulting network has good generalization qualities. Training Process of ANN-BR Model 179
3rd International Conference on Science, Ecology and Technology Rome, ITALY 14-16 August 2017
The main and reproduced colur feature data (R, G, B, R/TRGB, G/TRGB, B/TRGB, R-G, GB and R-B) of the wheat grains were given as inputs and their respective classification results of IPT were given as output to the ANN-BR model. While 180 of 200 data set of wheat grains were employed for training process. After several trials, ANN-BR model based on MLP having one input layer with nine neurons, one hidden layer with five neurons and one output layer with one neuron was constructed, as shown in Figure 6. “Tangent sigmoid” function is used for input and hidden layers while “purelin” function is utilized for output layer. The parameters of the ANN-BR model used in this work are listed in Table 2. The training results are checked according to the following mean absolute error (MAE),
MAE
Target Output Number of grains
(1)
Target Durum/Bread R G
INPUTS PARAMETERS
B R/TRGB Output
G/TRGB
B/TRGB R-G G-B R-B
Input layer
Hidden layer
Ouput layer
Figure 5. The ANN-BR model for classification of the wheat grains into bread or durum Table 1. The parameters used to set the ANN model 180
3rd International Conference on Science, Ecology and Technology Rome, ITALY 14-16 August 2017
Parameter
Set type/value
Number of epochs
500
Seed value
1239411541
Minimum gradient descent
10-10
Momentum parameter (μ)
0.00015
μ increment value
5
μ decrement value
0.15
Maximum μ value
1010
Testing Process of ANN-BR Model The testing data including 9 colour features of 20 grains (10 bread wheat grains and 10 durum wheat grains) and their testing results are tabulated in Table 2 and Table 3, respectively. As illustrated Table 3, while the number of “1” is assigned to specify durum grains, “2” is appointed to define the bread grains as targets of the ANN-BR model. The ANN-BR model proposed in this study accurately classifies 14 grains with 0 (zero) and 6 grains with very small absolute errors. It demonstrates that the proposed IPT based ANN-BR model can be successfully utilized to classify the wheat grains. Table 2. The colour features of wheat grains used for testing process
Grain #
Colour features R
G
B
R/TRGB G/TRGB B/TRGB
R-G
G-B
R-B
1
0.46401 0.46110 0.37554 0.35675
0.35451
0.28873 0.00291 0.08556 0.08847
2
0.44629 0.42667 0.31442 0.37586
0.35933
0.26480 0.01963 0.11225 0.13187
3
0.45408 0.43612 0.32905 0.37243
0.35770
0.26988 0.01796 0.10707 0.12503
4
0.47520 0.45899 0.38777 0.35947
0.34720
0.29333 0.01622 0.07122 0.08744
5
0.49530 0.46130 0.36418 0.37500
0.34927
0.27573 0.03399 0.09712 0.13111
181
3rd International Conference on Science, Ecology and Technology Rome, ITALY 14-16 August 2017
6
0.49414 0.47737 0.38694 0.36375
0.35141
0.28484 0.01677 0.09043 0.10720
7
0.49538 0.48514 0.40774 0.35684
0.34946
0.29370 0.01024 0.07741 0.08765
8
0.42867 0.41413 0.30537 0.37335
0.36069
0.26596 0.01454 0.10876 0.12331
9
0.46764 0.46611 0.36868 0.35905
0.35788
0.28307 0.00153 0.09743 0.09896
10
0.49530 0.46130 0.36418 0.37500
0.34927
0.27573 0.03399 0.09712 0.13111
11
0.54295 0.55344 0.49124 0.34198
0.34860
0.30942 0.01050 0.06220 0.05170
12
0.56097 0.56472 0.49251 0.34666
0.34898
0.30435 0.00375 0.07222 0.06847
13
0.54778 0.53283 0.45383 0.35699
0.34725
0.29576 0.01495 0.07899 0.09395
14
0.50643 0.49885 0.41525 0.35651
0.35117
0.29232 0.00758 0.08361 0.09119
15
0.57530 0.57505 0.49077 0.35055
0.35040
0.29904 0.00025 0.08428 0.08453
16
0.53829 0.54708 0.48991 0.34171
0.34729
0.31100 0.00879 0.05718 0.04838
17
0.55437 0.54975 0.47757 0.35049
0.34757
0.30194 0.00463 0.07217 0.07680
18
0.53307 0.55278 0.48354 0.33967
0.35223
0.30810 0.01971 0.06925 0.04954
19
0.53343 0.54038 0.47404 0.34463
0.34912
0.30626 0.00695 0.06634 0.05939
20
0.52088 0.54294 0.46972 0.33966
0.35405
0.30630 0.02207 0.07322 0.05116
182
3rd International Conference on Science, Ecology and Technology Rome, ITALY 14-16 August 2017
Table 3. The testing results of classifying the wheat grains with the ANN-BR model
Result Grain # IPT Results
ANN-BR Results
1
1
1
0
Durum
2
1
1
0
Durum
3
1
1
0
Durum
4
1
0.9810
0.0190
Durum
5
1
0.9994
0.0006
Durum
6
1
1
0
Durum
7
1
1.0342
0.0342
Durum
8
1
1
0
Durum
9
1
1
0
Durum
10
1
0.9994
0.0006
Durum
11
2
2
0
Bread
12
2
2
0
Bread
13
2
2
0
Bread
14
2
2.0580
0.0580
Bread
15
2
2
0
Bread
16
2
2
0
Bread
17
2
2
0
Bread
18
2
2
0
Bread
19
2
2
0
Bread
20
2
2
0
Bread
MAE
Absolute Errors Classification
0.0060 183
3rd International Conference on Science, Ecology and Technology Rome, ITALY 14-16 August 2017
Accuracy
100%
6. CONCLUSION In this article IPT based ANN-BR model is proposed for accurate classification of the wheat grains into bread and durum. The ANN-BR model based upon the MLP with three layers is designed for this purpose. 3 main and 6 reproduced colour features are acquired for 100 bread and 100 durum wheat grains. The ANN-BR model is trained with 180 grains and its accuracy is tested through 20 grains of 200 wheat grains data. The ANN-BR model classify the wheat grains with the MAE of 0.0060 for testing process. The ANN-BR model correctly classifies the wheat grains into durum and bread with 100 % for the training and testing process. The proposed method can be easy integrated to the industry to automatically classify the agricultural grains.
REFERENCES [1]
K. Mollazade, M. Omid and A. Arefi, 2012. Comparing data mining classifiers for grading raisins based on visual features. Computers and Electronics in Agriculture, 84 124–131.
[2]
C. Sungur and H. Ozkan, 2015. A real time quality control application for animal production by image processing 95. Journal of the Science of Food and Agriculture. 95 2850–2857.
[3]
X. Yu, K. Liu, D. Wu and Y. He, 2012. Raisin quality classification using least squares support vector machine (LSSVM) based on combined color and texture features. Food and Bioprocess Technology, 5 (5) 1552–1563.
[4]
B.G. Hu, R.G. Gosine, L.X. Cao and de C.W. Silva, 1998. Application of a fuzzy classification technique in computer grading of fish products. IEEE Transactions on Fuzzy Systems, 6 (1) 144–152.
[5]
Y. Al Ohali, 2011. Computer vision based date fruit grading system: Design and implementation 23. Journal of King Saud University-Computer and Information Sciences. 23 29–36.
184
3rd International Conference on Science, Ecology and Technology Rome, ITALY 14-16 August 2017
[6]
R.P. Gálvez, F.J.E. Carpio, E.M. Guadix and A. Guadix, 2016. Artificial neural networks to model the production of blood protein hydrolysates for plant fertilization 96. Journal of the Science of Food and Agriculture. 96 207–214.
[7]
J. Pet'ka, J. Mocak, P. Farkaš, B. Balla and M. Kováč, 2001. Classification of Slovak varietal white wines by volatile compounds 81. Journal of the Science of Food and Agriculture. 81 1533–1539.
[8]
M. Berman, P.M. Connor, L.B. Whitbourn, D.A. Coward, B.G Osborne and M.D. Southan, 2007. Classification of sound and stained wheat grains using visible and near infrared hyperspectral image analysis 15. Journal of Near Infrared Spectroscopy. 15 351–358.
[9]
K.S. Jamuna, S Karpagavalli, P. Revathi, S. Gokilavani and E. Madhiya, 2010. Classification of Seed Cotton Yield Based on the Growth Stages of Cotton Crop Using Machine Learning Techniques. International Conference on Advances in Computer Engineering, 312–315.
[10] F. Guevara-Hernandez and J. Gomez-Gil, 2011. A machine vision system for classification of wheat and barley grain kernels 9. Spanish Journal of Agricultural Research. 9 672–680. [11] P. Zapotoczny, 2011. Discrimination of wheat grain varieties using image analysis: morphological features. Europan Food and Research Technology, 769–779. [12] C.V. Di Anibal, I. Ruisánchez, M. Fernández, R. Forteza, V. Cerdà and M.P. Callao, 2012. Standardization of UV–visible data in a food adulteration classification problem. Food Chemistry, 2326–2331. [13] J.S. Prakash, K.A. Vignesh, C. Ashok and R. Adithyan, 2012. Multi class Support Vector Machines classifier for machine vision application. In Machine Vision and Image Processing (MVIP), 197–199. [14] A.R. Pazoki, F. Farokhi and Z. Pazoki, 2014. Classification of rice grain varieties using two Artificial Neural Networks (MLP and Neuro-Fuzzy) 24. Journal of Animal and Plant Sciences. 24 336–343. [15] R. Muñiz-Valencia, J.M. Jurado, S.G. Ceballos-Magaña, Á. Alcázar and J. HernándezDíaz, 2014. Characterization of Mexican coffee according to mineral contents by means of multilayer perceptrons artificial neural networks 34. Journal of Food Composition and Analysis. 34 7–11. [16] E.M. De Oliveira, D.S. Leme, B.H.G. Barbosa, M.P. Rodarte and R.G.F.A. Pereira, 2016. A computer vision system for coffee beans classification based on computational intelligence techniques 171. Journal of Food Engineering. 171 22–27. 185
3rd International Conference on Science, Ecology and Technology Rome, ITALY 14-16 August 2017
[17] M. Zandieh, A. Azadeh, B. Hadadi and M. Saberi, 2009. Application of neural networks for airline number of passenger estimation in time series state. Journal of Applied Science, 9 (6) 1001–1013. [18] N. Otsu, 1979. A Threshold Selection Method from Gray-Level Histograms, IEEE Transactions on Systems, Man, and Cybernetics, 9 (1) 62–66.
186