Coloured Euler diagrams: a tool for visualizing dynamic systems and structured information Paolo Bottoni1 and Andrew Fish2,? 1
Department of Computer Science, “Sapienza” University of Rome, Italy
[email protected] 2 School of Computing, Mathematical and Information Sciences, University of Brighton, UK
[email protected]
Abstract. Euler diagrams are a popular method for visualising sets and their relationships, exploited for resource management and visual logic specification, for example. We add the notion of colouring, provide a formal description of the extended system and demonstrate how coloured Euler diagrams provide adequate visualisations for concepts in the new bio-inspired model of Reaction Systems and for polyarchies, visualising multiple intersecting hierarchies.
1
Introduction
Venn and Euler diagrams were first introduced as an aid in syllogistic reasoning, but in recent times they have been utilised in various application domains, e.g. to represent genetic set relations [8], for file system management [3], or to represent the size of library database query results [15]. They can be viewed as a logic system in their own right, and incorporated into heterogeneous reasoning systems [14], or used to search for minimal proofs [13]. The various definitions of Venn and Euler diagrams (or Euler-like diagrams) in the literature slightly differ in syntax and semantics. We propose to extend the definition of an Euler diagram system to admit a notion of colouring, to which application-dependent semantics can be associated, in contrast with usage of colour as a secondary notation to highlight some information, without including it in the formal system. Extending the formal system in this manner enables the precise use of these diagrams as visualisations incorporating information within this previously unutilised graphical dimension rather than via some other means that may lead to an increase in complexity of the notation or to more cluttered diagrams. We emphasize, however, that we use the term colouring in a mathematical sense of an assignation of numbers (with distinct numbers corresponding to distinct colours in the traditional sense), and whilst this notion maps in the natural manner to the use of actual colours on the diagram, this more abstract concept could in fact be represented graphically by different means if the situation required it. For instance, for colour-blind users, one could utilise an alternative graphical (or ?
Partially funded by UK EPSRC EP/E011160: Visualisation with Euler Diagrams.
concrete) representation making use of varying degrees of “dashned-ness” rather than colours such as red, green and blue, whilst utilising the same abstract model (and the same terminology of colouring at the abstract level). Moreover, we exploit vectors of colours, so that different forms of colouring can be used to visualise different aspects of the system (e.g. border color for identifying a database source, border thickness for expressing degree of relevance, and texture for identifying a keyword, in the presentation of the results of an OR query from federated databases, searching for documents presenting certain keywords). The extension of the formal Euler diagram system to incorporate colouring has merit in that it is of theoretical interest to investigate ways of incorporating information within the diagrammatic notation, whether we are considering their use for simple data visualisation or perhaps more complicated uses such as the basis of diagrammatic logics. Their utility in the case of representing information that changes (e.g. set-based data that changes over time or diagrammatic logic statements that differ by diagrammatic logical inference rule application) is an avenue in which their usage may well bring user benefits, utilising colouring to indicate important changes between diagrams. The formalisation facilitates the use of the colouring concept within automated software systems. We demonstrate the utility of coloured Euler diagrams as a representation system for both dynamical and static aspects within two different application domains. Firstly, we illustrate their usage for visualising notions such as modules along sequences of events, from Reaction Systems [4], a new bio-inspired model of computing where transformations rewrite the complete state of the system (so there is no resource counting). Secondly, we indicate the relationship of coloured Euler diagrams with hierarchies and with polyarchies [10], a representation of multiple intersecting hierarchies, utilised for categorisation in several domains. We give intuition and motivations for Coloured Euler Diagrams (CEDs) in Section 2, and provide terminology and background definitions in Section 3 and a formal definition in Section 4. Section 5 gives an overview of Reaction Systems (rs) and discusses the visualisation of some rs features. In Section 6, we demonstrate their use in the domain of categorisation, comparing with visualisations such as Polyarchies which represent multiple intersecting hierarchies. Conclusions in Section 7 indicate other application areas for future investigation.
2
Motivation
Euler diagrams are a method of visually depicting a family of sets and their relationships. However, in many application domains, it is necessary to simultaneously present multiple families of sets. As an example, in an information system on the organisation of a multinational enterprise, one may categorise the personnel according to several dimensions, e.g. role, position in the organisational hierarchy, place of work. While each of these categories can be presented using Euler curves, there is no salient visual difference to support projection onto one of the categories (i.e. to distinguish the category type of the curves). 2
We explore here the visualisation of polyarchies, multiple overlapping hierarchies, each viewed as a family of sets. We propose to colour sets with a distinct colour for each hierarchy, with shared nodes coloured with a blend of the colours. In this way, one can exploit the spatial features of Euler diagrams, without having to resort to the use of multiple curve labels to indicate multiple categories. Similarly, for dynamic structures, one wants to follow the individual evolution of families of phenomena, while maintaining a representation of the evolution of their relations. For example, for Reaction Systems discussed in this paper, interesting evolutions are those of states and of particular subsets, called modules. Independent of the domain, two set-theoretic relationships related to this visualisation problem are those of embedding and separation, as defined in [4]. Informally, given a family of sets L, a sub-family F is embedded in another subfamily G if all the component sets of F are contained in the intersection of the sets in G. F is separated from G if it is embedded in G and there is a set Y ∈ L such that Y is contained in the intersection of all sets in G, and the union of all sets in F is contained in Y . Providing a visual distinction between the two families may assist readers in assessing whether such relations exist. In all of these cases, traditional visualisation through Euler diagrams does not distinguish between the families within a single diagram (unless one imposes extra labelling conventions). In our proposal, the incorporation of colouring to the Euler diagram system enables the indication of membership of a family via the use of colour, which in turn enables the representation of the set based relationships within the different families of sets as well as between these families. Furthermore, when considering dynamic information (for example variations over time in the composition of families of sets), using colouring provides a method of linking together the families of sets within a sequence of diagrams.
3
Set Systems and Colouring
We first recall standard notation for sets and set systems, and then define a general notion of coloured sets, subsets and set systems; the colourings can then be specialised according to the particular domain of application. We also define a method of deriving a colouring for subsets S from a colouring of sets X. Let X be a set; then 2X is the power set of X. A set system on X is a pair (X, S) where S ⊂ 2X is a set of subsets of X (see [2] for instance). Let ∆ ⊂ Z+ denote the set of prime numbers and DIV (x) the set of prime integer divisors of x for x ∈ Z. We assume that ∅ ∈ S for all set systems; this corresponds to the requirement that the “outside zone” is present in the diagrams, so the term set system becomes synonymous with the abstract diagram from [6]. Definition 1. Let X = {x1 , . . . , xn } be a finite set, and let S = {s1 , . . . , sk } ⊂ 2X . Then an X-colouring is a function c : X → Z, and an S-colouring is a function c0 : S → Z. Let c be an X-colouring.QThen the natural extension to subsets of c is c0 : 2X → Z, given by c0 (Σ) = i∈I c(xi ), where ∅ 6= Σ = {xi : 3
i ∈ I} ⊂ 2X , for some finite index set I, and c0 (∅) = 0. A prime colouring on X is an X-colouring such that c(X) ⊂ ∆ and an injective colouring of X is a colouring c which is injective. Taking the natural extension to subsets as a product of set colours, and using distinct prime numbers for the original colourings ensures unique colourings for subsets. Colourings of subsets are reducible if they can be derived as products. Lemma 1. The natural extension to subsets of any injective prime colouring on X is an injective colouring on 2X . Definition 2. Let c be an X-colouring and c0 an S-colouring. Then c extends to c0 (or c0 reduces to c) if c0 is a restriction of the natural extension to subsets of c. Let c0 be an S-colouring. Then c0 is reducible if there exists an X-colouring c such that c0 reduces to c. Lemma 2. Let c0 be an S-colouring on a set X, such that c0 (∅) = 0, and ∀Σ ∈ S, if | Σ |= k then c0 (Σ) is a product of k distinct primes. Then, any injective function div : X → ∆, s.t. ∀Σ ∈ S, xi ∈ Σ ⇔ div(xi ) ∈ DIV (c0 (Σ)) is a prime injective X-colouring that extends to c0 . Proof (sketch). The “if and only if condition” tells us that every subset (member of S) colouring is a prime number which divides the colouring of a set (member of X) if the set is a member of the subset. So every prime number that is used to colour a set that is a member of a subset must also divide the colouring of that subset. Since a subset is coloured by exactly k distinct primes if it has k members, the subset colour is precisely the product of the k primes that colour the corresponding k sets. The previous two Lemmas will allow us to derive various colourings and provide some means of consistency checking later on. To allow for more than one colouring associated to a set system, we will use a vector of colouring functions. Definition 3. Let (X, S) be a set system. A colouring of (X, S) is a vector K = (c1 , . . . , ck ) of functions, with k ≥ 1, where each ci is either an X-colouring or an S-colouring for i ∈ {1, . . . , k}. A set system (X, S) with a colouring K is called a coloured set system, denoted by (X, S, K). Example 1. Let X = {E, F, G, H}, S = {∅, {E}, {F }, {G}, {F, G}, {G, H}}, let c1 : X → Z be defined by c1 (E) = c1 (F ) = c1 (G) = 0 and c(H) = 1, and let c2 : S → Z be defined by c2 (∅) = c2 ({G, H}) = 0, c2 ({E}) = 1, c2 ({F }) = 2, c2 ({G}) = 3 and c2 ({F, G}) = 5. Then c1 is an X-colouring function, c2 is an S-colouring function and (X, S, K) is a coloured set system, where K = (c1 , c2 ).
4
Coloured Euler Diagrams
We provide a basic definition of Euler diagrams, in a manner similar to other works (although we specify the definition in topological terms in order to ensure precision), and introduce the new concept of Coloured Euler Diagrams. 4
Commonly, somewhat restrictive set-ups are adopted, typically consisting of the well-formed diagrams of [6], where a decision procedure is provided to indicate if there is a well-formed concrete diagram realising an abstract diagram and if so to produce a drawing of it. The well-formedness conditions are concrete level constraints imposed on the system, with the intention of reducing human comprehension errors, and so there is validity in trying to preserve them; the conditions for [6] are: curves are simple (i.e. no self-intersection); curves only intersect at a finite number of points (i.e. no concurrent line segments); with at most two curves meeting at any particular point and such that the curves cross transversely at that point (i.e. curves that meet must really cross); no two curves have the same label; and no region of the plane that is inside a set of curves and outside the remaining set of curve is disconnected (no split zones). However, since we wish to consider diagrams that are general enough to allow any set system to be represented (i.e. any abstract model has a visualisation), we cannot use uniquely labelled simple closed curves, as in [6]. Instead, we use unions of simple closed curves (or more precisely, the region bounded by them) to represent the sets of a set system, with labels determining the association. We use the term contour for a set of curves with a label in common, agreeing with the usage in [6] when restricting to well-formed Euler diagrams. In general, any set-up can utilise the proposed conceptual extension of colouring. For example, in [2] some well-formedness conditions are relaxed and the term Euler-like diagrams is adopted for variations such as allowing “holes”. In [16] it is shown that all abstract diagrams for at most eight sets are drawable using such Euler-like diagrams. Recently, a methodology for generating general Euler diagrams has been developed [11], ensuring the production of a diagram, with a heuristic approach to repairing possible breaks in well-formedness. Let C be a simple closed curve in the plane. Then C denotes the closed region of the plane bounded by C (homeomorphic to a disc), int(C) the interior of C, and ext(C) the exterior of C. We say that curves C1 , . . . , Cn are closure-disjoint if C1 ∩ . . . ∩ Cn = ∅; and C2 is closure-contained in C1 if C1 ∩ C2 = C2 . Definition 4. Let Λ be a countable alphabet of labels. Let C = {C1 , . . . , Cn } be a family of curves in the plane with a finite number of points of intersection and l : C → 2Λ a function assigning a set of labels to each curve in C. For λ ∈ Λ, if the set Cλ0 = {Ci ∈ C | λ ∈ l(Ci )} ⊂ C, of the curves with λ as a label, is non-empty then it is called the S contour of λ. Let C 0 = {Cλ0 | λ ∈ Λ} be the set 0 of contours in C. Let L(Cλ ) = Ci ∈C 0 l(Ci ), the set of labels for the curves in λ S Cλ0 , and L(C 0 ) = C 0 ∈C 0 L(Cλ0 ). If {Ci | Ci ∈ Cλ0 } is closure-disjoint, for each λ λ ∈ Λ, then we say that d = (C, l) is an Euler diagram. The maximal connected sets of points of the plane with the curves in C removed are called the minimal regions of d, denoted R(d). Let Y ⊂ C 0 be a set of contours. Let z be the region of the plane inside Y but outside C 0 \ Y. If z is nonempty then it is called a zone: \ \ ext (c) 6= ∅. z= int (c) ∩ c∈Y
c∈C 0 \Y
The set of zones of d is denoted by Z = Z(d). 5
In terms of the interpretation of the diagrams, as usual we have that if two regions determined by two contours do not overlap then the sets represented are disjoint, whilst if the region of one contour E1 is wholly contained in the region of another contour E2 then we have the subset relationship E1 ⊂ E2 .
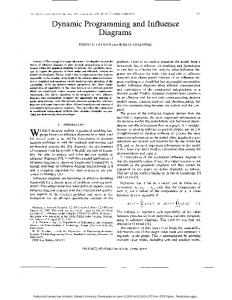
Fig. 1. Examples of coloured Euler diagrams. d1 demonstrates both curve and region colouring; d2 demonstrates the use of multiple labels and curves for set representation.
Example 2. Figure 1 shows two (coloured) Euler diagrams d1 and d2 , where we have drawn a (rectangular) bounding box around each diagram and labelled the diagrams in order to distinguish where one diagram ends and the other begins. In d1 we have four curves, each with one label (E, F , G, and H), which are all therefore contours; in fact these curves determine a well-formed Euler diagram of [6]. There are six zones in the diagram, described by their set of containing curve labels: ∅, {E}, {F }, {G}, {F, G}, and {G, H}. This diagram realises the set system of Example 1. In terms of set-theoretic relationships we infer: H ⊂ G, E ∩ F = ∅, E ∩ G = ∅, and F ∩ H = ∅. Diagram d2 , with two curves and three contours, realises the set system (X, S), with X = {I, J, K} and S = {∅, {I, K}, {J, K}}. In this complex example X is a set of sets and we label curves with the names of the sets, so that they have a label in common. The contours for I and J coincide with the curves with that label in their label set. Applying a standard interpretation of Euler diagrams, we have that the two regions contained by the two curves represent the sets I ∩ K and J ∩ K. As missing zones represent the empty set, we derive (I ∩ K) ∩ (J ∩ K) = ∅, and so the diagram supports the inference I ∪ J = K. One can observe the trade-off between the complexity of interpretation of these diagrams with multiple curves and labels and the ability to realise any set system. With regard to the extension to colouring we demonstrate two realisations of colouring functions in Example 2: colouring the curves themselves, or utilising textures for diagram regions. For overlapping regions, one could choose independent textures, or some form of meshing of textures from the basic regions, giving a visual indicator of which regions are overlapping, similar to that in [12]. The formal definition of an instantiation function from the abstract colouring functions to such graphical attributes is omitted here for simplicity. Before we 6
give the definition of colouring, we provide some consistency conditions: firstly, if any two curves with the same label set have the same colour, and there is a colouring of contours that induces this colouring on curves then we have curvecontour colour consistency; secondly, if a colouring of minimal regions can be induced from a colouring on zones which in turn can be induced by a colouring of contours then we have region-contour consistency. Definition 5. Let C be a set of labelled curves, forming a set of contours C 0 and let c be a colouring on C s.t. ∀Ci , Cj ∈ C, we have l(Ci ) = l(Cj ) ⇒ c(Ci ) = c(Cj ). 0 Then l(C) ⊂ 2L(C ) and c defines a colouring c1 : l(C) → Z. If c1 is reducible to a L(C 0 )-colouring then we have curve-contour colour consistency. Let R be the set of minimal regions defined by C, and suppose that c00 is a colouring of R. If c00 satisfies the properties that: (i) every minimal region of any zone z has the same image under c00 ; (ii) the Z-colouring determined by c00 is reducible to a C 0 colouring, then we have region-contour colour consistency. Remark 1. If all contours have unique single labels, then a 1-1 correspondence exists between contour labels and contours, and since every curve with the same label set has the same colour, also between curve label sets and curves. In this case colourings of L(C 0 ) and C 0 are equivalent, as well as those of l(C) and of C. Definition 6. Let d = (C, l) be an Euler diagram and R its set of minimal regions. A function c : C → Z is called a C-colouring function and a function c : R → Z is called an R-colouring function. A colouring of d = (C, l) is a vector K = (c1 , . . . , ck ) with k ≥ 1, and each ci either a C-colouring function or an R-colouring function. An Euler diagram d = (C, l) with a colouring K is called a coloured Euler diagram (abbreviated CED), denoted (C, l, K), if each component of K satisfies either curve-contour colour consistency or region-contour colour consistency, according to its domain being C or R, respectively. The consistency relationships ensure that we have colouring functions on the set of contours and zones of the diagram, which therefore give rise to colouring functions on the underlying set system that the diagram is representing. Example 3. From Figure 1, in terms of colouring, d1 has a 2-component colouring vector K = (c1 , c2 ), the same as for the set system in Example 1, where c1 is realised by border colouring (with correspondences 0 ←→ solid, and 1 ←→ dashed) and c2 is realised by region texturing. The diagram d2 , with two curves and three contours, is equipped with a 1-component R-colouring function c1 : R → Z such that c1 (∅) = 0, c1 ({I, K}) = 1, and c1 ({J, K}) = 2, realised using textures. We relate the notions of coloured set system and concrete coloured Euler diagram, and show that any coloured set system can be realised by a concrete coloured Euler diagram. Diagram d2 from Example 2 shows an example of an application of the proof strategy. Notice that consistency amongst colouring on curves and contours is incorporated into the definition of CEDs, whilst consistency between sets and contours is incorporated in the definition of realisation. 7
Definition 7. Let (X, S) be a set system. Then an Euler diagram d = (C, l) is a realisation of (X, S) if there is a bijection b : X ↔ C 0 which induces a bijection bs : S ↔ Z(d). Also, (X, S) is called the abstraction of d = (C, l). Let (d = C, l, K 0 ) be a CED and (X, S, K) a coloured set system, such that (C, l) is a realisation of (X, S). Then we say that K 0 realises the colouring K of (X, S), if ∃k ∈ Z+ , | K |=| K 0 |= k and the bijection b respects the colouring vectors: ∀i ∈ {1, . . . , k} ci (x) = y ⇔ c0i (b(x)) = y, for x ∈ X, and c0i (s) = y ⇔ ci (bs (s)) = y, for s ∈ S (according to ci ’s being a contour or a region colouring). We call (C, l, K 0 ) a realisation of (X, S, K) and (X, S, K) the abstraction of (C, l, K 0 ). In order to realise coloured set systems, and to reduce the amount of information needed to define a consistent colouring, we show how to induce colourings on curves and regions from contours in a diagram by: colouring curves with the product of the colours of the contours the curve belongs to; inducing region colouring from contour colouring via the zone colouring obtained as a natural extension to subsets. Definition 8. Let d = (C, l) be an Euler diagram and let c : C 0 (d) → Z be a colouring of the contour Qset of d. Then the induced curve colouring cc : C(d) → Z is given by: cc (C) = {C 0 ∈C 0 (d)|C∈C 0 } c(C 0 ) for C ∈ C(d), whilst the induced region colouring cr : R(d) → Z is obtained from the extension of c to zones by setting every minimal region’s colour to be the colour of the zone containing it. Remark 2. In the following proof, and later on, we make use of the important notion of induced colourings: a set colouring (i.e an X-colouring) gives rise to a colouring of contours from which we can induce a colouring of curves, or in fact a colouring of zones, and hence minimal regions. If all of the colourings of a diagram are induced from contour colourings, then this ensures the consistency of all relations required for the diagram to be a CED; i.e. an Euler diagram d = (C, l) together with a vector of induced colouring functions is a CED. Theorem 1. (i) Let d = (C, l) be an Euler diagram realising a set system (X, S) and let c be an X-colouring. Then c gives rise to a colouring of contours, via the bijection of the realisation, which induces a curve or region colouring of d. (ii)Any coloured set system (X, S, K) can be realised as a CED d = (C, l, K). Proof. The first part follows from definitions. For the second part, we first show that any set system can be realised. For every x ∈ S \ ∅, take one curve3 labelled by x. This yields a Euler diagram d = (C, l) with the correct zone set. Map the S-colourings of (X, S) to R-colourings of (C, l), using the Z-colouring determined by S and the same colour for the set of minimal regions comprising a zone. Map the X-colourings to colourings of C 0 , the contours of d, updating the colourings of curves with multiple labels (i.e. take the induced colouring on curves). 3
The construction is uniform whether S is a set of distinct elements, or a set of sets. In the first case we consider each element as a singleton containing exactly it.
8
For families of sets depicted in a sequence of diagrams, as a sequence of contours, we define a contour sequence, tracking a set through a sequence of diagrams, and a colouring respects this contour sequence if it is consistent across the sequence. Extending to a family of these sequences gives rise to the Y ∗ respectful sequences, covering a sequence of diagrams if every contour appears in the Y ∗ -respectful sequence. Definition 9. Let D = (d1 , . . . , dn ), with dh = (Ch , lh ), be a sequence of Euler diagrams. For each dh , Ch0 is its contour set and (Xh , Sh ) its set system abstraction. Let Y = (Y1 , . . . , Yn ) be a sequence of elements4 , with Yi ∈ Xi , for i ∈ {1, . . . , n}. Then C 0 (Y), the contour sequence of Y, is the sequence (CY0 1 , . . . , CY0 n ) of contours in D s.t. CY0 i corresponds to Yi under the bijection of the realisation. Let C 0 (Y) denote the set of contours in the sequence. Let each dh be coloured by a colouring K h . If CY0 j , CY0 k ∈ C 0 (Y) ⇒ K j (CY0 j ) = K k (CY0 k ), then we say that the colourings respect the contour-sequence C 0 (Y). Let Y ∗ = {Y1 , . . . , Yk } be a collection of k contour sequences. If the colourings respect the contour sequence of Yi for all i ∈ {1, . . . , k}, then we say that the sequence of CEDs D0 = (d01 , . . . , d0n ), with d0h = (Ch , lh , K h ), is a Y ∗ -respectful CED seSk Sn quence. If j=1 C 0 (Yj ) = i=1 C 0 (di ) then we say that Y ∗ covers D. Theorem 2. Let D = (d1 , . . . , dn ), with dh = (Ch , lh ), be a sequence of Euler diagrams, such that (Xh , Sh ) is the set system abstraction of dh . Let F ∗ = {F1 , . . . , Fk } be a collection of families of sets, such that each Fi defines a contour sequence of D, and F ∗ covers D. Then there is a colouring function that makes D = (d1 , . . . , dn ) into a F ∗ -respectful CED sequence. Proof. Assign a unique prime colour to each family Fi , thereby assigning a colour to the contour sequence for that family. Then take the colourings in each diagram dh of the CED sequence to be those induced from the contour colourings. This yields an F ∗ -respectful CED sequence, as required.
5
Representing Reaction Systems with CEDs
In this Section we propose the use of CEDs to represent some significant notions from the recently proposed computational model of Reaction Systems [5, 4]. A Reaction System (rs) is an ordered pair A = (X, A), where X is a finite (background) set, and A is a finite set of reactions of the form a = (Ra , Ia , Pa ), s.t. Ra , Ia , Pa ⊆ X for each a ∈ A. Ra is called the set of reactants, Ia of inhibitors, and Pa of products. A reaction a is enabled in a state T if Ra ⊆ T and Ia ∩T = ∅. If a is enabled in T , then Pa is produced as the new state, replacing T , denoted A by resA (T ) = Pa , or T → Pa ; otherwise the result of applying a to T is the empty set. Note that a can be enabled only if Ra ∩ Ia = ∅. 4
Note that the Xh are the set of elements of the set system, but these elements Yi are themselves sets in the applications and we consider them as such here. Of course, there is a natural map from elements to singleton sets that can be utilised if required.
9
Figure 2 shows an informal graphical representation of a set of reaction rules on background set X = {1, 2, 3, 4, 5}, as a respectful CED sequence for the family {R, I, P }, augmented with information of set membership. Here we provide a legend on the left of the figures indicating the colour coding.
Fig. 2. Four reaction rules a1 , . . . , a4 on a background set X. For example, as Ra1 = {1}, Ia1 = {2} and Pa1 = {2}, in a state containing 1 but not 2, rule a1 produces 2.
These notions are immediately extended to sets: given a set A, enA (T ) ⊂ A is the set of reactions from A enabled S in T . The effect of applying A to T is then the cumulative effect resA (T ) = a∈enA (T ) Pa . For simplicity, we consider here only self-sustaining processes, i.e. without any contribution from the environment. Hence, we identify the evolution of the process with the sequence of states produced by the rs. A process π is characterised by a finite sequence sts(π) = (W0 , . . . , Wn ), s.t. for 0 < i ≤ n, Wi ⊆ X, Wi = resA (Wi−1 ). An extended reaction system (or ers) is an ordered pair E = (A, R), where A = (X, A) is an rs, and R ⊂ 2X × 2X . R is a restriction relation s.t. in the sequence (W0 , . . . , Wn ) each pair (Wi , Wi+1 ) ∈ R. E is also denoted (X, A, R). Let E = (X, A, R) be an ers, W = (W0 , . . . , Wn ) a finite sequence of states for some process in E, and ω = (Qi , . . . , Qj ) a sequence of sets s.t. Qi ⊂ Wi , . . . , Qj ⊂ Wj and Qi = resA (Qi−1 ), for 0 < i ≤ j ≤ n (see Figure 3). Under some technical conditions (see [4]), ω is called an event and each Qi a module of ω in Wi . A snapshot Sk of ω at step k is the set of modules of Wk . Respectful CED sequences with induced colourings provide an immediate representation of modules. We state here the required properties of the sequences, and claim that explicit constructions exist (not shown here due to lack of space), using prime injective colourings and the notion of inducing to generate them. Definition 10. Let ω = (Qi , . . . , Qj ) be an event of E with W the corresponding sequence of states. Let D = (d0 , . . . , dj−i ) be a finite sequence of CEDs, s.t. each dh , with 0 ≤ h ≤ j − i, is a realisation of ({Wi+h , Qi+h }, T, K h ) for some colouring K h , T ⊂ 2{Wi+h ,Qi+h } , and the curves for the contours Q0i+h 0 are closure-contained in the curves for the contours Wi+h , with curves identified if the corresponding sets are equal. We call D a representation of ω if the two resulting contour sequences W 0 , Q0 ∈ C 0 (D) are such that Y ∗ = {W 0 , Q0 } covers D, and D is a Y ∗ -respectful CED sequence. 10
Remark 3. Here, and in the following, when constructing CED sequences, the curve and region colourings are induced from the contour colourings. So, if some of the Qi and Wi are equal (so their curves coincide) the curve colouring used is obtained from the contour colourings (taking the product of the colours of the contours). We also use different types of colouring (curve versus region) to indicate the different types of families (states versus modules).
Fig. 3. A graphical representation of states (Wi ) and modules (Qi ) using CEDs; here each subsequent diagram represents a single evolution of the system.
Events can merge in one state and must remain merged thereafter. Let ω and ω 1 be two events of E. We say that ω merges ω 1 in Wi if Qi is a module of ω in Wi , Q1i a module of ω 1 in Wi and Qi ⊆ Q1i . Then ω and ω 1 remain merged as both processes evolve through Wi+1 , Wi+2 , . . . , Wj , i.e. Qk ⊂ Q1k for all k ∈ {i, . . . , j}. We provide a CED characterisation of merging as follows, from which the representation in Figure 4 derives. Definition 11. Let ω, D, W, Q, W 0 , Q0 be as in Definition 10 and ω 1 another event on the same W, with a corresponding family of modules Q1 . Then we say that a sequence of diagrams D2 is a representation for the merging of ω and ω 1 iff: 1) there exists a sequence of diagrams D1 which is a representation of ω 1 s.t. the families of contours W 0 and W 01 coincide in D and D1 , with distinct colourings for contours in Q0 and Q01 and same colourings for W. 2) There exists an operation ∗ which combines pairs of the diagrams, in sequential order, preserving contours and contour colourings, and which merges curves which represent the same set, s.t. D2 = D ∗ D1 . 3) D2 is a respectful sequence of diagrams for Y ∗ = {W 0 , Q0 , Q01 }. 4) Y ∗ covers D2 .
Fig. 4. A representation of the merging of events showing two sequences of modules Qi and Q0i with the same set of states Wi .
A further refinement considers a set Q which is a module for different states Wk , Wl1 from two state sequences τ and τ 1 . If Wk ⊆ Wl1 , then the successor of Q 11
in τ 1 (i.e. the module obtained from Q by the application of the set of reactions) is a subset of the successor of Q in τ . We define a colouring scheme for combining diagrams which represent different state sequences in the same ers. Definition 12. Let ω, ω1 be two events from sequences of states W and W 1 , with families of modules Q and Q1 . A sequence D2 is a representation for common events iff: 1) There exist two sequences of CEDs D and D1 which are representations for ω and ω1 , respectively. 2) All colourings for contours in Q0 , Q01 , W 0 , W 01 are distinct. 3) D2 = D ∗ D1 , with ∗ as in Definition 11. 4) D2 is a respectful CED sequence for Y ∗ = {W 0 , W 01 , Q0 , Q01 }. 5) Y ∗ covers D2 In Figure 5, curve colouring (dashed versus non-dashed) distinguishes the Wi states and texture (horizontal vs. vertical lines) distinguishes modules. The colour for the common module is different from those of the states and of the other modules, and is shown by combining the colourings for the different events.
Fig. 5. Representing common events: Q and Q0 are modules for W and W 0 resp.
In [4], it is shown that each snapshot in a sequence of snapshots is a partial order, with top and bottom elements. A fundamental property of snapshots is that, given two consecutive snapshots Sk , Sk+1 and F, G two families of subsets in Sk , if F is embedded in G, and each module in F and G has a successor in Sk+1 , then F 0 is separated from G 0 in Sk+1 , as shown in Figure 6.
Fig. 6. From embedding to separation. Left: Sk with F , dashed, embedded in G, bold. Right: Sk+1 with F separated from G by the dotted curve.
6
Information Structure Visualisations
We describe some information structure visualisations and indicate how CEDs could be used in their place. A basic structure is a hierarchy, modeled as a rooted, 12
directed tree. Viewing how a single hierarchy changes over time is an important task in some domains (e.g. the TimeTube visualization uses Disk Trees to represent the evolution of the web ecology [1]). Placing hierarchies next to each other and connecting common nodes with lines was a method used to visualise taxonomies in [7]. Multiple intersecting hierarchies that share common nodes have been called Polyarchies [10]. Visualization techniques include the visual pivot, which shows how hierarchies relate to each other in the context of various entities: the specified entities are highlighted, the new hierarchy appears and rotates into place and the old hierarchy rotates out of place and fades away, leaving the new hierarchy, with the user being shown the transition. A stacked link view is also adopted, showing multiple hierarchies with lines linking the common nodes (an example is shown on the left of Figure 7). This enables a similar animation for viewing several related hierarchies, which preserves the previous view. In [9], Polyarchies are viewed as edge coloured multigraphs, effectively considering them as the union of rooted trees, each corresponding to a single hierarchy. CEDs can be used to represent hierarchies: a stacked link view can be represented as a sequence of CEDs with colour indicating commonality arising from the common nodes of the hierarchies; this then extends to a visualisation using a CED sequence instead of a Polyarchy in stacked link view. Definition 13. Let T = (V, E, r) be a tree, with vertex set V and directed edge set E, rooted at r ∈ V . E t is the transitive closure of E. Let dT be an Euler diagram with contour set C 0 and one curve for each contour, s.t. there is a bijection b : V → C 0 for which (v1 , v2 ) ∈ E t iff the curve for b(v1 ) is contained in the interior of the curve for b(v2 ). Then dT , together with any C-colouring function c assigning the same value to all curves, is a coloured Euler diagram of T .
Fig. 7. Left: A polyarchy, consisting of two hierarchies T1 and T2 joined by lines indicating nodes in common (i.e. this is a stacked link view of T1 and T2 ). Middle: A pair of coloured Euler diagrams d1 and d2 , each one representing the corresponding hierarchy with the colour (dotted curves) indicating the nodes in common. Right: A single combined diagram d3 representing the polyarchy.
Definition 14. Let T1 and T2 be rooted trees with a set of vertices V = V (T1 )∩ V (T2 ) in common. Then G(T1 , T2 ), the stacked link view of T1 and T2 , is the partially directed graph T1 t T2 together with an undirected edge set between the pairs of vertices in T1 and T2 in common. A visualisation of the stacked link view of T1 and T2 is a CED sequence d1 , d2 such that d1 and d2 are coloured Euler diagrams for T1 and T2 respectively, using one same colour c for the nodes in V , and not using c for any node in the symmetrical difference (V (T1 ) ∪ V (T2 )) \ V . 13
Lemma 3. Let dT1 and dT2 be the CEDs of T1 and T2 respectively, with the Ti as in Definition 14 Let nodes in T1 be coloured with a1 and those in T2 with a2 , a1 and a2 being distinct prime integers. Let d1 be dT1 with colouring altered so that the colour of curves of vertices in V is a1 ∗ a2 whilst those not in V are coloured a1 ; similarly, d2 is dT2 except that the colour of curves of vertices in V is a1 ∗ a2 . Then the coloured CED sequence dG = (d1 , d2 ) of G(T1 , T2 ) is a visualisation of the stacked link view of T1 and T2 . Example 4. Figure 7 shows a polyarchy consisting of two hierarchies T1 and T2 joined by lines indicating shared nodes. We have augmented the usual representation of trees with a form of colouring, using shapes [square or circle] to represent nodes from each hierarchy, and an overlapping square and circle to represent nodes in common. The respectful CED sequence which is the visualisation of the stacked link view of T1 and T2 is shown in the middle of the figure as d1 and d2 . The right hand side of Figure 7 shows d3 , an example of the combination of the two diagrams d1 and d2 , which offers a potential opportunity to reduce the length of diagram sequences, when it is possible. Theorem 3. Let P be any polyarchy consisting of multiple trees in a stacked link view. Then there is a coloured Euler diagram sequence visualising P . Proof (sketch). Let T1 , . . . , Tn denote the n hierarchies of the polyarchy. For each Ti define an ED as usual. Assign a unique prime colour pi to each Ti . For a node n common to exactly the hierarchies Tn1 , . . . , Tnj , assign to n the colour pn1 ∗ . . . ∗ pnj . Then each node of any Ti corresponds to a contour of the CED, and if the node is shared amongst hierarchies, the corresponding contours in each diagram have the same colour.
7
Conclusion
We have extended the notion of Euler diagrams to incorporate colourings, providing extra dimensions for representing various domain features, and demonstrated their applicability as visualisations of concepts in two different domains: Reaction Systems and Information Structure visualisations. We draw representations of coloured Euler diagrams where the colouring functions are instantiated by graphical attributes such as actual colour, texture, dashedness, etc, and the choice of such instantiations can be important in terms of human perception and understanding, but they have a common encoding in a mathematical sense. Colouring functions can be applied to alternative Euler based diagram systems. Colouring is applied to set systems and diagrams and we have shown that any coloured set system can be realised as a coloured Euler diagram using the set-up in this paper. Also, we have presented methods to induce colourings of curves and regions from a given specification of colourings on sets. One extra benefit of this is to reduce the amount of information required for such colouring specifications which may prove useful in implemented systems. Possible directions for future work include: integration of colouring in logical systems, either to assist human readers in comprehension of logical steps 14
involving conjunction of two diagrams, or to allow representation of attributes; extending the representation devised for polyarchies to representation of hypergraphs; representation of clusters, highlighting their changes over time along a sequence of diagrams. On the theoretical side, we plan to extend the proposal with notions of diagram combination and matching.
References 1. Ed H. Chi, James Pitkow, Jock Mackinlay, Peter Pirolli, Rich Gossweiler, and Stuart K. Card. Visualizing the evolution of web ecologies. In Proc. CHI ’98, pages 400–407. ACM Press/Addison-Wesley, 1998. 2. Stirling C. Chow. Generating and Drawing Area-Proportional Euler and Venn Diagrams. PhD thesis, University of Victoria, 2007. 3. R. De Chiara, U. Erra, and V. Scarano. VennFS: A Venn diagram file manager. In Proc. InfoVis 2003, pages 120–126. IEEE Computer Society, 2003. 4. Andrzej Ehrenfeucht and Grzegorz Rozenberg. Events and modules in reaction systems. Theoretical Computer Science, 376(1-2):3–16, 2007. 5. Andrzej Ehrenfeucht and Grzegorz Rozenberg. Reaction systems. Fundamenta Informaticae, 75(1-4):263–280, 2007. 6. J. Flower, A. Fish, and J. Howse. Euler diagram generation. Journal of Visual Languages and Computing, 19:675–694, 2008. 7. Martin Graham and Jessie Kennedy. Extending taxonomic visualisation to incorporate synonymy and structural markers. Inform. Visualiz., 4(3):206–223, 2005. 8. H. Kestler, A. Muller, T. Gress, and M. Buchholz. Generalized Venn diagrams: A new method for visualizing complex genetic set relations. Journal of Bioinformatics, 21(8):1592–1595, 2005. 9. M.J. McGuffin and M.C. Schraefel. A comparison of hyperstructures: Zzstructures, mspaces, and polyarchies. In Proc. 15th ACM Hypertext and Hypermedia, pages 153–162. ACM Press, 2004. 10. George Robertson, Kim Cameron, Mary Czerwinski, and Daniel Robbins. Polyarchy visualization: Visualizing multiple intersecting hierarchies. In Proc. ACM SIGCHI, pages 423–430. ACM Press, 2002. 11. P. Rodgers, L. Zhang, and A. Fish. General euler diagram generation. In Proc. Diagrams 2008, volume 5223 of LNAI, pages 13–27. Springer, 2008. 12. Paolo Simonetto, David Auber, and Daniel Archambaul. Fully automatic visualisation of overlapping sets. Computer Graphics Forum, 28:967–974, 2009. 13. G. Stapleton, J. Masthoff, J. Flower, A. Fish, and J. Southern. Automated theorem proving in Euler diagrams systems. J. of Autom. Reas., 39(4):431–470, 2007. 14. N. Swoboda and G. Allwein. Using DAG transformations to verify Euler/Venn homogeneous and Euler/Venn FOL heterogeneous rules of inference. Software and System Modeling, 3(2):136–149, 2004. 15. J. Thi`evre, M. Viaud, and A. Verroust-Blondet. Using euler diagrams in traditional library environments. In Proc. Euler Diagrams 2004, volume 134 of ENTCS, pages 189–202, 2005. 16. A. Verroust and M.-L. Viaud. Ensuring the drawability of Euler diagrams for up to eight sets. In Proc. Diagrams 2004, volume 2980 of LNAI, pages 128–141, Cambridge, UK, 2004. Springer.
15