Biohouse, Volume 2: Issue 5, Sept-Oct 2016
Biohouse Journal of Computer Science
ISSN 2379-1500
Combination of Microsoft Access and Microsoft Excel BI features to develop Sephora Store Decision Support System AL-Wehaibi, Rehab Nasser
AL-Otaibi, Awatif Khalid
Khan, Muhammad Badruddin
Al-Imam Mohammad ibn Saud Islamic King Khalid University Al-Imam Mohammad ibn Saud Islamic University
[email protected] University
[email protected] [email protected] Abstract: Business Intelligent (BI) application became the backbone for most of profitable organizations systems. It is provide ability to analyze data, help in forecasting and predicting the trend and preferences of the market alert organization to save the cost and to utilize the resource. Sephora Stores specialized in buying the different product for varying brands. These stores have large data in their data warehouse can get benefits from these data for increase the sales , customer loyalty and quality services .By utilize these data the manager can make appropriate decision and predict the future. We decide to create BI application to provide a clear vision for Sephora manager to invest in right way. Using Excel 2016 features to provide OLAP operations, data visualization and data mining and Microsoft Access to create star schema, fact table with their dimensions and appropriate queries .also we used Visual Basic Application (VBA) for data mining
Keywords: Business Intelligent ,data warehouse , Online Analytical Processing , data visualization , Key Performance Indicators , data mining , star schema and fact table I. INTRODUCTION Excel 2016 has features business intelligence capabilities to processing and analyze data. It provides reports, scorecards, and dashboards by importing data into Excel to create reports and scorecards then the appearing of the result depending on the filtering choices. Our application creates reports which PivotChart reports and PivotTable reports to display needed data by using Microsoft Access data sources. In addition, Create reports Power View tables can be change the result by filtering data that we choose from imported data. We create Key Performance Indicators (KPIs) defined in Power Pivot to by using calculated field to calculate the ratio of total cost. Dashboard capability compare between the each data belong the dimensions relay on the measures, by import data from Microsoft Access data sources, using Slicers have ability to change the interface result to provide dynamic screen. In addition, Power View in Excel 2016 has the add-ins tool to visualize data by create maps from Microsoft Access data sources and uses Bing maps for the sales for each branches [1]. Also, by using VBA code to establish the rules for data mining calculating the support that equal to 50% and confidence that equal to 80% for the rule between the bags and shoes which we found it accepted because its exceed the 50% for both. Using Microsoft Access to create star schema that have fact table for the sales has the measures ( cost, quantity, sales , profits, and gross profit margin)and the primary keys for each dimension table .In Microsoft Access also create the queries used for the excel 2016 features BI as data source like this query SELECT Dim_Branch.B_name, Dim_product.category, Dim_product.brand_name, Dim_Date.date_key, Dim_Date.Quarter, Dim_Date.Year FROM Dim_Date INNER JOIN ((Dim_Branch INNER JOIN Dim_product ON Dim_Branch.B_ID = Dim_product.B_ID) INNER JOIN Sales_fact ON (Dim_Branch.B_ID = Sales_fact.B_ID) AND (Dim_product.P_ID = Sales_fact.P_ID)) ON Dim_Date.date_key = Sales_fact.date_key
GROUP BY Dim_Branch.B_name, Dim_product.category, Dim_product.brand_name, Dim_Date.date_key, Dim_Date.Quarter, Dim_Date.Year; Created to feed sales by quarter report. By observing SAP HANA for understanding BI, it has ability to perform their intelligent interface at one screen; their data are bringing to provide Real-time decisionmaking. It has ability to integrate data from any external data to analyze these data; report and processing to provide intelligent data use it to support decision-making and their strategies. [2] By entering to the Market Basket Analysis website we learned how we could discovered all possible association rules from the fact table and relational database. Also it is a useful source to know a good way for build the binary table and calculate confidence and support values for each association rules then decide if those rules are accepted or rejected [3]. II. LITERATURE SURVEY BI begun within the industrial field in the early 90’s, trying to digitize all the operational work. In the mid-90’s BI, the academics started to make researches on BI, and after spending ten years, they found techniques for information extraction and processing and the operations of OLAP, multidimensional modeling, design methodologies, optimization and indexing techniques. Nowadays, the management needs to monitor their performance and productivities through (KPIs) and scorecards. [4] Development Path of Business Intelligence went through many stages. First Stage – The ability to collect, clean, integrate, and store data by the extraction, transformation, and loading (ETL). Second Stage – The ability to analyze and report on the stored data in real time and in decade and half before was impossible Third Stage – They able automatically to act on the intelligence generated from the environment. [5] Nine research designs for with BI techniques: [6]
__________________________________________________________________________________________________________________________________ Biohouse Publication Group Inc (US) International Journal Series 42783 Macauley Place, Ashburn, All Rights Reserved © Biohouse BJCS 2014-16 VA 20148, USA, Web: www.biohouse.us ISSN 2379-1500 1
AL-Wehaibi, Rehab Nasser et al, Biohouse Journal of Computer Science, 2(5), Sept–Oct, 2016
Table 1 research designs techniques
Business Intelligence (BI) is the new technology for correcting mistakes in the past, predicting for better future. BI allows gathering, storing, accessing & analyzing data to help business users make better decisions and monitor business performance. [7] Business Intelligence is the art of can answer the important questions for the manager to improve their sales and performance [8]. Business Intelligence component are [9]: Data Warehouse: It is multidimensional data model stores huge data; it is the fact tables with the measures, which need ETL techniques to implement it. Data Mart: It is a collection of subject areas serve specific department or group for example, marketing department, which focus on the sales information. OLAP (On-line analytical processing): Online Analytical Processing or OLAP provides multidimensional, summarized or details reports representing in each data cuboids. Data Mining: Gaining knowledge by discovers hidden patterns for Forecasting or predicting trends or preferences Business Performance Management: Defined as a set of processes or methodologies to observe the business performance by integration with some or all of KPI, Scorecards, and Dashboards. Dashboards: The process of presenting data with graphical graphs, tables and charts comparing the performance with actual situations. [10] Key performance indicators (KPI): The processes analyzing data to indicate and inform about the sustainability of the organization by linked to their strategy. [11] Scorecards: A tool that helps strategic management to follow the four standard prospective, which is the financial, customer, internal processes and learning and growth. [12] As student, we faced obstacles to implement this kind of application regarding to the limitation of BI software for learning purpose. We found a lot of software serve the Complex companies or organization even the interface were had a clear vision but reaching the integrated tools and the absence of learning source was difficult. Another point, it is difficult to gain data from third party to build the data source for the application. We found some limitations and defects of their data and provide statistics reports need to reorganized and cleaned.
III. PROJECT DESCRITION The project is about design a business intelligence system (BI) for Sephora Stores in Saudi Arabia. This system solved many problems that occurred with managers of Sephora branches. Managers want to analyze sales, profits, costs and other things related to financial assets. Before they faced many challenges when they want to know some, financial issues many sales that gains from a specific category (Bags, Shoes, Earnings .etc.). Which brand name that much costly. By using this BI system, we try to solve many of these challenges and put some other features that assist managers in Sephora Stores to efficiently analyze data and gain a useful information, which leads for make much valuable strategies in the future. Such as, which branch for Sephora Stores that have a large amount of profit? By using OLAP operations such as (rollup, drill-down and dice). In addition, we use queries by using Access 2016 to obtain analysis results from dimensions tables and fill it to the Sales-fact table. Sephora Store BI System built by work through steps based on data warehouse tiers ( data warehouse which is bottom tier , OlAP server which is middle tier and end user tools which is upper tier) [13] to design complete intelligent DSS supported by BI tools. Those steps are discuses in details below:First step for this design is to build a data warehouse that contains integrated, valuable, consistent and cleaned data, which those data we collected from the historical relational Sephora Store database that contains a huge number of data we can used it in a valuable form that support these stores in analysis and predict the future. This work is along a data warehouse server in a bottom tier. Second step is on LOAP server in the middle tier, which is design a star schema model as ROLAP server, and make a fact table that called Sales-fact contains six measures (quantity, order-riyals, profit, cost, GrosProfitMargin and customer-satisfaction). In addition, there are fourdimensional tables that (Dim-Branch, Dim-Date, DimProduct, Dim-Customer and Dim-Employee) which each dimensional table has variety important attributes. We make calculations by using OLAP operations such as (roll-up, drill-down and dice). In addition, we use queries by using Access 2016 to obtain analysis results from dimensions tables and fill it to the Sales-fact table. Third step that is import all tables that resulting from queries in the previous step to the Excel 2016 for make a useful analysis by using some tools in this program such as (Pivot chart and reports, Bing map and scorecard). This step is in the top tier, which is front-end tools. In this tier, we represent the analytical results by graphs, reports, dynamic dashboard, map and KPIs signs. This step shows the results for Sephora Stores manager in friendly, easy and interact user interface to allow managers an easy visualization for analytical data. Fourth step is make a data mining to discover all possible association rules from data base to facilitate make the better market strategies by Sephora Stores manager. By filling a binary table from database to know the relationships between categories and brand names, calculate the confidence, and support for each association rule, which is a descriptive model. The calculation was done by using VBA
__________________________________________________________________________________________________________________________________ Biohouse Publication Group Inc (US) International Journal Series 42783 Macauley Place, Ashburn, All Rights Reserved © Biohouse BJCS 2014-16 VA 20148, USA, Web: www.biohouse.us ISSN 2379-1500 2
AL-Wehaibi, Rehab Nasser et al, Biohouse Journal of Computer Science, 2(5), Sept–Oct, 2016
code that show the calculation results to manager in the Data Mining interface and write which rules will accept and which others are reject based on confidence and support values. In addition, creating VBA code allowed the manager to take his decision under certainty, risk and uncertainty situations. Shows which brand name (Chanel, Dior and Fiendy) are the best for investment based on the products categories (Bags, Shoes, Earnings) .this code takes the data from table that resulted by query in Access 2016 program and imported into Excel 2016 to start DSS program. IV. WORTH OF PROJECT This project obtained different worth for Sephora Stores managers and customers. By using this BI system, the manager can see sales and all relevant financial issues easily and clearly. In addition, this system will assist manager to discover different rules that can allow them to make good future strategies. Therefore, Sephora Stores manager use this intelligent system to gain two basic kinds of worth, which are tangible and intangible worth's. Some Tangible Worth : Present information about a specific branch, quarter, and brand name... etc. sales fact. Show comparing between profit and cost among different categories and brand names in each Sephora branches. Display the products quantity that sold in each Sephora branch and based on any quarter or year that manager choice. Design a dynamic dashboard that allow manage to see graph about any attributes he choose from different dimension tables. Present how many riyals incomes from any specific branch, category, brand name and (or) quarters. Show KPIs for measure cost ratio that alert manager by which product or branch leads large cost for a specific quarter or year(s). Determine manager by what is the best brand name can invest in according to the product category and previous historical data and information about sales that save a lot of manager time and effort with take an ensure result decision from VBA code that embedded with this intelligent system. This intelligent system can decide which association rules will accept or reject based on the calculation results from data mining VBA code that calculate confidence and support for every association rule. Some Intangible Worth Managers in Sephora Stores can decide a right enough decisions by using this BI system that ensure take the best decisions in efficient ways. Gain the customer loyalty from a great number of Sephora customers' that resulted from best strategies that taken by manager by using this system. This system measure the customer satisfaction for each Sephora Store branch. Analyze customer satisfaction level in each region which can help manager to know which city has a great level of customer satisfaction and why and verse versa.
Help manager to know employees efficient work to easier for manager in asset Sephora Store employees. Improve employees work by inform the manager how employee has a largest number of sales to decide give him extra bonus in order to reward and recognize accomplishments. What type of answers your project can answer: There are a lot of questions can the manager ask and take the answer from this BI system. Some of questions we will list below: How many sales in each Sephora Store branches in all previous years? Which brand name has largest profit? Which branch for Sephora Store has largest customer satisfaction and which one has lowest customer satisfaction? How many riyals returned by different categories in each years? How many sales by quarters in each Sephora Stores branches? How many quantity that sold by months? In addition, there are other questions can be answered by this system, which you can locate in the Excel files for this BI system. Discussion of Dimensions and Measures:
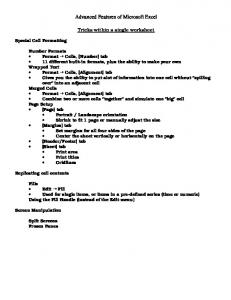
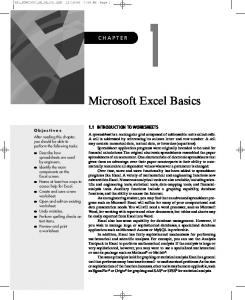
Fig 1. Star Schema Model As you see above in star schema diagram, there are five dimension tables which are (Dim-Date, Dim-Product, DimBranch, Dim-customer and Dim-employee) when each dimension table has several attributes that describe the table and store the data source on these tables as rational database. In addition, we have fact table that called (Sales-fact) which contains the dimension ids and our measure (Quantity, Order-riyals, Cost, Profit, GrosProfitMarg and Customersatisfaction). We use a join index as index type of this BI system. The fact table saves the result of calculations that we calculated by queries in the Access program, such as:Query that return the top five employees that sold products larger than other employees to reconsider accomplishment did:-
__________________________________________________________________________________________________________________________________ Biohouse Publication Group Inc (US) International Journal Series 42783 Macauley Place, Ashburn, All Rights Reserved © Biohouse BJCS 2014-16 VA 20148, USA, Web: www.biohouse.us ISSN 2379-1500 3
AL-Wehaibi, Rehab Nasser et al, Biohouse Journal of Computer Science, 2(5), Sept–Oct, 2016
SELECT DISTINCT ROW TOP 5 Dim_employee.E_name AS MOSTSALESS, Dim_employee.E_ID, Sales_fact.order_riyals FROM Dim_employee INNER JOIN Sales_fact ON Dim_employee.E_ID = Sales_fact.E_ID ORDER BY Sales_fact.order_riyals;
(Total Riyals, profit, cost and number of product sold). Therefore, this utility will assist Sephora branches' manager to show summarize data for each branch.
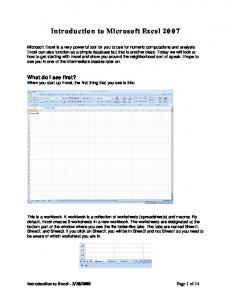
V. IMPLIMENTATION Database design: We design a database as Rational DBMS in data warehouse tier and use ROLAP as a server for this BI system in the middle tier. We choose ROLAP because Sephora Stores have a Rational Database also they have a huge number of data that may take a large space if we use another server type such as MOLAP. Data: We take some of data from Sephora Stores database and we put measures based on some requirement that Sephora Stores manager want to be calculate by electronic system. Data that we had taken from Sephora Stores database is in a raw data format, so we cleaned all data and integrated into one format to be useful and valuable data then stored in data warehouse. After that, we created the fact table in a star schema type. Then we put good measures to provide effective results for the Sephora Stores manager. Dashboards: It is usually one interface easiest to read, their information is in real-time showing a graphical presentation of the current situations and historical trends of an organization’s key performance indicators to enable real-time decision-making. For example, in our project Sephora Store dashboard may show dashboard information related to customers, products, employees and branchs (dimensions) relay on the aggregated sitting measures.
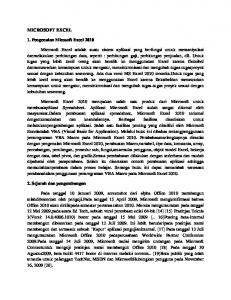
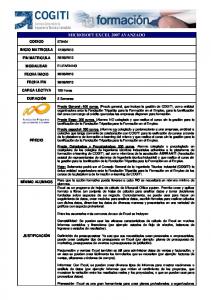
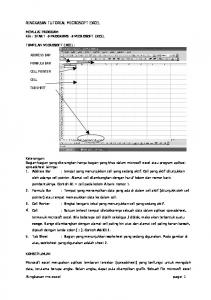
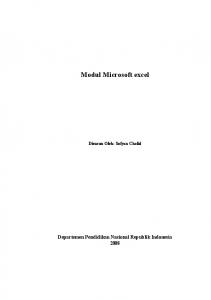
Fig 3. Data Visualization Key performance indicator (KPI): Sephora Store use KPI to evaluate its success. Sometimes success defined in terms of making progress toward strategic goals. Accordingly, choosing the right KPIs relies upon a good understanding of what is important to the organization for example, measuring the cost - KPI for total cost ratio. We calculated the ratio of total cost by divide the sum of cost by sum of sales. We by set the absolute value to one , KPI pointer set from (1 to 85 ) as the green pointer from (85 to 4 ) as yellow pointer from (4 to 0) as red pointer.
Fig 2 Sephora Dashboard Utilities:We made two main utilities tools in this BI System, which areBing map: This utility tool that embedded in the Excel 2016 program allows us to put circles around each Sephora Stores in Saudi Arabia which are (Riyadh, Dammam, Jeddah, AL-Qurayt and Jizan)then each circle will display sales information related to this branch that summarize financial data such as
Fig 4. Ratio KPI for Total Cost Data Mining: The data mining is very important BI tool for discovered some useful rules and to know the customer behavior that facilitate predicts in the future and assist manager to take the best decision in different situations that leads increase the revenue and improve the market policy. "The data warehouse provide managers enterprise with memory but the data
__________________________________________________________________________________________________________________________________ Biohouse Publication Group Inc (US) International Journal Series 42783 Macauley Place, Ashburn, All Rights Reserved © Biohouse BJCS 2014-16 VA 20148, USA, Web: www.biohouse.us ISSN 2379-1500 4
AL-Wehaibi, Rehab Nasser et al, Biohouse Journal of Computer Science, 2(5), Sept–Oct, 2016
mining give them enterprise with intelligence"[13] (H.Jiawei and K.Micheline, 2006). Therefore, we use this technique in the Sephora Stores BI System to improve some its applications such as CRM and targeted marketing. We use the descriptive model for data mining which is quantify measure that based on discover all possible association rules from sales fact table. We followed steps to discovered association rules and decided which an accept rule and which rejected according to confidence and support values in each rule. Those steps are Create a binary table from the sales fact table to discover association rules between product categories in Sephora Stores, which are (Bags, Shoes and Earnings).
In addition, this code will decide which from those rules accepted and which ones rejected based on confidence and support values. The figure below is the interface for the Data Mining window in Sephora Stores BI System
Fig 6. Accepted & Rejected rules for DM VII. CONCLUSION
Fig 5. Binary Fact Table
We created VBA code that calculated the confidence and support for each rule that we discovered. In this case the rules are:-
After the right association rules discovered, the manager can build a marketing strategy according to those rules. There are large number of techniques and strategic can took by manager to improve the market strategy some of those strategic mentioned in book that titled 'Data Mining concept and techniques' [13]. VI. RESULTS
In this case for Sephora Stores project, there are two effective strategies which are: Sephora customers like to buy bags - especially from Chanel brand- and large number of them prefer to buy also Shoes from the same bag brand name. Therefore, Sephora employee should put bags behind shoes that have same brand name that means Chanel bags behind Chanel shoes, Dior bags behind Dior shoes and Fendi bags behind Fendi shoes. By applying this strategy in store arrangement will facilitate each customer to buy shoes when he/she coming to buy bag. Other effective strategy is by put earning between bags and shoes for each brand name. This strategy will increase Earning sales because from analytical information we notice the Earnings have less sales in all Sephora Stores in Saudi Arabia.
The Powerful of Excel 2016 BI features can discover and utilize information systems based on rules and context to support several business processes with the combination of VBA. Also has analytical ability providing OLAP, reports, queries and utilities with combination with Microsoft Access 2016 to get quick results. The paper explained how all these combination help Sephora Store to build their BI and DSS for them REFERENCES [1] http://technet.microsoft.com/en-us/library/jj219751.aspx last accessed [24/5/2013] [2] http://www.saphana.com/community/try last accessed [24/5/2013]. [3] http://people.revoledu.com/kardi/tutorial/MarketBasket/ Last accessed [24/5/2013]. [4] Dr. L prasannakumar D. karun kumar reddy CH. Nagabhushanarao, "After bi: what’s thefuture intelligence?" IJRCCT international journal of research in computer and communication technology, 2012. [5] zeljko panian," Expected Progress in the Field of Business Intelligence", Proceedings of the 8th WSEAS Int. Conf. On Artificial Intelligence, Knowledge Engineering & Data Bases. [6] Wanda Presthus, Bendik Bygstad, "conducting research with business intelligence", 2011. [7] Kurt Schlegel, Rita L. Sallam, Daniel Yuen, Joao Tapadinhas,"Magic Quadrant for Business Intelligence and Analytics Platforms",2013 [8] Greg Nelson ,"Introduction to the SAS® 9 Business Intelligence Platform: A Tutorial ".,ThotWave Technologies, LLC [9] jayanthi ranjan," Business Intelligence: Concepts, Components, Techniques And Benefits", Journal of Theoretical and Applied Information Technology, 2009. [10] Solomon Negash, "Business Intelligence", Communications of the Association for Information Systems (Volume13, 2004). [11] H. ALwaera,*, D.J. Clements-Croome, "Key performance indicators (KPIs) and priority setting in using the multi-attribute approach for assessing sustainable intelligent buildings", 2009 [12] Emanuele de Matos Nasser1 and Stella Regina Reis da Costa, "Implementation of indicators through balanced scorecards in a nutritional therapy company", 2013. [13] H.Jiawei and K.Micheline, "Data Warehouse and OLAP Technology: An Overview," and "Mining Frequent Patterns, Associations, and Correlations 2," in Data Mining concept and techniques, 2nd ed. San Francisco, USA: Diane Cerra, 2006.
__________________________________________________________________________________________________________________________________ Biohouse Publication Group Inc (US) International Journal Series 42783 Macauley Place, Ashburn, All Rights Reserved © Biohouse BJCS 2014-16 VA 20148, USA, Web: www.biohouse.us ISSN 2379-1500 5