REVIEW OF SCIENTIFIC INSTRUMENTS 76, 062207 共2005兲
Combinatorial and high-throughput measurements of the modulus of thin polymer films Christopher M. Stafford,a兲 Shu Guo, Christopher Harrison,b兲 and Martin Y. M. Chiang Polymers Division, National Institute of Standards and Technology, Gaithersburg, Maryland 20899
共Received 15 November 2004; accepted 30 January 2005; published online 18 May 2005兲 We describe the design and refinement of a high-throughput buckling-based metrology for ascertaining the mechanical properties 共e.g., modulus兲 of combinatorial thin polymer film libraries. We provide critical details for the construction of a suitable strain stage, describe sample preparation, and highlight methods for high-throughput data acquisition and data analysis. To illustrate the combinatorial and high-throughput capability of this metrology, we prepare and evaluate films possessing a gradient in the elastic modulus and compare the results with an analytical expression derived from composite beam theory. Application of this metrology is very simple and practically any laboratory, academic or industrial, can perform such measurements with only modest investment in equipment. Although developed as a platform for investigating combinatorial libraries, researchers can take advantage of the high-throughput nature of this metrology to measure noncombinatorial film specimens as well. 关DOI: 10.1063/1.1906085兴 I. INTRODUCTION
Considerable attention has been devoted to developing fabrication strategies for constructing combinatorial material libraries as well as tools for characterizing the chemical properties of such libraries. Less attention has been dedicated to designing high-throughput metrologies for probing the physical or engineering properties of combinatorial libraries. For example, thin polymer films are critical to technological applications such as advanced optics, microelectronics, data storage, and bioengineering.1 The mechanical properties and stability of such ultra-thin 共submicrometer兲 films are paramount to the fabrication, performance, and reliability of devices. For instance, the semiconductor industry uses lithography to pattern nanostructures in polymeric resists, followed by developing and rinsing steps with aqueous solutions to remove unreacted material from in between the nanostructures. These nanostructures, which can be viewed as freestanding thin films with widths of 100 nm down to 10 nm, often collapse during drying due to the large Laplace pressures generated by a liquid meniscus between the walls of the nanostructures.2–4 The design and incorporation of higher modulus materials into the lithography process can improve resistance to collapse and thus circumvent this fabrication issue. In this paper we present a high-throughput metrology that allows researchers to rapidly measure the elastic modulus for hundreds of points across a combinatorial library in a matter of minutes. Several techniques have emerged to measure the mechanical properties of both supported and unsupported polymer thin films, the most prominent being instrumented indentation methods that have been scaled down to the microand nano-indentation regime.5–7 Here, a point load is applied a兲
Author to whom correspondence should be addressed; electronic mail:
[email protected] b兲 Present address: Sensor Physics Department, Schlumberger-Doll Research, Ridgefield, Connecticut 06877. 0034-6748/2005/76共6兲/062207/5/$22.50
to a supported thin film and the load/penetration depth curve is recorded over a complete loading/unloading cycle. From this load/displacement data, the modulus of the thin film can be calculated, although these techniques tend to overestimate the modulus of the film due to contributions and interactions with the underlying substrate. In addition to instrumented indentation, there are surface acoustic/guided wave methods for probing the near-surface mechanical properties of polymer thin films, the primary examples being Brillouin light scattering8,9 and surface acoustic wave spectroscopy.10 Finally, bulge tests11–14 are capable of measuring modulus and residual stress of thin films, but require free standing, or at least partly free standing, films. The membrane is pressurized from one side and the deflection at the center is recorded as function of applied pressure. The pressure-displacement relationship is given using plate theory and finite element analysis, and Young’s modulus can be determined through fitting the experimental data with analytical or numerical solutions. Unfortunately, many of these techniques are not positioned to be applied as high-throughput measurement platforms for submicron polymer films. Recently we reported on a new buckling-based metrology15 that is able to measure the elastic modulus of polymer films mounted on a relatively thick, soft substrate. In this paper, we detail the design and application of this metrology with emphasis on sample preparation, apparatus design, data collection, and image analysis. We demonstrate the combinatorial and high-throughput capacity of this technique with a one-dimensional modulus gradient fabricated by laminating two layers of materials with disparate moduli. II. REVIEW OF RELEVANT BUCKLING MECHANICS
Many researchers have studied the instability of a beam or plate supported by an elastic foundation.16–20 Buckling can occur when a compressive stress is applied to a substrate/ film laminate. In an effort to minimize the total elastic strain
76, 062207-1
Downloaded 24 May 2005 to 129.6.154.144. Redistribution subject to AIP license or copyright, see http://rsi.aip.org/rsi/copyright.jsp
Rev. Sci. Instrum. 76, 062207 共2005兲
Stafford et al.
062207-2
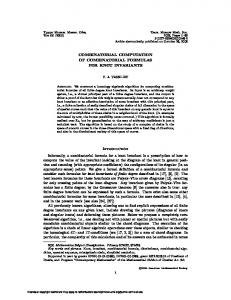
FIG. 2. 共Color online兲 Strain stage design: ① gradient film specimen, ② PDMS substrate, ③ clamps, ④ stationary grip, ⑤ sled grip, ⑥ motorized actuator for controlling displacement, ⑦ mounting plate, ⑧ grooves for locking in strain, and ⑨ window for conducting transmission experiments. FIG. 1. 共Color online兲 Schematics showing 共a兲 plane strain and 共b兲 plane stress conditions for a thin film laminated onto an infinitely thick substrate.
III. EXPERIMENTAL SETUP AND OPERATION
energy of the system, the laminate will have a propensity to buckle if the applied compressive stress/strain exceeds a critical value. The critical stress, c, needed to buckle the laminate is dependent on the material properties of the substrate and film, as shown in the following equations:19
冑 3
c =
Es2E f 9 , 64 共1 − s2兲2共1 − 2f 兲
共1兲
where E is Young’s modulus, and is Poisson’s ratio. Subscripts f and s correspond to the film and substrate, respectively. The wavelength of the buckling instability is given by = 2h
冋
1 − s2 E f 3共1 − 2f 兲 Es
册
1/3
,
共2兲
where h is the thickness of the upper film. Equation 共2兲 can be rearranged to elucidate the dependence of the upper film modulus on the wavelength of the buckles as well as the material properties of both the film and substrate:
Ef =
冉 冊冋 2h
3
3共1 − 2f 兲 1 − s2
册
Es .
共3兲
Therefore, by knowing the material properties of the substrate and wavelength of the buckled film and film thickness, the film’s Young’s modulus can be calculated. The above equations are derived for a plate geometry, in which the film’s width is large compared to its thickness. An alternate solution has been reported for a beam model,16 in which the width of film and substrate are small compared with their length, but comparable to the film’s thickness. Figure 1 illustrates these two geometries. Most thin films exhibit characteristics of plates, as shown in Fig. 1共a兲, because the film thickness is normally small compared to the other two dimensions. However, in some situations, a beam model shown in Fig. 1共b兲 could be applicable, e.g., a fine thin line fabricated by microlithography patterning or direct write methods.21 In the following sections, we will outline how we employ this phenomenon to probe the mechanical properties of polymer thin films having gradients in material properties.
A. Design of strain stage
We designed and constructed a custom strain stage for conducting our buckling-based metrology. The geometry and dimensions of the stage were chosen such that the stage can be mounted onto a number of imaging platforms in our laboratories, including an optical microscope, a small angle light scattering 共SALS兲 apparatus, and an atomic force microscope 共AFM兲. Each of these imaging platforms can be automated to varying degrees to provide a measure of the buckling wavelength either in real space or Fourier space. The strain stage was designed based on a slide-type construction as illustrated in Fig. 2. The gradient film 共1兲 is transferred to a 75⫻ 25 mm2 strip of silicone 共2兲, which is subsequently mounted and clamped 共3兲 to the strain stage. The first “grip” 共4兲 of the stage is held stationary while the sled/second “grip” 共5兲 is free to move. Strain is applied by the use of a motorized actuator 共6兲 attached to one end of the sled. Both the strain stage and actuator assemblies are mounted to individual aluminum plates 共7兲, which are also mounted to a solid aluminum support. On the opposite end of the sled are grooves 共8兲 for locking the sled down, which allow the degree of strain to be fixed or maintained. When this is done, the strain stage can be disengaged from the motorized actuator assembly and removed from the support block, at which time the entire strain stage can be transported easily between imaging platforms for ascertaining the buckling wavelength and, when desired, the buckling amplitude. A window 共9兲 was machined into both the aluminum plate and support directly under the suspended specimen to allow for passing a laser directly through the sample. The entire assembly has a black anodized finish to minimize light reflections. An image of the strain stage assembly is shown in Fig. 3.
FIG. 3. 共Color online兲 Image of our custom-designed strain stage for conducting buckling measurements.
Downloaded 24 May 2005 to 129.6.154.144. Redistribution subject to AIP license or copyright, see http://rsi.aip.org/rsi/copyright.jsp
062207-3
Rev. Sci. Instrum. 76, 062207 共2005兲
C&HT measurements of thin film modulus
B. Sample preparation
Poly共dimethylsiloxane兲 共PDMS, Sylgard 184, Dow Chemical兲22 was chosen as the elastic foundation since it is optically transparent, it approximates an ideal elastomer, and its modulus can be tuned by the mixing ratio of base to curing agent. Typically, a 10:1 ratio of base to curing agent is used in our studies. The PDMS mixture is degassed over 30 min under vacuum before spreading onto an 8 ⫻ 8 in2 sheet of plate glass. The volume of PDMS prepolymer prepared is carefully chosen to result in a final thickness of 1 to 2 mm. If the mixture is immediately cured at elevated temperature, the thickness of cured PDMS would be nonuniform and the surface would not be smooth. Therefore, the mixture is allowed to flow, level, and partially cure for 12 h at room temperature, and then fully cured in a forced air oven at 70 °C for 1.5 to 2 h. The resulting PDMS sheet is then cut into individual pieces with dimensions of 25⫻ 75 mm2 using a manual punch. One PDMS section was reserved for measuring the Young’s modulus of the substrate material. Typical Young’s moduli of the PDMS ranged from 1.5 to 2.0 MPa, as measured on a Texture Analyzer 共Model TA.XT2i, Texture Technologies Corp.兲. For preparation of the polymer film to be measured, a dilute solution of polymer is typically flow coated or spin cast onto a polished silicon wafer. Just prior to coating, the surface of the silicon wafer is rendered hydrophilic by exposure to UV/ozone for 30 min. Similar results can be obtained by cleaning with oxygen plasma. Spin coating yields films with exceptionally uniform thickness that can be measured using spot interferometry or ellipsometry. Multiple measurements across the sample can be made and the average thickness and standard deviation can be calculated. Flow coating affords preparation of films possessing a gradient in thickness, but a complete thickness map15 must be acquired of the gradient film, and this map must be precisely correlated to the specific positions where the buckling wavelength is to be measured. We find that this is easily achieved by automated interferometry thickness measurements across an x-y grid of points and the use of fiduciary marks, respectively. Films are transferred from the silicon wafer to PDMS substrates by aqueous immersion. In most cases, the PDMS is elongated and held fixed in the strain stage prior to film transfer, such that release of the applied strain results in an application of a net compressive strain on the film. The film on silicon is then placed face down on the PDMS substrate. Visual observation indicates the PDMS wets and softly adheres to the surface of the polymer film. Immersion of the multilayer stack in water results in the transfer of the polymer film to the PDMS due to the wicking of water into the polymer/silicon interface. The entire stage assembly is then removed from the water and gently dried using compressed nitrogen. Buckling of the film/substrate occurs upon compression, observable by the iridescent color of the buckled region, as can be seen in Fig. 4. Ideally, the entire film would buckle simultaneously, but imperfections in the film and substrate as well as distortions in the strain field can cause portions of the film to buckle before others. Thus, the degree of compression is manually adjusted via the actuator until the entire film is buckled, at which time the measurement of
FIG. 4. 共Color online兲 Image of just the sled component of the strain stage. A specimen has been loaded onto the strain stage and subsequently buckled, as evidenced by the iridescent color resulting from micron-sized wrinkles on the surface of the laminate. This image also demonstrates that the applied strain can be locked in by using the grooves in the sled and the array of threaded holes in the mounting plate.
wavelength is performed and the compressive strain recorded. C. Data collection
After preparation and mounting of samples onto the strain stage, the buckling instability is initiated by application of strain. The magnitude of stress necessary to trigger the instability is a function of both the moduli and Poisson’s ratios of the film and substrate 关see Eq. 共1兲兴. This buckling introduces highly periodic wrinkles where the associated buckles are oriented perpendicular to the direction of strain. The wrinkling wavelength can be measured in a variety of ways, including both contact and noncontact methods. Noncontact methods include two primary methodologies: optical microscopy and SALS. Optical microscopy provides the most direct method to verify the uniformity of the buckles, but it also requires focusing, an aspect which can add an additional complication and time-consuming step when implementing an automated high-throughput measurement. Auto-focus modules often do not live up to their promise and, furthermore, can add a rate-limiting step for the hundreds or even thousands of measurements associated with routine high-throughput screening. Moreover, it can be difficult to unambiguously ascertain the actual wrinkling period as buckle crests and troughs occasionally, but not always, can be difficult to discern. However, for samples that are opaque or of wavelengths much greater than 50 m, this can be the only route. Images can be collected with a conventional charged coupled device 共CCD兲 camera or digital camera mounted on the microscope. For high-throughput work, automation of stage motion, image focusing, and image acquisition is readily available. However, for all such work, long-working distance objectives are recommended such that the microscope objective does impede motion of the strain stage. Calibration of microscope images is carried out by obtaining images of a stage micrometer or other standards with well-measured dimensions. Image analysis for data collected on the optical microscope is discussed in the next section. In contrast to microscopy, SALS provides a particularly fast and convenient method for high-throughput data acqui-
Downloaded 24 May 2005 to 129.6.154.144. Redistribution subject to AIP license or copyright, see http://rsi.aip.org/rsi/copyright.jsp
062207-4
Rev. Sci. Instrum. 76, 062207 共2005兲
Stafford et al.
FIG. 6. 共Color online兲 Thickness profile of PS, P共S-I-S兲, and the laminated bi-layer. The error bars represent one standard deviation of the data, which is taken as the experimental uncertainty of the measurement. Some error bars are smaller than the symbols.
m = 2/qm , FIG. 5. Examples of 共a兲 optical microscope images and 共b兲 resulting SALS patterns of anisotropic 共top兲 and isotropic 共bottom兲 buckling patterns.
sition and analysis, and is enabled by the optical transparency of the PDMS substrate. Conventional SALS apparatuses with rudimentary automation are becoming more affordable due to advances in lasers, CCD cameras, and computerized translation stages. No optical lenses are necessary and a sheet of paper works nicely as a diffuser/imaging screen. We find that a conventional 8-bit 共256 levels兲 grayscale camera provides sufficient sensitivity for our purposes. Calibration of the scattering wave number in one dimension versus image pixel number can be carried out with a diffraction grating, such as a Ronchi ruling. We find that a thirdorder polynomial fit typically suffices to make a one-to-one correspondence between pixel and wave number q. After calibration, identification of the diffraction peaks is straightforward and can be further refined by application of a scattering function, such as a Gaussian. Our SALS apparatus is outfitted with an automated x-y translation stage to facilitate mapping of the buckling wavelength as a function of spatial position on the sample. While the two methods mentioned above measure the lateral length scale of the buckles, they do not provide topographical information such as buckling amplitude.23 One direct method to obtain full three-dimensional topographical information is profilometry, such as provided by AFM. However, this technique is sufficiently time consuming that it would be all but impractical for high-throughput work. Analysis of AFM images will be discussed below.
D. Image and data analysis
To best quantify the wavelength of the resulting buckling patterns, we choose to conduct all image analyses in Fourier space. This approach yields the dominant wave vector, qm 共m−1兲, present in the system. The dominant wave vector can then be converted to wavelength using the relationship
共4兲
where m 共m兲 is the dominant wavelength of the buckling instability. If images of the buckling pattern are collected using an optical microscope, the real-space images must first be converted to Fourier space using fast Fourier transform 共FFT兲 algorithms provided in many commercial packages including MatLab, IDL, and Image Pro. SALS images are by definition already in Fourier space, so no further transforms are needed. If the buckling pattern is isotropic, the resulting FFT will be a series of concentric circles; if the buckles are aligned, the resulting FFT will be a series of peaks 共see Fig. 5兲. In the former case 共isotropic兲, the dominant wave vector can then be ascertained by taking an azimuthal average of the intensity 共I兲 as a function of q. In the latter case 共aligned兲, however, this process can be simplified by performing a line scan through the center of the peaks. The resulting I共q兲 plot is smoothed using an adjacent averaging method; typically, a seven-point smoothing function is used. Finally, an automated routine is used to determine the q-position of maximum intensity 共qm兲 for first- and 共when possible兲 secondorder peaks 共2qm, ideally兲. This value of qm is then converted to m through Eq. 共4兲, which is used to calculate the film modulus through Eq. 共3兲. If the specimen only contains a gradient along one axis, multiple images can be collected along the nongradient axis 共uniform material properties兲 to generate the error or uncertainty of the measurement.
IV. EXAMPLE: MODULUS GRADIENT
To demonstrate the viability of this buckling-based metrology as a combinatorial and high-throughput technique, we generate a modulus gradient consisting of a bi-layer of polystyrene-polyisoprene-polystyrene 关P共S-I-S兲兴 triblock copolymer 共Vector 4411, Dexco Polymers LP兲 and polystyrene 共PS兲 films. Dissolved P共S-I-S兲 and PS solutions were separately flow-coated onto a silicon wafer to form films with gradients in film thickness. By placing the P共S-I-S兲 film on top of the PS film with the thickness gradients parallel to one another, a modulus gradient was formed in the P共S-I-S兲-PS
Downloaded 24 May 2005 to 129.6.154.144. Redistribution subject to AIP license or copyright, see http://rsi.aip.org/rsi/copyright.jsp
062207-5
Rev. Sci. Instrum. 76, 062207 共2005兲
C&HT measurements of thin film modulus
exhibited a factor of 3 decrease in modulus from the PS-rich region to the P共S-I-S兲-rich region. Equation 共5兲 reveals that Eeff is more sensitive to thickness ratio than modulus ratio of the two materials, thus steeper modulus gradients can be made by precisely tuning the thickness ratio between each layer. The entire measurement described here was conducted in less than 10 min, demonstrating that this technique is conducive to high-throughput methodologies and could be applied to other problems where material optimization is paramount. ACKNOWLEDGMENTS
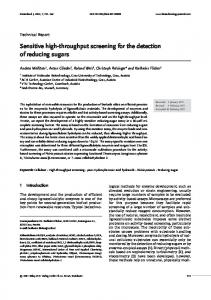
CMS and CH acknowledge the NIST National Research Council Postdoctoral Fellowship Program. FIG. 7. 共Color online兲 Modulus as a function of position in the laminated PS/P共S-I-S兲 bi-layer for both experimental data 共closed circles兲 and the analytical solution 共open circles兲. The error bars represent one standard deviation of the data, which is taken as the experimental uncertainty of the measurement. Some error bars are smaller than the symbols.
bi-layer along the flow-coating direction. Using composite beam theory, the resultant effective modulus, Eeff, of a bilayer can be calculated as follows: Eeff =
1 + m2n4 + 2mn共2n2 + 3n + 2兲 E1 , 共1 + n兲3共1 + mn兲
共5兲
where m is the modulus ratio E2 / E1 and n is the thickness ratio h2 / h1 of the two layers. Here we take layer 1 as PS and layer 2 as P共S-I-S兲. The thickness ratio at each position can be obtained by measuring the thickness profile of each layer before transferring to the surface of PDMS substrate. Interferometry 共Filmetrics, Inc.兲 was used to measure the film thickness. Figure 6 illustrates the thickness profile of each film and the laminated layer. The thickness profile of the bi-layer was substituted into Eq. 共3兲 to calculate the effective modulus, Eeff, of the bi-layer. The two films were then transferred from the silicon wafer to the surface of the prestretched PDMS slab. The two films were overlapped so that there were three regions: pure PS, PS-P共S-I-S兲 bilayer, and pure P共S-I-S兲. The pure PS and pure P共S-I-S兲 sections can be used to measure the modulus of PS and P共S-I-S兲 individually as an internal calibration. The bucking wavelength of both the laminated and individual layers was measured using SALS as described in the previous section. Figure 7 shows the modulus profile of the laminate. The calculated Eeff is also shown and the agreement is promising. Using the current technique and materials, the modulus of the laminate
1
A. A. Elshabini-Riad and E. D. Barlow, Thin Film Technology Handbook 共McGraw-Hill, New York, 1997兲. 2 H. Namatsu, K. Kurihara, M. Nagase, K. Iwadate, and K. Murase, Appl. Phys. Lett. 66, 2655 共1995兲. 3 H. B. Cao, P. F. Nealey, and W.-D. Domke, J. Vac. Sci. Technol. B 18, 3303 共2000兲. 4 T. Tanaka, M. Morigami, and N. Atoda, Jpn. J. Appl. Phys., Part 1 32, 6059 共1993兲. 5 M. R. VanLandingham, J. Res. Natl. Inst. Stand. Technol. 108, 249 共2003兲. 6 A. G. Every, Meas. Sci. Technol. 13, R21 共2002兲. 7 D. Du, O. K. C. Tsui, Q. Zhang, and H. He, Langmuir 17, 3286 共2001兲. 8 R. Hartschuh et al., J. Polym. Sci., Part B: Polym. Phys. 42, 1106 共2004兲. 9 J. A. Forrest, K. Dalnoki-Veress, and J. R. Dutcher, Phys. Rev. E 58, 6109 共1998兲. 10 D. Schneider, T. Witke, T. Schwarz, B. Schöneich, and B. Schultrich, Surf. Coat. Technol. 126, 136 共2000兲. 11 M. G. Allen, M. Mehregany, R. T. Howe, and S. D. Senturia, Appl. Phys. Lett. 51, 241 共1987兲. 12 M. K. Small and W. D. Nix, J. Mater. Res. 7, 1553 共1992兲. 13 J. J. Vlassak and W. D. Nix, J. Mater. Res. 7, 3242 共1992兲. 14 D. Maier-Schneider, J. Maibach, and E. Obermeier, J. Microelectromech. Syst. 4, 238 共1995兲. 15 C. M. Stafford et al., Nat. Mater. 3, 545 共2004兲. 16 G. S. Gough, C. F. Elam, and N. A. de Bruyne, J. R. Aeronaut. Soc. 44, 12 共1940兲. 17 M. A. Biot, J. Appl. Mech. 4, 1 共1937兲. 18 H. G. Allen, Analysis and Design of Structural Sandwich Panels 共Pergamon, New York, 1969兲 19 A. L. Volynskii, S. Bazhenov, O. V. Lebedeva, and N. F. Bakeev, J. Mater. Sci. 35, 547 共2000兲. 20 J. Groenewold, Physica A 298, 32 共2001兲. 21 D. B. Chrisey, A. Pique, J. Fitz-Gerald, R. C. Y. Auyeung, R. A. McGill, H. D. Wu, and M. Duignan, Appl. Surf. Sci. 154-155, 593 共2000兲. 22 Equipment and instruments or materials are identified in the paper in order to adequately specify the experimental details. Such identification does not imply recommendation by NIST, nor does it imply the materials are necessarily the best available for the purpose. 23 C. Harrison, C. M. Stafford, W. Zhang, and A. Karim, Appl. Phys. Lett. 85, 4016 共2004兲.
Downloaded 24 May 2005 to 129.6.154.144. Redistribution subject to AIP license or copyright, see http://rsi.aip.org/rsi/copyright.jsp