(B) Comparison between two single-cell datasets by C1 Fluidigm. The Pearson's ..... Supplemental Figure S6: Construction of network modules by WGCNA.
Combinatory use of distinct single-cell RNA-seq analytical platforms reveals the heterogeneous transcriptome response Yukie Kashima, Ayako Suzuki, Ying Liu, Masahito Hosokawa, Hiroko Matsunaga, Masataka Shirai, Kohji Arikawa, Sumio Sugano, Takashi Kohno, Haruko Takeyama, Katsuya Tsuchihara and Yutaka Suzuki SUPPLEMENTAL MATERIALS SUPPLEMENTAL FIGURES S1-S9 pp2-pp20 SUPPLEMENTAL TABLES S1-S9 pp21-pp29
−2
−1
1
2
3
2 1 0
log10 (PPM+0.01)
3
4 0
r = 0.85
−2 −1
log10 (RPKM+0.01)
micro-droplet synthetic bulk
0
1
2
3
r = 0.86
−2 −1
micro-chamber synthetic bulk
4
A
4
−2
C1 synthetic bulk
−1
0
1
2
3
4
C1 synthetic bulk log10 (RPKM+0.01)
4
B
1 −2 −1
0
C1 top2
2
3
r = 0.73
log10 (RPKM+0.01)
−2
−1
0
1
2
3
4
C1 top1 C Cell line
PC9
sample
Raw Read/cell
used reads/cell
Number of Cells
average
21,669,191
14,455,179
47
top1
30,704,526
20,239,586
1
top2
30,607,350
21,852,050
1
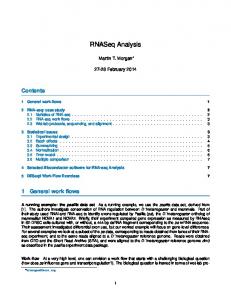
Supplemental Figure S1: Generation of the RNA-Seq dataset using the micro-chamber system, micro-droplet system and C1 Fluidigm (A) Comparison between the synthetic bulk dataset for the two platforms, C1 Fluidigm (x-axis) and micro-chamber system (yaxis) (left), and C1 Fluidigm (x-axis) and the micro-droplet system (y-axis) (right). The Pearson’s correlation between the two experiments is shown in the plot. (B) Comparison between two single-cell datasets by C1 Fluidigm. The Pearson’s correlation between the two experiments is shown in the plot. (C) Statistics for the C1 Fluidigm system data used in the present study.
A H1650
log10 (RPKM+0.01)
−2
−1
0
1
2
3
0
1
2
3
r = 0.81
−2 −1
0
1
2
expression level top2
3
4
r = 0.85
−2 −1
expression level top2
4
II-18
4
log10 (RPKM+0.01)
−2
−1
expression level top1
0
3
4
H2228 r = 0.78
log10 (RPKM+0.01)
−2
−1
0
1
2
expression level top1
3
4
2 1 0 −2 −1
−2 −1
0
1
2
expression level top2
3
4
r = 0.76
3
4
2
expression level top1
H1975
expression level top2
1
log10 (RPKM+0.01)
−2
−1
0
1
2
3
4
expression level top1
Supplemental Figure S2: Generation of RNA-seq dataset using two platforms (A) Comparison of the expression level between top1 (x-axis) and top2 (y-axis) using the micro-chamber system in four cell lines: II-18, H1650, H1975 and H2228. The Pearson’s correlation between two experiments is shown in the plot.
B
4
H1650
4
II-18
−1
0
1
2
3
2 1 −2 −1
log10 (RPKM+0.01)
−2
0
gefitinib (bulk)
2 1 0 −2 −1
gefitinib (bulk)
3
r = 0.92
3
r = 0.90
4
log10 (RPKM+0.01)
−2
−1
DMSO (bulk)
0
4
H2228
4
4
DMSO (bulk)
2
3
1
2
3 1
log10 (RPKM+0.01)
−2 −1
log10 (RPKM+0.01)
0
0
gefitinib (bulk)
3 2 1 0 −2 −1
gefitinib (bulk)
3
r = 0.92
r = 0.91
−1
2
DMSO (bulk)
H1975
−2
1
4
−2
−1
0
1
2
3
4
DMSO (bulk)
Supplemental Figure S2: Generation of RNA-seq dataset using two platforms (B) Comparison of the bulk expression level between samples treated with DMSO (x-axis) and gefitinib (y-axis) using the micro-chamber system in five cell lines: II-18, H1650, H1975 and H2228. The Pearson’s correlation between two experiments is shown in the plot.
C
4
H1650
4
II-18
log10 (RPKM+0.01)
−2
−1
0
1
2
3
3 2 1 0 −2 −1
0
1
2
3
gefitinib (synthetic bulk)
r = 0.97
−2 −1
gefitinib (synthetic bulk)
r = 0.97
4
log10 (RPKM+0.01)
−2
DMSO (synthetic bulk)
−1
0
2
3
4
DMSO (synthetic bulk)
H2228
−2 −1
log10 (RPKM+0.01)
−2
−1
0
1
2
DMSO (synthetic bulk)
3
4
1
2
3
r = 0.97
0
0
1
2
3
gefitinib (synthetic bulk)
r = 0.97
−2 −1
4
4
H1975
gefitinib (synthetic bulk)
1
log10 (RPKM+0.01)
−2
−1
0
1
2
3
4
DMSO (synthetic bulk)
Supplemental Figure S2: Generation of RNA-seq dataset using two platforms (C) Comparison of the synthetic bulk expression level between samples treated with DMSO (x-axis) and gefitinib (y-axis) using the micro-chamber system in five cell lines: II-18, H1650, H1975 and H2228. The Pearson’s correlation between two experiments is shown in the plot.
D
4
H1650
4
II-18
1
2
3
1
−1
0
1
2
H1975
H2228
3
4
4
expression level top1
1
2
expression level top1
3
4
2 1 0
expression level top2
2 1 0
0
3
r = 0.65
−2 −1
expression level top2
−2
expression level top1
log10 (PPM+0.01)
−1
0
4
r = 0.59
−2
2
3 0
log10 (PPM+0.01)
−2 −1
−1
3
4
−2
r = 0.62
−2 −1
log10 (PPM+0.01)
expression level top2
2 1 0 −2 −1
expression level top2
3
r = 0.65
log10 (PPM+0.01)
−2
−1
0
1
2
3
4
expression level top1
Supplemental Figure S2: Generation of RNA-seq dataset using two platforms (D) Comparison of the expression level between top1 (x-axis) and top2 (y-axis) using the micro-droplet system in five cell lines: II-18, H1650, H1975 and H2228. The Pearson’s correlation between two experiments is shown in the plot.
E
4
H1650
4
II-18
log10 (PPM+0.01)
−2
−1
0
1
2
3
3 2 1 0 −2 −1
0
1
2
3
gefitinib (synthetic bulk)
r = 0.99
−2 −1
gefitinib (synthetic bulk)
r = 0.99
4
log10 (PPM+0.01)
−2
−1
DMSO (synthetic bulk)
0
2
3
4
DMSO (synthetic bulk)
H1975
4
4
H2228
r = 0.99
log10 (PPM+0.01)
−2
−1
0
1
2
DMSO (synthetic bulk)
3
4
3 2 1 0 −2 −1
0
1
2
3
gefitinib (synthetic bulk)
r = 0.99
−2 −1
gefitinib (synthetic bulk)
1
log10 (PPM+0.01)
−2
−1
0
1
2
3
4
DMSO (synthetic bulk)
Supplemental Figure S2: Generation of RNA-seq dataset using two platforms (E) Comparison of the synthetic bulk expression level between samples treated with DMSO (x-axis) and gefitinib (y-axis) using the micro-droplet system in four cell lines: II-18, H1650, H1975 and H2228. The Pearson’s correlation between two experiments is shown in the plot.
4
4
2 −2
0
2 −2 −2
0
2
4
−2
2
4
−2
0
2
4
−2
0
4
2
4
2
r = 0.60
0
2
−2
0 −2
−2
0
2
0
r = 0.61
4
r = 0.61
2
r = 0.61
4
4
4
−2
−2 2
2
0
2 0
0
0
0
2
4
r = 0.62
−2
4
4
−2 4
r = 0.62
0
2 0
2
2
4
0
r = 0.61
−2
micro-droplet top3 log10(ppm+0.01) (31,135)
micro-chamber top3 log10(rpkm+0.01) (2,762,012)
r = 0.63
−2
micro-droplet top1 log10(ppm+0.01) (35,753)
r = 0.62
−2
micro-droplet top2 log10(ppm+0.01) (32,472)
micro-chamber top2 log10(rpkm+0.01) (2,773,525) 4
micro-chamber top1 log10(rpkm+0.01) (2,944,039)
−2
0
2
4
−2
0
Supplemental Figure S3: Comparison between two single-cell in different platforms Comparison between single-cell expression of the micro-chamber system (x-axis) and the micro-droplet system (y-axis) shown in the plot. We selected eight cells with the first, second, third and fourth largest number of mapped scRNA-seq tags (the top1 to top3 cells) from the respective platforms. We calculated and compared expression levels of all genes. The Pearson’s correlation between the two samples is shown in the plot.
A
20 cell cycle marker genes
5,166 cells CCNE1 E2F1 CDC6 PCNA RFC4 DHFR RRM2 RAD51 CDK1 TOP2A CCNF CCNA2 AURKA BUB1 CCNB1 PLK1 PTTG1 RAD21 VEGFC CDKN3
-6
6
0 −4
−2
PC2
2
PC2
4
B
Z score
PC1
−4
−2
0
2
PC1
Supplemental Figure S4: Cell cycle status of the micro-droplet dataset estimated by 20 genes Cell cycle analysis of PC9 cells from the micro-droplet system datasets based on the expression levels of 20 genes. The heatmap (A) and PCA analysis (B) are shown.
IRIS
2.39 (log10 ppm)
0.8 Experimental values
PAK6 1.0
R=0.06
R=0.47 16% samples
0.6 0.4
1.96 (log10 ppm)
1.86 (log10 ppm)
0.0
0.0 0.4 0.6 0.8 Predicted values
1.0
R=0.7 30% samples
0.4 0.2
0.2
2.25 (log10 ppm)
0.6
0.2
0.0
R=-0.12
0.8 Experimental values
1.0
0.0
0.2
0.4
0.6
0.8
1.0
Predicted values
EEF2K 1.0
Experimental values
0.8
R=-0.22 2.13 (log10 ppm)
R=0.4 53% samples
0.6 0.4
1.83 (log10 ppm) 0.2 0.0 0.0
0.2
0.4
0.6
0.8
1.0
Predicted values
Supplemental Figure S5: Estimation of missing value for genes in the MAPK/ERK pathway Comparison between normalized predicted values (x-axis) and normalized experimental values (y-axis) for three genes. We used 0-1 normalization for different scales. The Pearson’s correlations between two values of all cells (black) and selected cells (blue) are shown in the plot. Experimental expression levels (log10 PPM) corresponding to 0.8 and 0.4 are also shown in the plot (red).
A WGCNA network : PC9
s_005
s_020
s_036
s_004
5
0.4
power β=8
3 2
5
10
15
20
5
5
Soft Threshold (power)
6 7 8 9 1011121314151617181920
10
15
Soft Threshold (power)
71 modules : identified
0.80
0.85
Height
0.90
0.95
1.00
Cluster Dendrogram
Module colors
4
0
1
2
3
1000
4
0.2 0.0
7000 Mean Connectivity
0.6
6
1
as.dist(dissTom) fastcluster::hclust (*, "average")
20
s_041
s_023
s_018
s_015
s_040
s_013
s_012
s_003 s_019
0.8
7
1112131415 9 10 161718 19 20
5000
8
Mean connectivity
3000
Scale Free Topology Model Fit,signed R^2
1.0
Scale independence
s_031
s_026
s_017
s_044
s_034
s_025
s_032
s_006
s_035
s_024
s_002
s_038
s_021
s_027
s_011
s_064
140
s_060
s_037
s_010
s_039
s_050
s_051
s_007
s_033
s_030
s_022
s_029
s_028
s_045
s_008
s_009
s_043
s_016
s_056
160
s_052
s_042
s_049
s_014 s_055
s_059
s_066
s_065
s_058
180
Height
s_061
s_062
200
micro-chamber dataset 22913 genes/ 66 cells --> remove outlier cells (s_046, s_048, s_053, s_054, s_057) --> remove low expression genes (5rpkm> at least 1 cell) --> 13,619 genes / 61 cells (DMSO 44 cells, gefitinib17 cells)
s_063
s_001
s_047
220
Sample clustering to detect outliers
0.85
0.90
Height
0.95
0.0
3
1 2
Module colors
power β=7
5 10 15
1000
0.4
5
4
1.0
7000
8 9 1011121314151617 19 18 20
5000
0.8
s_196 s_203
100
s_227 s_233
20
Soft Threshold (power)
58 modules : identified
Cluster Dendrogram
as.dist(dissTom) fastcluster::hclust (*, "average")
s_217
s_252
120
Scale independence
5
5 10
s_197
Mean connectivity
1
6
2
3 4 6 7 8 9 1011121314151617181920
15
Soft Threshold (power) 20
s_260 s_284
s_195 s_220
s_256 s_283
s_211
s_279
s_237 s_273
s_248 s_246
s_208 s_231
s_287 s_213 s_268 s_272
180
s_270 s_259 s_278 s_266 s_241 s_242
s_238 s_263 s_216 s_267 s_239 s_275 s_204 s_280 s_277 s_286 s_212 s_262 s_276 s_224 s_218 s_214 s_219 s_251 s_243 s_269
s_247 s_244
160
Height
s_274 s_254 s_249 s_255 s_258 s_201 s_202 s_209 s_271 s_235 s_215 s_205 s_194 s_225 s_230 s_222 s_207 s_206 s_236 s_221 s_229 s_193 s_226 s_232 s_234 s_210 s_228 s_223
s_198 s_199
140
micro-chamber dataset 22913 genes/ 94 cells --> remove outlier cells (s_265, s_281, s_282) --> remove low expression genes (5rpkm> at least 1 cell) --> 13594 genes / 91 cells (DMSO 47 cells, gefitinib 44 cells)
3000
Mean Connectivity
0.6
7
0
0.2
Scale Free Topology Model Fit,signed R^2
s_200 s_257 s_253 s_264 s_250 s_261 s_245
s_285
200
220
B WGCNA network : II-18
Sample clustering to detect outliers
0.80
0.85
0.90
Height
0.95
1.00
Module colors
0.0
0.6
5
5 6000
6
4
3
2
1
power β=8
10 15 4000
7
2000
0.8
8 9
Mean Connectivity
0.4
1.0
s_299 s_318
s_346
120
Scale independence Mean connectivity
1011121314 1617181920 15 1
20
Soft Threshold (power)
80 modules : identified
Cluster Dendrogram
as.dist(dissTom) fastcluster::hclust (*, "average")
2
3 4 5
5 6 7 8 9 1011121314151617181920
10 15
Soft Threshold (power) 20
s_338
s_368 s_383 s_330
160
180
Height
s_375
200
s_352 s_361 s_300
s_357 s_359
s_371 s_360 s_374 s_344 s_347 s_370 s_348 s_358 s_381 s_326 s_366 s_311 s_342 s_354 s_363 s_302 s_369 s_294 s_322 s_325 s_378 s_332 s_327 s_334 s_364 s_290
s_328 s_293 s_324 s_341 s_382 s_349 s_310 s_380 s_337 s_308 s_321 s_309 s_296 s_320 s_365 s_340 s_377 s_350 s_355 s_323 s_356
s_301 s_306
s_373 s_379 s_353 s_372 s_316 s_339 s_319 s_312 s_298 s_313 s_305 s_295 s_329 s_345 s_335 s_292 s_343 s_367 s_315 s_304 s_297 s_303 s_291 s_314 s_351 s_307
140
s_376
s_289
220
s_362 s_317
240
micro-chamber dataset 22913 genes/ 94 cells -> remove outlier cells (s_331, s_333) --> remove low expression genes (5rpkm> at least 1 cell) --> 14429 genes / 92 cells (DMSO 45 cells, gefitinib 47 cells)
0
0.2
Scale Free Topology Model Fit,signed R^2
C WGCNA network : H1650
Sample clustering to detect outliers
0.85
Height
0.90
0.95
1.00
Module colors
3
2
1000
0.4
0.6
5 6
5
4
1
power β=8
10 15 5000
1.0
7000
16 9 101112131415 1718 1920
3000
0.8
7 8
Mean Connectivity
0.2
s_113 s_115 s_111 s_131 s_139 s_130 s_128 s_161
120
Scale independence
20
Soft Threshold (power)
83 modules : identified
Cluster Dendrogram
as.dist(dissTom) fastcluster::hclust (*, "average")
5
5 10 15
Soft Threshold (power)
Mean connectivity
1
2
3 4 6 7 8 9 1011121314151617181920
20
s_102
s_169 s_146 s_186 s_171 s_153 s_132 s_106 s_124 s_138 s_190
s_125 s_177
s_126
s_163 s_173
s_107 s_152
160
s_157 s_188
180
s_191 s_156 s_101 s_175 s_141
s_148 s_142 s_136 s_098 s_155 s_183 s_118
s_166
s_143 s_133
s_104 s_109
Height
s_147 s_187 s_167 s_123 s_114 s_164 s_105 s_149 s_180 s_182 s_099
s_127 s_137
s_151 s_121 s_178 s_100 s_108
s_097 s_135 s_158 s_168 s_160 s_162 s_112 s_172 s_159 s_150 s_129 s_176 s_140 s_154 s_179 s_170
s_110 s_185
s_103 s_116 s_122 s_174 s_119
140
s_189 s_184 s_165 s_120 s_117
micro-chamber dataset 22913 genes/ 9 cells -> remove outlier cells (s_145) --> remove low expression genes (5rpkm> at least 1 cell) --> 14272 genes / 93 cells (DMSO 47 cells, gefitinib 46 cells)
0
0.0
Scale Free Topology Model Fit,signed R^2
s_181
200
s_134
220
D WGCNA network : H1975 Sample clustering to detect outliers
0.6
0.7
0.8
Height
0.9
1.0
Module colors
−0.2
2 3 4
1
power β=10
5 10 15 0
0.0
0.2
8
7
0.6
6000
9
5 6
4000
0.8
1.0
s_390 s_396
120
Scale independence
11121314151617181920 10
5
20 5
Soft Threshold (power)
75 modules identified
Cluster Dendrogram
as.dist(dissTom) fastcluster::hclust (*, "average")
10 15
Soft Threshold (power)
Mean connectivity
1
2
3 4 6 7 8 9 1011121314151617181920
20
s_388 s_385 s_451
s_405
s_415 s_400
160
s_387 s_394 s_406 s_421 s_414 s_402 s_418
s_425
Height 200
s_461 s_460 s_472 s_464 s_457 s_452 s_417 s_465 s_433 s_479 s_454 s_397 s_474 s_468 s_470 s_407 s_403
180
s_422 s_423 s_448 s_429 s_439 s_459 s_412 s_449 s_450 s_399 s_462 s_469 s_438 s_440 s_477 s_476 s_441 s_466 s_434 s_419 s_478 s_455 s_475 s_416 s_473 s_463 s_471 s_408 s_467 s_437 s_443 s_456 s_436 s_435 s_444 s_426 s_398 s_447 s_453 s_392 s_389 s_393 s_420 s_409 s_430 s_395 s_410 s_404 s_445 s_431 s_424 s_411 s_401 s_413 s_427 s_446 s_386 s_391
140
220
micro-chamber dataset 22913 genes/ 94 cells -> remove outlier cells (s_428, s_458) --> remove low expression genes (5rpkm> at least 1 cell) --> 14293 genes / 92 cells (DMSO 47 cells, gefitinib 45 cells)
2000
Mean Connectivity
0.4
Scale Free Topology Model Fit,signed R^2
s_442
240
E WGCNA network : H2228 Sample clustering to detect outliers
Supplemental Figure S6: Construction of network modules by WGCNA (A-E) Schematic of the construction of the co-expression network with the micro-chamber dataset by WGCNA. The panel shows the schematics of the pre-process (left, top). On the top right, an analysis of network topology for powers is shown. The scale independence shows the scale-free fit index (y-axis) as a function of the soft-thresholding power (x-axis). The soft-thresholding power value used in the present study is shown in the plot as powerβ. The mean connectivity displays the mean connectivity (degree, y-axis) as a function of the soft-thresholding power (x-axis). The red line shown in left panel indicates a high value, 0.9. A clustering dendrogram of samples based on their Euclidean distance is shown on the bottom left. A clustering dendrogram of genes with dissimilarity based on topological overlap, together with assigned module colors, is shown on the bottom right. The number of identified modules is shown in the plot. Each figure shows the schematics of (A) PC9, (B) II-18, (C) H1650, (D) H1975 and (E) H2228.
40
t2
20
V2
yellow_group cluster1
0
cluster2
−20
t1 −50
−25
0
cluster1 cluster2
25
V1
Supplemental Figure S7: Clustering of the micro-droplet datasets using module “PC9-magenta”
five cell lines (total 429 cells)
A H1650
H2228
II-18
PC9
22,913 genes
H1975
PC9 DMSO PC9 gefitinib
II-18 DMSO II-18 gefitinib
H1650 DMSO H1650 gefitinib
H1975 DMSO H1975 gefitinib
H2228 DMSO H2228 gefitinib
Supplemental Figure S8: Clustering of micro-chamber datasets (A) Hierarchal clustering of 429 micro-chamber datasets by all 22,913 genes. All cell line datasets were gathered and clustered
B
PC9
22913genes
II-18
H1650
H1975
H2228
Supplemental Figure S8: Clustering of micro-chamber datasets (B) Hierarchal clustering of 429 micro-chamber datasets by all 22,913 genes. Eeach cell line dataset was gathered and clustered.
2.4
4
2.2
3 2
CB:Z:CGATCCACGTCGTA-1 CB:Z:AGAGCGGATGAGGG-1
2.0
1 0 −2
−1
0
1
2
3
SOX4 (log10(PPM+0.01))
4
1.6
1.8
−2 −1
CD44 (log10(PPM+0.01))
CB:Z:AAAGGCCTTTCTTG-1
Supplemental Figure S9: Expression levels of SOX4 and CD44 in II-18 cells. The plot shows the expression levels of SOX4 and CD44 in micro-droplet II-18 samples.
−2.0
−1.0
0.0 0.5 1.0
Supplemental Tables Supplemental Table S1, Number and ratio without PCR sister reads in the micro-droplet dataset.
PC9
II-18
H1650
H1975
H2228
Total raw reads
Reads without PCR sisters
%
DMSO
127631437
86320712
68
gefitinib
170913768
73809216
43
DMSO
173605651
82652598
48
gefitinib
164734523
98278555
60
DMSO
100094271
68329141
68
gefitinib
111008829
76768723
69
DMSO
161777133
70871586
44
gefitinib
173096952
115455843
67
DMSO
176666104
96259797
54
gefitinib
149011834
67743954
45
average
83649013
57
Supplemental Table S2, Gene list used in cell cycle analysis in micro-chamber datasets
Symbol
gene name
CCNE1
cyclin E1
E2F1
E2F transcription factor 1
CDC6
cell division cycle 6
PCNA
proliferating cell nuclear antigen
RFC4
replication factor C (activator 1) 4, 37kDa
DHFR
dihydrofolate reductase
RRM2
ribonucleotide reductase M2
RAD51
RAD51 recombinase
CDK1
cyclin-dependent kinase 1
TOP2A
topoisomerase (DNA) II alpha 170kDa
CCNF
cyclin F
CCNA2
cyclin A2
AURKA
aurora kinase A
BUB1
BUB1 mitotic checkpoint serine/threonine kinase
CCNB1
cyclin B1
PLK1
polo-like kinase 1
PTTG1
pituitary tumor-transforming 1
RAD21
RAD21 homolog (S. pombe)
VEGFC
vascular endothelial growth factor C
CDKN3
cyclin-dependent kinase inhibitor 3
Supplemental Table S3, Gene list used in cell cycle analysis in micro-droplet datasets
R
phase
Symbol
R
ACD
0.2084462
G2/M
ANLN
0.2723649
G1/S
APEX2
0.2148424
G2/M
AURKB
0.5321099
G1/S
CCNE1
0.2663608
G2/M
BORA
0.2714558
G1/S
CCNE2
0.3252323
G2/M
BUB3
0.2748968
G1/S
CDC6
0.3118351
G2/M
CCNA2
0.4965628
G2/M
CCNF
0.2104578
G1/S
CDCA7L
0.2902344
G2/M
CDCA2
0.2311073
G1/S
CHAF1A
0.2369656
G2/M
CDCA3
0.400363
G1/S
CLSPN
0.3776165
G2/M
CDCA8
0.2783313
G1/S
E2F1
0.2836067
G2/M
CDK1
0.5821498
G1/S
GINS2
0.4020135
G2/M
CDKN2C
0.2262832
G2/M
CKAP2
0.3141243
G2/M
CKAP2L
0.2641564
G2/M
FAM83D
0.5195265
G2/M
GAS2L3
0.2245058
phase
Symbol
G1/S
G1/S
GMNN
0.4269952
G1/S
INTS8
0.2561322
G1/S
LUC7L3
0.2050314
G1/S
MCM2
0.2240236
G2/M
H2AFX
0.2285597
G1/S
MCM5
0.2868178
G2/M
HJURP
0.4282288
G1/S
MCM6
0.2503445
G2/M
HMGB2
0.6292196
G1/S
NASP
0.3089949
G2/M
KIF5B
0.3209594
G1/S
PCNA
0.5877051
G2/M
KIF20B
0.2873333
G1/S
POLD3
0.2613784
G2/M
KIF22
0.2844896
G2/M
KIF23
0.332756
G2/M
KIFC1
0.2672676
G2/M
KPNA2
0.6223326
G2/M
MAD2L1
0.2339825
G2/M
MALAT1
0.409941
G1/S
SLBP
0.5079985
G1/S
UNG
0.2762654
S
ASF1B
0.241012
S
CDC45
0.2327182
S
CENPM
0.2157942
G2/M
NDC80
0.3773631
S
ENOSF1
0.4931348
G2/M
NUCKS1
0.2874382
S
FEN1
0.2346011
G2/M
NUSAP1
0.4998711
S
GCLM
0.2522648
G2/M
PIF1
0.2399757
0.2029316
G2/M
PSMD11
0.2376324
0.36078
G2/M
PSRC1
0.3390074
G2/M
RCCD1
0.2086352
G2/M
SAP30
0.2066004
S
H1F0
S
HIST1H4C
S
RRM2
0.3137284
S
RSRC2
0.2007431
S
TOP2A
0.2312718
S
TYMS
0.4957512
S
UBE2T
0.3587391
S
ZWINT
0.4421044
G2/M
SMC4
0.449287
G2/M
TOP2A
0.4822954
G2/M
TUBB
0.4278037
G2/M
TUBB4B
0.4368572
G2/M
UBE2C
0.6418814
phase M M M M M M M M M M M M M M M M M M M M M M M M M M M M M M M M M M M M M M M M M M M M M M M M M M M M-G1 M-G1 M-G1 M-G1 M-G1 M-G1 M-G1 M-G1 M-G1 M-G1 M-G1 M-G1 M-G1 M-G1 M-G1 M-G1 M-G1 M-G1 M-G1
Symbol AKIRIN2 ANLN ANP32B ANP32E ARL6IP1 AURKA BIRC5 BUB1 CCNA2 CCNB2 CDC20 CDC25B CDCA3 CENPA CENPE CENPF CKAP2 CKS1B CKS2 DEPDC1 DEPDC1B DLGAP5 DNAJA1 FAM64A GAS2L3 GTSE1 HMGB3 HMMR HN1 HSPA8 KIF2C KIF5B KIF20B LBR MKI67 MZT1 NEK2 NUF2 NUSAP1 PBK PLK1 PRR11 RBM8A SFPQ SGOL2 SRSF3 TACC3 THRAP3 TPX2 TTK TUBB4B ANP32E CDKN3 DKC1 DYNLL1 GRPEL1 HSPA8 ILF2 KIF5B LYAR MORF4L2 MRPS18B NUCKS1 NUP37 PBK PRC1 PTTG1 RAD21 RAN SRSF3
R 0.2031315 0.2958071 0.2541205 0.255035 0.628574 0.6092834 0.3754414 0.2367238 0.5522542 0.5141196 0.6619391 0.2580322 0.4926722 0.476688 0.4081029 0.5463907 0.3407493 0.2007793 0.49405 0.475011 0.2824315 0.2684237 0.2247345 0.4000655 0.229844 0.3815512 0.3296062 0.525004 0.3157104 0.4904216 0.310216 0.3977087 0.3202733 0.2530543 0.3967232 0.2896028 0.4019897 0.407485 0.5026313 0.2675716 0.6684096 0.2214031 0.2013137 0.2199022 0.4225035 0.2975546 0.2837015 0.2032257 0.5248069 0.2213745 0.5222375 0.259491 0.47832 0.2441299 0.3258742 0.2068026 0.4251107 0.3342597 0.2619027 0.2317684 0.3570747 0.2187978 0.3798808 0.2350708 0.2099027 0.2334793 0.6069561 0.258954 0.4816124 0.3415955
Supplemental Table S4, A list of the 28 genes included in the PC9 module “lightsteelblue1”. gene symbol CENPA SGOL2 CKAP2L RAD21 CNTRL
NCBI gene id NM_001042426,NM_001809 NM_001160033,NM_001160046,NM_152524 NM_001304361,NM_152515 NM_006265 NM_007018 NM_001048166,NM_001282936,NM_001282937,NM_001282938,NM_001282 STIL 939,NM_003035 POLH NM_001291969,NM_001291970,NM_006502 GPSM2 NM_013296 TTK NM_001166691,NM_003318 NUF2 NM_031423,NM_145697 LARGE NM_004737,NM_133642 HMMR NM_001142556,NM_001142557,NM_012484,NM_012485 KIFC1 NM_002263 AURKA NM_003600,NM_198433,NM_198434,NM_198435,NM_198436,NM_198437 BUB1 NM_001278616,NM_001278617,NM_004336 PIF1 NM_001286496,NM_001286497,NM_001286499,NM_025049 TROAP NM_001100620,NM_001278324,NM_005480 TRAIP NM_005879 IFNAR1 NM_000629 DEPDC1 NM_001114120,NM_017779 SPDL1 NM_017785 NCAPG NM_022346 ERN2 NM_033266 KNSTRN NM_001142761,NM_001142762,NM_033286 CKAP2 NM_001098525,NM_001286686,NM_001286687,NM_018204 FAM72B NM_001100910 CENPE NM_001286734,NM_001813 HACD4 NM_001010915 KIF14 NM_014875 CDC25C NM_001287582,NM_001287583,NM_001790,NM_022809 CDCA2 NM_152562 RNF26 NM_032015 PSRC1 NM_001005290,NM_001032291,NM_032636 GAS2L3 NM_001303130,NM_001303131,NM_174942 KIF15 NM_020242 ESPL1 NM_012291 AURKAPS1 NR_001587 HMMR-AS1 NR_109892
Supplemental Table S5, Result of the gene ontology term enrichment analysis of the module “lightsteelblue1”.
rank 1 2 3 4 5 6 7 8 9 10
enrichmentP 6.42E-16 4.05E-15 4.81E-15 5.98E-15 6.21E-15 2.80E-13 4.95E-12 7.64E-12 4.02E-11 1.68E-10
BonferoniP 9.45E-12 5.95E-11 7.08E-11 8.79E-11 9.13E-11 4.12E-09 7.28E-08 1.12E-07 5.91E-07 2.47E-06
termID GO:0022402 GO:0000278 GO:0007067 GO:0007059 GO:0051301 GO:0007049 GO:0007017 GO:0000819 GO:0005819 GO:0015630
termOntology BP BP BP BP BP BP BP BP CC CC
termName cell cycle process mitotic cell cycle mitotic nuclear division chromosome segregation cell division cell cycle microtubule-based process sister chromatid segregation spindle microtubule cytoskeleton
Supplemental Table S6, A list of the 125 genes included in the PC9 module “magenta”. Gene Symbol COG3 ZNF845 PLD1 DUSP1 RGCC TRIM52 HMOX1 PITX2 GDPD1 RNF2 WDR78 JMY ELF1 NAV2 ASAP3 ASB7 ATXN7 PSG8 PARP16 ACTG1 PRR34 SNAI2 C19orf73 CCDC153 TFEB GSDMB GTDC1 TMEM14C RAB42 THBD KPNA5 PLCE1 CFHR1 KBTBD6 KRTAP2-1 OSTM1 CSRP3 HDAC10 SYTL3 ATF3 ARHGEF37 ANO8 HIST1H2AI CFP EPM2AIP1 SAMD4A KRTAP2-4 KRTAP2-2 TSSK2 PTGER4 CCNT1 FAM209A SGK1 CCDC18 GAS1 TDRP RND3 RHOB KRTAP2-3 CLEC2B SLC22A20 SPTBN2 TNFRSF10D CDK18 NFIL3
NCBI gene id NM_031431 NM_138374 NM_001130081,NM_002662 NM_004417 NM_014059 NM_032765 NM_002133 NM_000325,NM_001204397,NM_001204398,NM_00120439 9,NM_153426,NM_153427 NM_001165993,NM_001165994,NM_182569 NM_007212 NM_024763,NM_207014 NM_152405 NM_001145353,NM_172373 NM_001111018,NM_001111019,NM_001244963,NM_145117 ,NM_182964 NM_001143778,NM_017707 NM_024708,NM_198243 NM_000333,NM_001128149,NM_001177387 NM_001130167,NM_001130168,NM_182707 NM_017851 NM_001199954,NM_001614 NM_018280 NM_003068 NM_018111 NM_001145018 NM_001167827,NM_001271943,NM_001271944,NM_00127 1945,NM_007162 NM_001042471,NM_001165958,NM_001165959,NM_01853 0 NM_001006636,NM_001164629,NM_001284233,NM_00128 4234,NM_001284235,NM_001284238,NM_024659 NM_001165258,NM_016462 NM_001193532,NM_152304 NM_000361 NM_002269 NM_001165979,NM_001288989,NM_016341 NM_002113 NM_152903 NM_001123387 NM_014028 NM_003476 NM_001159286,NM_032019 NM_001009991,NM_001242384,NM_001242394,NM_00124 2395 NM_001030287,NM_001040619,NM_001206484,NM_00120 6486,NM_001206488,NM_001674 NM_001001669 NM_020959 NM_003509 NM_001145252,NM_002621 NM_014805 NM_001161576,NM_001161577,NM_015589 NM_033184 NM_033032 NM_053006 NM_000958 NM_001240,NM_001277842 NM_001012971 NM_001143676,NM_001143677,NM_001143678,NM_00129 1995,NM_005627 NM_206886 NM_002048 NM_001256113,NM_175075 NM_001254738,NM_005168 NM_004040 NM_001165252 NM_005127 NM_001004326 NM_006946 NM_003840 NM_002596,NM_212502,NM_212503 NM_001289999,NM_001290000,NM_005384
Gene Symbol HIST1H2AJ TULP2 SBNO2 ID4 VAMP4 TMEM65 TRPV4 DCUN1D4 WDSUB1 PUS10 AOC2 PKP1 IL6 LRRC69 SLC2A10 COL17A1 AMIGO3 IFNE ATP6AP1L RARA MYLIP RNF38 ANKRD65 SCRN3 GLP2R SOCS6 AQP11 FBXO32 IRGQ MAST4 IGIP ACAD10 ZNF248 GPR25 ZFP36 TRAPPC8 UPRT CELSR2 FOXJ2 TMEM81 LOC100130331 ZNF197-AS1 LOC155060 LINC00511 LOC100126784 LOC101927571 MIR6792 DKFZP434I0714 LOC283440 PPP1R26-AS1 LOC100379224 PAN3-AS1 LOC101927267 PIK3IP1-AS1 LINC01006 MIR6880 MIR1231 LOC102724000 ACTG1P20 AGBL5-AS1
NCBI gene id NM_021066 NM_003323 NM_001100122,NM_014963 NM_001546 NM_001185127,NM_003762 NM_194291 NM_001177428,NM_001177431,NM_001177433,NM_02 1625,NM_147204 NM_001040402,NM_001287755,NM_001287757,NM_0 15115 NM_001128212,NM_001128213,NM_152528 NM_144709 NM_001158,NM_009590 NM_000299,NM_001005337 NM_000600 NM_001129890 NM_030777 NM_000494 NM_198722 NM_176891 NM_001017971 NM_000964,NM_001024809,NM_001145301,NM_0011 45302 NM_013262 NM_022781,NM_194328,NM_194329,NM_194330,NM_ 194332 NM_001145210,NM_001243535,NM_001243536 NM_001193528,NM_024583 NM_004246 NM_004232 NM_173039 NM_001242463,NM_058229,NM_148177 NM_001007561 NM_001164664,NM_001290226,NM_001290227,NM_0 01290228,NM_001297651,NM_015183,NM_198828 NM_001007189 NM_001136538,NM_025247 NM_001267597,NM_001267605,NM_001267606,NM_0 01267607,NM_021045 NM_005298 NM_003407 NM_014939 NM_145052 NM_001408 NM_018416 NM_203376 NR_027247 NR_046658 NR_036573 NR_033876 NR_015384 NR_110782 NR_106850 NR_033797 NR_033958 NR_038969 NR_033341 NR_029383 NR_120449 NR_110542 NR_103858 NR_106940 NR_031599 NR_121615 NR_033926 NR_046730
Supplemental Table S7, Result of the gene ontology term enrichment analysis of the module “magenta”. rank 1 2 3 4 5
enrichmentP 9.01E-06 0.00013173 0.000143901 0.000225331 0.000393841
BonferoniP 0.132589083 1 1 1 1
termID GO:0006959 GO:0002366 GO:0002286 GO:0050710 GO:0045630
termOntology BP BP BP BP BP
6
0.000445651
1
GO:0001078
MF
7 8 9 10
0.000463626 0.000529063 0.000548049 0.000548049
1 1 1 1
GO:0000982 GO:0008081 GO:0006956 GO:0042093
MF MF BP BP
termName humoral immune response leukocyte activation involved in immune response T cell activation involved in immune response negative regulation of cytokine secretion positive regulation of T-helper 2 cell differentiation RNA polymerase II core promoter proximal region sequence-specific DNA binding transcription factor activity involved in negative regulation of transcription RNA polymerase II core promoter proximal region sequence-specific DNA binding transcription factor activity phosphoric diester hydrolase activity complement activation T-helper cell differentiation
Supplemental Table S8, A gene list of the module II-18 “red” Gene symbol CCNO AKR1A1 ATP6V0E1 CDKN2B ASAH1 CSF1 SOX4 HIST2H2BE ALG1L DSTN HLA-A BMF HIST1H2BD
NCBI gene id NM_021147 NM_001202413,NM_001202414,NM_006066,NM_153326 NM_003945 NM_004936,NM_078487 NM_001127505,NM_004315,NM_177924 NM_000757,NM_172210,NM_172211,NM_172212 NM_003107 NM_003528 NM_001015050,NM_001195223 NM_001011546,NM_006870 NM_001242758,NM_002116 NM_001003940,NM_001003942,NM_001003943,NM_033503 NM_021063,NM_138720 NM_001256658,NM_001256659,NM_001256660,NM_00125666 1,NM_001256662,NM_003598 TEAD2 ANXA4 NM_001153 GOLGA2 NM_004486 MXD4 NM_006454 NM_001258320,NM_001258321,NM_001258322,NM_00125832 3,NM_001258324,NM_006034 TP53I11 NM_001113182,NM_001199455,NM_001199456,NM_00129198 6,NM_005104 BRD2 CERS4 NM_024552 HLA-C NM_001243042,NM_002117 KDR NM_002253 B2M NM_004048 CORO1B NM_001018070,NM_020441 CETN2 NM_004344 MSMO1 NM_001017369,NM_006745 EFNA1 NM_004428,NM_182685 CEACAM3 NM_001277163,NM_001815 BPHL NM_001302777,NM_004332 ATP6V1G1 NM_004888 EIF2AK1 NM_001134335,NM_014413 PCGF3 NM_006315 SMIM14 NM_174921 SRSF8 NM_032102 TMEM150A NM_001031738 TMEM219 NM_001083613,NM_194280 ICA1 NM_001136020,NM_001276478,NM_004968,NM_022307 CLSTN3 NM_014718 ERGIC3 NM_015966,NM_198398 ITM2B NM_021999 TMEM230 NM_001009923,NM_001009924,NM_001009925,NM_014145 TMEM263 NM_152261 YIPF3 NM_015388 TMEM59 NM_004872 SEC22B NM_004892 CLDN4 NM_001305 WBP1 NM_012477 ARF4 NM_001660 FAM114A1 NM_138389 CEACAM5 NM_001291484,NM_004363 LSS NM_001001438,NM_001145436,NM_001145437,NM_002340 CHMP1B NM_020412 NM_001287742,NM_001287743,NM_001287744,NM_00128774 5,NM_001287747,NM_001287748,NM_001287749,NM_001287 750,NM_001287751,NM_001287756,NM_004462 FDFT1 SDPR NM_004657 GSTA4 NM_001512 PERP NM_022121 SLC5A2 NM_003041 GPR110 NM_025048,NM_153840 HLA-B NM_005514 ERV3-1 NM_001007253 SND1 NM_014390 CCS NM_005125 RNF144B NM_182757 CCNG2 NM_004354
Gene symbol PLEKHB1 HLA-F SRI TMED9 PDCD4 SC5D BET1 GOLGB1 TTC3 OAZ2 ELF3 SCARB2 IFT57 ST13 LRIG1 ATP6AP1 ALDH3B1 PELI1 CREB3 SQLE COPA MIR205HG NICN1 CBLB UBE2R2 MAGED1 STEAP4 KDELR1 WIPI2 HMGCS1 INSIG1 HLA-G GNAL NARF SCD MOSPD3 KLHL24 SMPDL3B TKT HBP1 CAPN1 UBXN1 PBXIP1 DPP3 DNAJC4 YPEL5 TMPRSS2 SEC24C PARP14 PPAPDC1B LITAF RPL4 ST8SIA4 C16orf58 NIPSNAP1 PON2 LOC102723885 LOC101927043 CIRBP-AS1 ZNF528-AS1 MIR4800 LOC440173 HLA-J HLA-H ST13P4 UGDH-AS1 ZNRD1-AS1 INO80B-WBP1
NCBI gene id NM_001130033,NM_001130034,NM_001130035,NM_001 130036,NM_021200 NM_001098478,NM_001098479,NM_018950 NM_001256891,NM_001256892,NM_003130,NM_198901 NM_017510 NM_001199492,NM_014456,NM_145341 NM_001024956,NM_006918 NM_005868 NM_001256486,NM_001256487,NM_001256488,NM_004 487 NM_001001894,NM_003316 NM_001301302,NM_002537 NM_001114309,NM_004433 NM_001204255,NM_005506 NM_018010 NM_001278589,NM_003932 NM_015541 NM_001183 NM_000694,NM_001030010,NM_001161473,NM_001290 058,NM_001290059 NM_020651 NM_006368 NM_003129 NM_001098398,NM_004371 NM_001104548 NM_032316 NM_170662 NM_017811 NM_001005332,NM_001005333,NM_006986 NM_001205315,NM_001205316,NM_024636 NM_006801 NM_001033518,NM_001033519,NM_001033520,NM_001 278299,NM_015610,NM_016003 NM_001098272,NM_002130 NM_005542,NM_198336,NM_198337 NM_002127 NM_001142339,NM_001261443,NM_001261444,NM_182 978 NM_001038618,NM_001083608,NM_012336,NM_031968 NM_005063 NM_001040097,NM_001040098,NM_001040099,NM_023 948 NM_017644 NM_001009568,NM_001304579,NM_014474 NM_001064,NM_001135055,NM_001258028 NM_001244262,NM_012257 NM_001198868,NM_001198869,NM_005186 NM_001286077,NM_001286078,NM_015853 NM_020524 NM_001256670,NM_005700,NM_130443 NM_005528 NM_001127399,NM_001127400,NM_001127401,NM_016 061 NM_001135099,NM_005656 NM_004922,NM_198597 NM_017554 NM_001102559,NM_001102560,NM_032483 NM_001136472,NM_001136473,NM_004862 NM_000968 NM_005668,NM_175052 NM_022744 NM_001202502,NM_003634 NM_000305,NM_001018161 NR_120517 NR_110207,NR_110208 NR_027271 NR_125345 NR_039964 NR_027471 NR_024240 NR_001434 NR_002183 NR_047679 NR_026751 NR_037849
Supplemental Table S9, Number of cells used in WGCNA and hierarchal clustering
DMSO
gefitinib
PC9
44
17
II-18
47
44
H1650
45
47
H1975
47
46
H2228
47
45
total
230
199