800°C. Figures 12(a) and 12(b) show the same maps of the ... ple just after 70% reduction at 800°C was 66% and just after 70% ..... Hagané, 70 (1984), 2112.
ISIJ International, Vol. 47 (2007), No. 10, pp. 1475–1484
Combined Macro–Micro Modeling for Rolling Force and Microstructure Evolution to Produce Fine Grain Hot Strip in Tandem Hot Strip Rolling Toshiharu MORIMOTO,1) Fuyuki YOSHIDA,1) Ichiro CHIKUSHI1) and Jun YANAGIMOTO2) 1) Steel Research Department, Nakayama Steel Works, LTD., 1-1-66 Funamachi, Taisho-ku, Osaka 551-8551 Japan and Environmental Conscious Ultra-Fine-Grained Steel Consortium of JRCM (The Japan Research and Development Center of Metals). 2) Institute of Industrial Science, The University of Tokyo, 4-6-1 Komaba, Meguro-ku, Tokyo 153-8505 Japan and Environmental Conscious Ultra-Fine-Grained Steel Consortium of JRCM (The Japan Research and Development Center of Metals). (Received on May 24, 2007; accepted on August 16, 2007 )
T.M.C.P. (Thermo Mechanical Control Process) has been widely used in the steel industry. We have produced fine grain hot strips industrially through high reduction and low temperature asymmetric rolling which decreases rolling force by generating a cross shear zone. We needed combined macro–micro model to predict rolling force in the finishing train and microstructure evolution of fine grain hot strips. First, deformation analysis model, an asymmetric rolling theory based on numerical analysis using Orowan’s theory was proposed. Second, to obtain the material data for the kinetics of microstructure change in the low temperature austenite region, the compression tests were performed and we measured recrystallization ratio by EBSD (Electron back scattering diffraction). Third, microstructure evolution model to formulate the ferrite transformation using the intragranular nucleation was introduced. Accuracy of the new combined macro–micro model for rolling force and microstructure evolution was very excellent and it enabled us to confirm dynamic ferrite transformation occurrence during high reduction low temperature rolling at the actual tandem hot strip mill. KEY WORDS: rolling; fine grain hot strip; asymmetric rolling; material data; intragranular nucleation; dynamic ferrite transformation.
1.
cal analysis of asymmetric rolling that was applied for the last three stands in the finishing train was inadequate. The asymmetric rolling causes the neutral points of the upper and lower rolls to move in opposite directions to each other, consequently it develops a cross-shear zone that cuts friction hills and lessens rolling load and rolling torque. So it is important to estimate rolling force ratio of asymmetric rolling by conventional rolling. Hence, a solution that accepts differential stresses in the vertical direction has been derived with regards to the total equilibrium of rotational moments in the cross-shear zone.7) Next, we obtain the material data for the kinetics of microstructure change in low temperature austenite region by the compression test and EBSD (Electron back scattering diffraction) measurement. Generally, the temperature region under 1 123 degrees is called non-recrystallized austenite region, but we confirmed that fine austenite recrystallize quickly with large strains in the low temperature austenite region. The second problem was the estimation accuracy of the fine grain ferrite size resulting from high reduction low temperature rolling at the tandem hot strip mill, as the ferrite transformation analysis was based on a classic nucleation-growth theory from austenite grain boundaries.8,9) The austenite grains rolled in a high reduction low tempera-
Introduction
Thermo-mechanical controlled rolling process (TMCP), which optimizes rolling temperature, pass schedule and cooling pattern to produce fine ferrite-pearlite steels, has been widely used for a long time in the steel industry.1–3) Today, this process has evolved to produce fine grain hot strips by high reduction low temperature rolling, using single roll driven mills and inter-stand coolers in the finishing train of a tandem hot strip mill.4,5) Figure 1 shows the layout of the Nakayama tandem hot strip mill. The rolling force at the last three stands in high reduction low temperature rolling is greater than that of conventional rolling. Therefore, it is important to estimate rolling force so that the rolling schedule can produce fine grain hot strips within mill specifications. Also, the possible effects of rolling schedule on the microstructure of hot strip must be estimated with accuracy. To make these estimates, we have developed a macro–micro combined model6) that can consistently analyze rolling force, rolling temperature and microstructure evolution. This combined model, however, has been found to have two major problems. First, the rolling force estimated in high reduction low temperature was not accurate enough because the theoreti1475
© 2007 ISIJ
ISIJ International, Vol. 47 (2007), No. 10
Fig. 1. Schematic illustration of Nakayama tandem hot strip mill.
Table 1. Nomenclature.
Table 2. Chemical compositions of the plain carbon steels used for the actual tandem hot strip rolling.
ture condition allow ferrite nucleation not only on the austenite grain boundaries but also in deformed zones of the austenite grains. Hence, we used a micro-model10,11) that accommodates intragranular dislocation and dislocation cells as ferrite nucleation sites. These three improvements aimed to improve estimation accuracy of the combined macro–micro model for rolling force and for microstructure evolution in high reduction low temperature rolling.
© 2007 ISIJ
2.
Rolling Experiment
2.1. Rolling Force Table 2 presents chemical composition used for actual rolling. All three steels are of C–Si–Mn composition of a high manganese content. Table 3 lists rolling schedules. The rolling reduction was set in two levels: 40% at each the F4, F5, and F6 stand was called high reduction rolling; and 20% at each the F4, F5, and F6 stand was called low reduction rolling. The strain rate at F6 was approximately 200/s, and rolling time at F6 was 0.003 s in high reduction rolling 1476
ISIJ International, Vol. 47 (2007), No. 10 Table 3. Two different conditions in the actual tandem hot strip rolling fabricating the strips with different ferrite grain sizes.
Fig. 2. Analytical temperature transition of two different rolling schedules in the actual tandem hot strip rolling. (a), (b) and (c) mean Steel A, Steel B and Steel C respectively.
and 0.001 s in low reduction rolling. In high reduction rolling, cooling was provided to absorb plastic heat both between stands and immediately after the final stand, F6. Figures 2(a), 2(b) and 2(c) show changes in temperature during high and low reduction rolling in the finish train. The exit temperature in the finishing train was practically the same under high and low reduction rolling. In all cases, the rolling temperature at the final stand was near Ae3. Figures 3(a) and 3(b) show measured rolling load for the trial steels. Among steels A, B, and C, no significant difference was found in rolling load. Under low reduction rolling, rolling reduction was 20% at the each of the last three stands and the rolling load increase, whereas under high reduction rolling, rolling reduction was 40% at the each of the last three stands and the rolling load stayed constant for
the most part. That was to say, low reduction rolling accumulated strain at the last three stands, whereas the high reduction rolling did not accumulate strain. Furthermore, the rolling load at the F6 stand remained practically the same at 15 000 kN/m under both high and low reduction rolling. Figures 4(a) and 4(b) show rolling pressure distributions obtained by retrospectively calculating of the measured rolling load. Figures 5(a) and 5(b) further calculated the flow stress, retrospectively by the macro model with asymmetric rolling. We’ll explain asymmetric rolling effect at the Sec. 3.1. From these calculations, it can be confirmed that the average flow stress at the F6 stand was approximately 540 MPa in low reduction rolling and 340 MPa in high reduction rolling.
1477
© 2007 ISIJ
ISIJ International, Vol. 47 (2007), No. 10
Fig. 3. Measured rolling force of two different rolling schedules in the actual tandem hot strip rolling. (a) is the low reduction schedule and (b) is the high reduction schedule.
Fig. 4. Calculated stress distribution backward from the measured rolling force of two different rolling schedules in the actual tandem hot strip rolling by the new asymmetric rolling theory. (a) is the low reduction schedule and (b) is the high reduction schedule.
Fig. 5. Calculated flow stress backward from measured rolling force of two difference rolling schedules in the actual tandem hot strip rolling by the new asymmetric rolling theory. (a) is the low reduction schedule and (b) is the high reduction schedule.
3.
2.2. Grain Refinement during and after Rolling Figures 6(a), 6(b) and 6(c) show the microstructure of high reduction rolling. Ferrite gain size was about 2 to 3 m m with a fine ferrite-pearlite structure.
© 2007 ISIJ
3.1.
Discussion
Effect of Asymmetric Rolling to the Deviation in Rolling Force Figure 7(a) shows a schematic diagram of stress distribution throughout the roll bite in symmetric rolling. The 1478
ISIJ International, Vol. 47 (2007), No. 10
Fig. 6. SEM microstructures of high reduction schedule by the actual tandem hot strip rolling. (a), (b) and (c) mean Steel A, Steel B and Steel C respectively.
Fig. 8. (a) Load decrement ratio and (b) Torque decrement ratio of asymmetric rolling by conventional rolling, calculated by the new asymmetric rolling theory and by Finite Element Method.
shear (hereinafter, “CS”) zone, the direction of frictional shear stress from the upper and lower rolls reverses and CS reduces rolling force and rolling torque. From Fig. 7(b) of the cross-shear zone, we can assume that rotational moment around the centroid is caused by frictional shear stress. In the actual rolling, however, even if the rolled strip warps, it does not occur that the strip cannot be rolled because it has rotational angular acceleration. In other words, this rotational moment is always 0. Thus, we decided to introduce the moment around the centroid by vertical stress s yy to negate the moment by friction shear stress. Figures 8(a) and 8(b) present the results of a comparison of rolling load and torque percent decrease between the present analytical method and the finite element method.14) The percent decrease of rolling load and torque refers to the ratio of asymmetric rolling to symmetrical rolling. These graphs demonstrate that our new analytical method can estimate rolling force with high accuracy.
Fig. 7. Schematic illustration which demonstrates roll pressure distribution in the roll bite in (a) conventional rolling and (b) asymmetric rolling.
vertical stresses on roll surfaces and the locations of neutral points are equal between the upper and lower rolls. The rolling direction stress balance equation for symmetric rolling of Orowan’s theory12) is; df (φ ) � 2 Rp(φ ) sin φ m 2 Rτ f cos φ ..............(1) dφ Thus, the neutral point and the maximum point of rolling pressure coincide with each other in symmetric rolling. The rolling direction stress balance equation in asymmetric rolling, however, can be expressed as follows, if the magnitudes of frictional shear stress on the upper and lower roll surfaces in the cross-shear zone are equal to one another at position x.
3.2.
Effect of Recrystallization to the Deviation of Rolling Force 3.2.1. Recrystallization in Austenite Phase During Rolling To improve the prediction accuracy of rolling force in high reduction low temperature, we obtained material data for the kinetics of microstructure changes in the low temperature austenite region. Figure 9 shows mechanical heat patterns. The compression test piece was a cylinder of 8 mm diameter and 12 mm height. Axial reductions were from 40 to 80%. In the center of the test piece, strain was 1.2 by 70% reduction and 1.6 by 80% reduction. Strain rate
df (φ ) � 2 Rp(φ ) sin φ .........................(2) dφ This indicates that no pressure hill develops in the crossshear zone. Thus, asymmetric rolling hinders the neutral point of each roll from becoming the maximum point of rolling pressure. Figure 7(b) shows a schematic diagram of stress distribution in a roll bite in single roll-driven rolling.7,13) For the present discussion, let us assume that the upper roll is idle and the lower roll is driven. In the cross1479
© 2007 ISIJ
ISIJ International, Vol. 47 (2007), No. 10
was 30/s. The material composition was 0.15C–0.20Si– 2.0Mn wt%, which was stable austenite at 750°C and could be easily frozen by water just after compression. This composition was as same as the steel A at Table 1. We observed the microstructure at the center thickness and width center of pieces. Here is a brief explanation of the conventional way of counting the recrystallization ratio. Because recrystallized grains are equi-axial, non-recrystallized ones are oval and deformed. The former exist near to the latter. Observations were made of the optical microstructure of hot compression samples. However, this sometimes resulted in an erroneous
recrystallization ratio. Moreover, it was difficult to determine recrystallized grains in high reduction and low temperature compression since austenite grains become fine. Figures 10(a) and 10(b) show optical microstructure of compression test samples. Therefore, an attempt was made to quantify the recrystallization ratio by EBSD. Figure 11(a) shows an image quality map and Fig. 11(b) shows a recrystallization map that take notice of the sub-grain density of a water quenched sample just after 70% reduction at 800°C. Figures 12(a) and 12(b) show the same maps of the water quenched sample just after 70% reduction at 750°C. As seen by the finer recrystallized grains and fine nonrecrystallized grains, it was very easy to distinguish both grains. The recrystallized ratio of the water quenched sample just after 70% reduction at 800°C was 66% and just after 70% reduction at 750°C was 51%. These values contained both the dynamic recrystallization ratio and static recrystallization ratio because even if a piece was cooled immediately after reduction without any time lag, it took from 0.2 to 0.3 s to freeze the center of the piece from the surface of the piece. Figure 13 shows the good accuracy of predicting recrystallized ratio. Here, Eq. (3)15) was used for the static recrystallized rate under 1 123 K and Eq. (4)16) for the static recrystallized rate over 1 123 K.
Fig. 9. Hot compression schedule by the conventional hot compression machine, which of strain rates are 30/s. Interval time between compression and water quench are form 0 to 5 s.
Fig. 10. Optical microstructure of compression test sample (a) Compression temperature is 800°C, axial reduction is 70 % and is cooled by water just after compression. (b) Compression temperature is 750°C, reduction is 70% and is cooled by water just after compression.
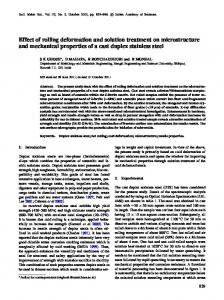
Fig. 12. (a) Image quality map of compression test sample by EBSD and (b) Recrystallized map using sub grain boundary density. Compression temperature is 750°C, reduction is 70% and is cooled by water just after compression. Analyzed area is 80�110 m m.
Fig. 11. (a) Image quality map of compression test sample by EBSD and (b) Recrystallized map using sub grain boundary density. Compression temperature is 800°C, axial reduction is 70 % and is cooled by water just after compression. Analyzed area is 80�110 m m.
© 2007 ISIJ
1480
ISIJ International, Vol. 47 (2007), No. 10
Fig. 13. Prediction accuracy of recrystallized ratio by the micro model using adjustable material data. (a) The compression temperature is 750, 800 and 850°C and are water quenched just after compression and (b) The compression temperature is 800°C and have a few seconds interval time between compression and water quench.
t0.5�0.286 · 10�7 · Sv�0.5 · e˙�0.2 · e �2 exp(18 000/T) ....(3)
the carbon atoms in the austenite grains. Assuming that ferrite grains are spherical, the ferrite grain growth rate Gr can be expressed by Eq. (10).
t0.5�2.2 · 10�12 Sv�0.5 · e˙�0.2 · e �2 exp(30 000/T) ......(4) Sv�24/p /dg ·{0.491 exp(e )�0.155 exp(�e ) �0.1433 exp(�3e )} ..........................(5)
D Cγ �C0 Gr � r Cγ �Cα
These results suggested that high reduction rolling at a relatively low speed in a low temperature austenite region promoted recrystallization during inter-pass and rolling force would decrease. Dynamic Ferrite Transformation During Rolling Using the Intragranular Nucleation Model11) Bailey and Hirsh17) showed that shear stress t and dislocation density r of a deformed structure have a relationship among each other as represented by Eq. (6). Dislocation cells are generated during heavy deforming processes, and Rag and Pharr18) showed that the shear stress and dislocation cell size dcb have a relationship between each other as represented by Eq. (7). Thus, the relationship between dislocation cell size and dislocation density can be obtained from Eq. (8). — t �t 0�a Gb√ r ..............................(6)
6X dα � d cb π
In ferrite transformation from the dislocation cell structure generated by heavy deforming, the ferrite nucleation frequency reaches saturation, and, thus, ferrite transformation spreads in all directions from the dislocation cell, prompting grains to grow. The ferrite volume fraction X can, thus, be expressed by Eq. (9). Gdt 0
∫
� 1 ....(10)
1/ 3
..........................(11)
To formulate metallurgical phenomena at the final stand, F6, in high reduction low temperature rolling near Ae3, we examined ferrite transformation during rolling at the F6 stand using an intragranular nucleation model. Figures 14(a) and 14(b) show free energy diagrams of austenite and ferrite of 0.15C–0.20Si–1.50Mn (wt%) at Ae3, respectively, that simulated strips rolled at the F6 stand. When austenite was given an energy of 161 J/mol, the free energy line of austenite intersected the free energy line of ferrite at 0.15C wt%, reaching point T0. T0 means the temperature at which austenite and ferrite have same free energies. When 1 049 J/mol was given, austenite transforms into single phase ferrite. However, the free energy of austenite could not increase that much even if the energy of the dislocation cell was taken into consideration, and , thus, the diffusion transformation was reasonable as represented by the intragranular transformation model. As for ferrite transformation during rolling, Yada et al.19–21) have proposed massive transformation. By assuming pipe diffusion due to dislocation cells generated inside the grains, however, it was possible that ferrite of 1 m m or so transforms in as short a time as 0.003 s.22) As flow stress of ferrite is less than that of austenite, rolling force would decrease. As for the ferrite grain growth after transformation, it can be assumed to obey the third-power rule by Eq. (12).
t �t 0�KGb/dcb ..............................(7) — dcb�k1/√ r ..................................(8)
t
1/ 3
The ferrite grain size is determined by the dislocation cell diameter and ferrite volume fraction as represented by Eq. (11).
3.2.2.
X (t ) � 1� exp � k 2 ρ
Cγ �C0�2Cα Cγ �C0
2
...............(9)
Carbon atoms discharged from ferrite accumulate on the austenite side of the ferrite-austenite interface and the ferrite grain growth rate is determined by the diffusion rate of 1481
© 2007 ISIJ
ISIJ International, Vol. 47 (2007), No. 10
Fig. 14. Analytical Gibbs free energies of austenite and ferrite, which demonstrate the high reduction rolling at Ae3 temperature. (a) Gg �161 J/mol, (b) Gg �1 049 J/mol.
low reduction rolling, Fig. 16(a) shows the conventional macro–micro model is proven capable of estimating rolling force to a high degree of accuracy with consideration for asymmetric rolling and adjustable material data. But, in high reduction rolling, however, the estimation accuracy of the conventional macro–micro model was low even when considering the asymmetric rolling theory for the last three stands and introducing adjustable material data. At 50% or less the relative estimation accuracy of F6 stand, the model could not formulate metallurgical phenomena well. The new macro–micro combined model with dynamic ferrite transformation using the intragranular nucleation model improved the prediction accuracy of rolling force in F6 stand. Figures 17(a) and 17(b) show the estimation accuracy of rolling load at the F6 stand by the conventional macro– micro combined model and by the new macro–micro combined model respectively. Conventional strips were produced by the conventional schedule rolling in low reduction and high temperature at the last three stands. Fine grain strips were produced by the new schedule rolling in high reduction and low temperature at the last three stands. These graphs indicated that rolling load was estimated well by the new model. Figures 18(a) and 18(b) show the estimation accuracy of ferrite grain size by the conventional macromicro combined model and by the new macro–micro combined model. These graphs indicated that ferrite grain size could be estimated in both conventional strips and fine grain strips. Figure 19 presents the results of analysis by the new macro–micro combined model, made to see which nucleation, intergranular or intragranular, acted dominantly over the other. Conventional schedule rolling was low reduction and high finishing temperature rolling in the last three stands to product conventional hot strips. And new schedule rolling was high reduction and low finishing temperature rolling in the last three stands to product fine grain hot strips. When the residual dislocation density exceeded 3.0�1010 cm/cm3 at a pre-transformation austenite grain size of 10 m m or less, intragranular nucleation became dominant in ferrite transformation. The manufacturing principle of fine grain hot strips obtained by high reduction low temperature rolling at a tandem hot strip mill could be summed up as: high reduction rolling at a relatively low speed in a low temperature
Fig. 15. Combined macro–micro modeling for rolling force and microstructure evolution to product fine grain hot strip in the tandem hot strip rolling.
da (t)3�da 3�k3 exp(�Q/T) · t ..................(12) 3.3.
Micro-scale Analysis of Microstructure Evolution and Rolling Force Figure 15 illustrates the macro–micro combined model for rolling force and microstructure evolution, and analytical elements that constitute the model.23) In the rolling process, various changes occur concurrently; viz. plastic deformation at the roll bite, microstructure changes as a result of recrystallization and transformation both during and after rolling, and temperature changes due to plastic heat and cooling by processing. Moreover, as tandem hot strip rolling is a multi-forming process, these changes are repeated a number of times. To analyze with high accuracy a complex field in which deformation, microstructure changes, and temperature changes interact with each other, we built a macro–micro combined model. Figures 16(a) and 16(b) verify the estimation accuracy of rolling load by the combined macro–micro model. Four results are shown here: measurements, estimation by the conventional macro–micro combined model, estimation by the macro–micro combined model with asymmetric rolling and adjustable material data and estimation by the new macro–micro combined model with the dynamic ferrite transformation using the intragranular nucleation model. In © 2007 ISIJ
1482
ISIJ International, Vol. 47 (2007), No. 10
Fig. 16. Prediction rolling force of two difference rolling schedules at the actual tandem hot strip mill by the asymmetric rolling theory with previous micro model and with Misaka’s equation. (a) is the low reduction schedule and (b) is the high reduction schedule.
Fig. 17. Prediction accuracy of F6 stand rolling force at the actual tandem hot strip mill by (a) previous combined macromicro modeling and by (b) new combined macro–micro modeling.
Fig. 18. Prediction accuracy of ferrite grain size at the actual tandem hot strip rolling by (a) previous combined macro– micro modeling and by (b) new combined macro–micro modeling.
austenite region promoted recrystallization chiefly during inter-pass, eventually making austenite grains finer; then, high reduction rolling near Ae3 at the final F6 stand gave rise to a high dislocation density, thus causing the dislocation cell structure to transform into ferrite. Asymmetric rolling lessens rolling force, and dynamic ferrite transformation during rolling diminishes flow stress. These synergetic effects make possible the industrial production of fine grain hot strips.
4.
Conclusion
(1) Macro process analyses for asymmetric rolling made it possible to obtain flow stress to a higher degree of accuracy from the measurement rolling load. As a result, we confirmed a decrease in flow stress at the F6 stand in high reduction low temperature rolling near Ae3. (2) By adapting a new asymmetric rolling theory and, by adjusting the material data for the kinetics of recrystallization in low temperature austenite region and, by apply1483
© 2007 ISIJ
ISIJ International, Vol. 47 (2007), No. 10
ment Organization (NEDO). We at Nakayama Steel Works, Ltd. are deeply grateful for this great opportunity. REFERENCES 1) I. Kozasu: Trans. Iron Steel Inst. Jpn., 12 (1972), 241. 2) C. Ouchi and T. Okita: Trans. Iron Steel Inst. Jpn., 22 (1982), 543. 3) A. Yoshie, H. Morikawa, Y. Onoe and K. Itoh: Trans. Iron Steel Inst. Jpn., 27 (1987), 425. 4) I. Chikushi, M. Kozaki, R. Kurahashi, M. Takahashi, A. Adachi and S. Takaoka: AISE Steel Technol., 7 (2002), 42. 5) R. Kurahashi, K. Hakomori, I. Chikushi, T. Morimoto and J. Yanagimoto: Rev. Metall. Cah. Inf. Tech., 102 (2005), 271. 6) J. Yanagimoto, T. Morimoto, I. Chikushi and R. Kurahashi: Steel Res., 73 (2002), 56. 7) T. Morimoto, F. Yoshida, I. Chikushi and J. Yanagimoto: Tetsu-toHagané, 92 (2006), 601. 8) J. Liu, A. Yanagida, S. Sugiyama and J. Yanagimoto: ISIJ Int., 41 (2001), 1510. 9) J. Yanagimoto: Model. Simul. Mater. Sci. Eng., 10 (2002), R111. 10) J. Yanagimoto, A. Yanagida and J. S. Liu: Proc. of 8th ICTP, EDIZIONI PROGETTO PADOVA, Padova, Italy, (2005), 401. 11) J. Yanagimoto, Y. Kobayashi and A. Yanagida: Steel Res., 78 (2007), in press. 12) E. Orowan: Proc. Inst. Mech. Eng., 150 (1943), 140. 13) R. L. Holbrook and C. F. Zorowski: J. Eng. Ind., 88 (1966), 401. 14) J. Yanagimoto, Y. Kadomura, T. Muto and K. Inoue: Steel Res., 73 (2002), 526. 15) T. Senuma, H. Yada, Y. Matsumura and T. Futamura: Tetsu-toHagané, 70 (1984), 2112. 16) H. Yada: 131st and 132nd Nishiyama Memorial Seminar, ISIJ, Tokyo, (1989), 149. 17) J. E. Bailey and P. B. Hirsch: Philos. Mag., 5 (1960), 485. 18) S. V. Raj and G. M. Pharr: Mater. Sci. Eng., 81 (1986), 217. 19) H. Yada, N. Matsuzu, K. Nakajima, K. Watanabe and H. Tokita: Trans. Iron Steel Inst. Jpn., 23 (1983), 100. 20) Y. Matsumura and H. Yada: Trans. Iron Steel Inst. Jpn., 27 (1987), 492. 21) H. Yada, C. M. Li and H. Yamagata: ISIJ Int., 40 (2000), 200. 22) R. W. Balluffi: Diffusion in Crystalline Soids, Academic Press, London, (1984), 319. 23) T. Morimoto, I. Chikushi, R. Kurahashi and J. Yanagimoto: Tetsu-toHagané, 88 (2002), 45.
Fig. 19. Estimated criterion between nucleation on austenite grain boundaries and nucleation inside austenite grains by combined macro–micro modeling.
ing an intragranular nucleation model, we succeeded in improving the estimation accuracy of rolling force and microstructure evolution in high reduction low temperature rolling at a tandem hot strip mill. (3) Because effect of dynamic transformation to the deviation of rolling force was larger than any other effects, we guessed that a decrease in flow stress at the F6 stand in high reduction low temperature rolling near Ae3 was caused by dynamic ferrite transformation. Acknowledgments This study was carried out as a part of the research activities of the Production Technologies for Environment-Conscious Ultrafine-Grained Steels by The Japan Research and Development Center for Metals (JRCM), commissioned from the New Energy and Industrial Technology Develop-
© 2007 ISIJ
1484