Combining Dissimilarities for Three-Way Data Classification Combinación de disimilitudes para la clasificación de datos de tres vías Diana Porro Muñoz1, 2, Isneri Talavera1, Robert P. W. Duin2, and Mauricio Orozco Alzate3 1
Advanced Technologies Application Center (CENATAV), Cuba 2 Pattern Recognition Lab., TU Delft, The Netherlands 3 Universidad Nacional de Colombia Sede Manizales, Colombia {dporro,italavera}@cenatav.co.cu,
[email protected],
[email protected]
Article received on February 28, 2011; accepted on June 30, 2011 Abstract. The representation of objects by multidimensional arrays is widely applied in many research areas. Nevertheless, there is a lack of tools to classify data with this structure. In this paper, an approach for classifying objects represented by matrices is introduced, based on the advantages and success of the combination strategy, and particularly in the dissimilarity representation. A procedure for obtaining the new representation of the data has also been developed, aimed at obtaining a more powerful representation. The proposed approach is evaluated on two threeway data sets. This has been done by comparing the different ways of achieving the new representation, and the traditional vector representation of the objects. Keywords. Classification, three-way data, combination and dissimilarity representation. Resumen. La representación de objetos a través de arreglos multidimensionales es ampliamente utilizada en muchas áreas de investigación. Sin embargo, el desarrollo de herramientas para clasificar datos con dicho tipo de estructura ha sido insuficiente. En este trabajo se introduce una metodología para clasificar objetos que son representados por matrices, basada en las ventajas y éxitos de la estrategia de combinación y particularmente en la representación por disimilitudes. También se propone el procedimiento para obtener la nueva representación de los datos. La propuesta realizada en este trabajo se evaluó en dos conjuntos de datos tres-vías. Esta evaluación se realizó mediante la comparación entre las diferentes maneras de obtener la nueva representación, y la representación tradicional de los objetos a través de vectores. Palabras clave. Clasificación, datos de tres-vías, combinación y representación por disimilitudes.
1 Introduction As a result of the wide development of technologies in many research fields, more abundant object descriptions are obtained; however they are more complex. Examples include objects for which several related measurements have been done. Those measurements are organized in a three-way array (simplest case); such that objects are in one direction and two different types of variables are in the other two directions of the array. In the past years, some methods capable of dealing with this structure have been proposed, since the data may not be optimally analyzed with traditional (two-way) approaches. However, most of the introduced methods are focused on solving exploratory and regression problems [7, 13]. Classification problems, and therefore tools to face them, have been less explored [7, 1]. What it is mostly done to classify this type of data, consists in unfolding it and building traditional classifiers on the vector (1D) representation of the objects [16]. Consequently, the relationship of the different types of variables is lost and most of the times the dimensionality of the array increases drastically. Another approach is based on using multi-way exploratory analysis tools e.g. PARAFAC [13], and the traditional classification methods are applied on the new obtained representation of the data. However, these exploratory tools have some disadvantag-
Computación y Sistemas Vol. 15 No. 1, 2011 pp 117-127 ISSN 1405-5546
118 Diana Porro Muñoz, Isneri Talavera, Robert P. W. Duin...
es [7], e.g., the analysis is purely numerical; they do not take into account the shape of the represented data and/or spatial relationship of the measurements, which could be discriminative information. Hence, if we could somehow transform this three-way array (taking into account the variables relationship) into a representation of a lower order, where this information could be taken into account, the use of traditional classifiers would be more suitable. Although it seems that so far, combination systems have not been used for three-way data analysis, they have been deeply studied as a way of integrating the information obtained from different representations of objects [6, 7]. These systems emerged with the goal of achieving the best possible classification performance. The combining techniques can be applied by building different classifiers on the different representations of the same objects or by combining these representations e.g. dissimilarities [4, 11], to obtain a more powerful representation of the data. In the studies made on this topic, the combination strategy has proved to perform better in most cases, than by using just one classifier or representation of objects e.g. features or dissimilarities [3, 4, 11]. An approach, for which the combination strategy has also been studied, is that known as Dissimilarity Representation (DR) [12]. In this approach, objects are represented by their dissimilarities to representative objects of the classes. A dissimilarity space is generated by this representation, such that the geometry and the structure of a class are determined by the user-defined dissimilarity measure, in which application background information can be used. In recent studies [9, 10, 14], the advantage of learning from dissimilarities between pairs of objects instead of traditional feature-based data, has been demonstrated for different types of data e.g. spectra. Moreover, the benefits of combining DRs for different applications have been studied [4, 5, 11]. In this paper, given the success of the combination strategy, and more specifically that one of the combination of dissimilarity representations [11], we propose to slice the three-way array through the variables of one direction e.g. a ver-
Computación y Sistemas Vol. 15 No. 1, 2011 pp 117-127 ISSN 1405-5546
tical slice in a three-way array, and compute the DR for each slice such that we take into account the information in the non-sliced direction. In this way, we can analyze the objects in terms of the different variables and combine all that information to obtain a new less complex and more powerful representation to classify them. Thus, this paper is structured as follows. In Section 2, an explanation of the proposed approach will be provided. In Section 3, we give a description of the two three-way data sets we will use to evaluate the proposed approach. Section 4 is dedicated to the experiments and discussions. Comparisons will be made by slicing the three-way data sets in the two directions and combining the DR of each direction independently. The combination of all the DRs from the two directions will also be analyzed. Moreover, results are compared with the traditional feature representation (1D, obtained by unfolding the data) of these objects in order to show the advantages of the proposed approach over this representation. In this section, an analysis by applying a kind of discriminative weighting for each slice is also done, to see how the variable selection can improve the results and/or decrease the computational complexity. Finally, the conclusions of this work will be presented in Section 5.
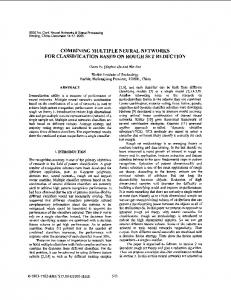
2 Proposed Approach In many research areas e.g. image processing, chemometrics and signal analysis, we can find objects described by different types of measurements. Hence, these objects should be represented by a higher-order generalization of vectors and matrices, in such a way that the multidimensional structure given by these measurements can be analyzed. So, consider that we are in the presence of a classification problem, in which we have a three-way array א ܇Թൈൈ composed of several (l) objects represented by two types of measurements (being m and n the numbers of these two types of variables, see Fig. 1). Consequently, each object will be represented by a matrix א ܑܡԹൈ , on which traditional classifiers cannot operate. Based on the success of the combining procedure, we propose to use it for the classification
Combining Dissimilarities for Three-Way Data Classification 119
of data with this structure. The idea of our approach is to analyze each variable of one of the directions e.g. across second direction for j 1, 2, , m , with respect to (or depending) to the variables of the other direction. This way, we can exploit the relationship between the variables in both directions. Afterwards, the obtained DR of these objects for each of the variables in the analyzed direction are combined. Consequently, we will use the information or structure contained in the matrix to discriminate between the classes. The DR [12] was proposed as a more flexible representation of objects than the feature representation, with the purpose of using the structure of the objects for their classification. In this approach, which was mainly thought for classification purposes, new features are defined for the objects, such that they are represented by their dissimilarities to a set of representative objects of each class. It is based on the role that (dis)similarities play in a class composition, where objects from the same class should be similar and objects from different classes should be different (compactness property). Hence, it should be easier for the classifiers to discriminate between them. It aims at including more information about the characteristics and structure of the objects through a dissimilarity measure. Hence, the first task in the DR is to select a suitable dissimilarity measure for the problem at hand. The fact that it has to be userspecified is a way for the expert to integrate his knowledge and application [12]. Thus, in this approach, given a set of training objects X x1 , x2 , , xl , a representation set (a set of prototypes or representative objects for each class) R r1 , r2 , , rp , and a dissimilarity measure; the distance between each object xi X to each object rh R will be defined as
d xi , rh . The representation set R can be a
subset of X , R X or X itself, being then D X, X a square dissimilarity matrix, or R and X can be completely different sets. There are some approaches to select prototypes of the representation set. See [12] reference for further details.
An object from the training set is then represented by a vector of dissimilarities D xi , R d x1 , r1 , , d xi , rp , which relates it to the prototypes in the representation set. Therefore, in place of the traditional feature matrix א ܆Թൈ , where l runs over the objects and m over the variables, the training set is now represented by the dissimilarity matrix D X, R of size l p , which associates all objects from the training set to all objects from the representation set. We build from this matrix a dissimilarity space ۲ كԹ . Objects are represented in this space by the row vectors of the dissimilarity matrix, such that each dimension corresponds to the dissimilarities with one of the representation objects. Using the DR, classifiers are trained in the space of the dissimilarities between objects, instead of the traditional feature space. Consequently, the relationship between all objects in the training and representation sets is used for the classification. If a suitable measure is chosen, the compactness property of the classes should be more pronounced. Therefore, it should be easier for the classifiers to discriminate between them, such that linear classifiers in the dissimilarity space may correspond to non-linear classifier in the feature space. In general, any arbitrary classifier operating on features can be used [12]. The intuitive idea of this representation, of using the proximities between objects (as features) for discriminating among classes, has demonstrated to be especially advantageous for small sample size problem and highdimensionality feature spaces [12], which are very common characteristics in most research areas e.g. chemometrics. As the dissimilarities are computed to the representation set, it constitutes already a dimensionality reduction and therefore it can be less computationally expensive. Moreover, the combination strategy has also been studied in the DR approach [11, 12] with the purpose of obtaining a more powerful representation of data. Such is the case where the same objects have different representations or it is difficult to define just one dissimilarity measure to take into account all the information for the
Computación y Sistemas Vol. 15 No. 1, 2011 pp 117-127 ISSN 1405-5546
120 Diana Porro Muñoz, Isneri Talavera, Robert P. W. Duin...
problem at hand. Therefore, several dissimilarity matrices can be computed and then combined. In the studies made on this topic, it has been demonstrated that the combination of DRs performs significantly better than by using a single representation of objects [4, 11]. Recently, we extended the DR approach from vectors to 2D arrays [15], but a 2D dissimilarity measure has to be designed for the problem at hand. It would become hard to design a measure in multi-way datasets where there are different types of variables, even in the same direction. Hence, this new procedure can also be applied to data with these characteristics. Moreover, we can make use of the already existent 1D dissimilarity measures (which have been more explored). Moreover, by applying discriminative weights in the combination procedure, a variable selection can be done, such that the non-discriminative variables are not taken into account. Hence, the first step of the proposed approach is to slice the three-way array, either in the second or the third direction. We will obtain for each slice (matrix), a vector representation of all the objects with the variables of the direction that is not sliced; i.e. a matrix X l n for every j variable where j 1, 2,, m , if the slicing is done through the second direction (See Fig. 1). The same holds for the third direction. Hence, we can analyze the objects according to each variable of one direction, but in terms of the variables of the other direction.
into account the information of the other direction, we can analyze how each variable if each direction influences in the discrimination among the classes. An important aspect in this approach is the selection of a proper dissimilarity measure for the problem at hand. Hence, before computing the DR from the matrices obtained in any of the directions, we must find a suitable measure in each case. Considering the three-way array defined, we are not in presence of neither of the previous reasons stated for combining DRs. The variables in the two directions make up together one representation of the object. Nevertheless, when the cube is sliced, the representations obtained from the variables of the analyzed direction could be seen as we had different representations of the same objects. Thus, if we combine all these representations as the third step of our procedure, we can take the information of all of them into account to obtain the desired better representation of the data. For this approach, the three-way array could be sliced in either of the two directions. The combining procedure to obtain the final DR representation could be applied on the slices of one direction, or on all the slices from both directions. Once we have computed the DR for the three-way array, we can use any of the traditional classifiers on it. The combination of the DRs can be done by concatenating all the dissimilarity matrices into a new one e.g. , D1 XR , D2 XR , Dj XR , with j 1, 2,, m , D XR or by applying a combining rule e.g. weighted sum or multiplication [10]. Based on the results obtained in other applications with the weighted sum combining rule, in this paper we will apply it for the combination process: t
D X, R total ws D X, R s s 1
Fig. 1. Slicing of the cube to compute a dissimilarity matrix for each j variable
Next, we compute the DR for each of the matrices (slices) obtained. By using the DR taking
Computación y Sistemas Vol. 15 No. 1, 2011 pp 117-127 ISSN 1405-5546
(1)
where s j or s k and t m or t n respectively, depending on the direction that has been sliced. In the combination is done in both directions t m n . In a first approach ws is a scale applied to each matrix so that their maximum
Combining Dissimilarities for Three-Way Data Classification 121
values become equal, avoiding the new representation to be influenced by the largest values in the sum. However, other weights could be used. An example could be a weight indicating the discriminative influence of the variable related to the dissimilarity matrix. The idea of using these weights has the aim of making a kind of variable selection. Only variables with high discriminative power should have high weights (according to a determined threshold), such that they are the ones taken into account in the combination process. Thus, the variables with low weights (low discriminative power) are not analyzed; their corresponding dissimilarity matrix will not be computed. Consequently, by this variable selection, the whole procedure can be less computationally expensive, and the influence of some noisy, redundant or not informative data, could also be reduced.
3 Three-way Data Sets Signal Processing and Chemometrics, are some of the main areas where this type of object representation can be found. Thus, two three-way spectral data sets and their corresponding matrix (2D) representations will be studied in this paper. The first is a public domain data set [17], and its description has been taken from the website for a better understanding of the problem [17]. It consists of samples of red wine, produced from the same grape (Cabernet Sauvignon) and belonging to different geographical areas and producers. They were collected from local supermarkets and analyzed by means of HS-GC-MS (headspace gas chromatography/mass spectrometry). Separation of aroma compounds was carried out on a gas chromatography system (2700 columns from the scans of chromatographic profile). For each sample, a mass spectrum scan (m/z: 5-204) measured at the 2700 elution time-points was obtained, providing a data cube of size 44 2700 200 . The data set is composed of 44 samples from 3 different geographical areas: South America (21 samples), Australia (12 samples) and South Africa (11 samples). For the 1D (vector) representation of the objects, the three-way array was unfolded in its second direction, obtaining a matrix of size
44 540000 . All-zero columns were deleted in this representation (none of the samples have information in these columns), so the final data set has a size of 44 117060 . The second data set corresponds to seismic signals from the ice-capped Nevado del Ruiz volcano in the Colombian Andes, currently studied by the Volcanological and Seismological Observatory at Manizales. Signals were digitized at 100.16 Hz sampling frequency by using a 12 bit analog-to-digital converter [9]. The dataset for the experiments is composed of 12032-point signals of two classes of volcanic events: 235 of Long-Period (LP) earthquakes, and 235 of Volcano- Tectonic (VT) earthquakes. A 2D timefrequency representation was computed by the Short-Time Fourier Transform (STFT) with a Hamming window, obtaining a spectrogram from each signal [2]. To compute these spectrograms, trying to achieve a trade-off between time and frequency resolution, a 256-point (window size) STFT was calculated with 50% overlap. With this technique, it can be known what frequency intervals are present in a time interval of the signal and use it for the discrimination between classes. The concatenation of the spectrograms of the different signals (objects) will result in a 470 93 129 three-way data. The second direction stands for the time points and the third one for the frequency bands present in those time points. For the 1D (spectral) representation of each object, we have computed the spectrum by using a 12032-point Fast Fourier Transform (FFT), thus the whole signal is analyzed in both 1D and 2D representations, leading to a 470 12032 data. The differences in 1D spectral content of a signal allow for the discrimination between the events. However, with this representation we are not able to use the changes of frequency content in time to separate classes.
4 Experiments and Discussion With the purpose of demonstrating the feasibility of our proposal for the classification of three-way data sets (2D representation of objects), this representation will be compared with their feature vector (1D) representation based on the DR. In the case of the proposed approach, we com-
Computación y Sistemas Vol. 15 No. 1, 2011 pp 117-127 ISSN 1405-5546
122 Diana Porro Muñoz, Isneri Talavera, Robert P. W. Duin...
pare the performance of classifiers when combining in the different directions of the three-way data separately, as well as the DRs from the two directions combined all together. An analysis of the results is also done, by making a variable selection in each direction. In order to compute the DR, two dissimilarity measures were used. In the first data set, the differences between the classes of wine consist in the relation of concentrations (shape changes) of the variables in the chromatographic profile (second direction of the cube). So, we need a dissimilarity measure which takes this information into account when unfolding the data (1D representation) and when slicing in the third direction, i.e. in each slice through the third direction, we obtain a mass fragment for all the variables of the chromatography profile. In this case, we will use the Shape measure [10] (See Eq. 2). It is based on the differences of the derivatives of the spectrum, allowing for taking into account the changes in its shape, not being so in its feature representation d ( x1 , x2 )
with
shape
x
m x 1 j x 2 j , j 1
(2)
d G j, x . dj
(3)
The variable x corresponds to the computation of the first Gaussian (that is what G stands for) derivatives of spectra. Thus, a smoothing (blurring) is done by a convolution process ( ) with a Gaussian filter and stands for a smoothing parameter [10]. This measure has proved to perform well for spectral data [10, 14]. However, when we slice through the second dimension, the different fragments in which each component (each chromatography variable) is decomposed are obtained. Differences between these fragments for all the objects are just in terms of concentration (area under the curves), so it is enough to use a simpler measure like the Manhattan distance. For the second data set, the shape measure was used again for the 1D spectral representation, so changes in the shape of the spectra are analyzed. The same measure
Computación y Sistemas Vol. 15 No. 1, 2011 pp 117-127 ISSN 1405-5546
was applied for the computation of the DR in the new proposed approach (in both directions). Three classifiers were built on the DR from the different representations of the two data sets; namely, k-Nearest Neighbor (k-NN), Regularized Linear Discriminant Analysis (RLDA) and the Support Vector Machine (SVM). For the k-NN classifier, the number of neighbors (k) was optimized in a leave-one out cross-validation procedure. In order to find the regularization parameters of RLDA, an automatic regularization (optimization over the training set by cross-validation) process was done. For the SVM classifier, the linear kernel was applied in the two datasets. The regularization parameter C was also optimized in a cross-validation procedure over the training set. Experiments were repeated 10 times. Training and test objects were randomly chosen from the total data sets, in a 10-fold cross-validation process. For the first data set, as the number of samples is so small, we decided to use the training set (in the crossvalidation procedure) as representation set (prototypes). From previous studies, it was determined that the best results for the second data set were obtained with 100 prototypes, which were randomly selected. In both cases, the same training and test sets were used for all the representations, so the results can be comparable. The parameter for the Shape measure (Eq. 2) was optimized in 10-fold cross-validation. In the case of Wine data, as the number of objects is so small, the optimization procedure was done with the whole data set. The best results were obtained for 5 . In the case of the Seismic volcanic data, 170 samples (85 of each class) were used to optimize the parameter for each direction. The rest of the data was then used to evaluate the classification performances, by using the best values ( 2 for the time direction and 3 for the frequency direction). For the 1D representation, in which this measure will be used too, the parameter was also optimized in a cross-validation procedure. The best results were achieved with 15 for the Volcano data set and 20 for the Wine data set. For the experiments with the variable selection, we applied a forward selection. The variables (more discriminative) for which a dissimilarity matrix
Combining Dissimilarities for Three-Way Data Classification 123
should be computed are selected according to the leave-one-out nearest neighbor error. As for k-NN, a maximum number of variables to be analyzed (neighbors) has to be chosen. In Tables 1 and 4, the performance of classifiers on the two types of representations is shown: 1D (unfolding) representation and the combining procedure in the different directions (CD). The performance is evaluated in terms of the Average Classification Error (ACE). Table 1. Averaged cross-validation error in % (with standard deviation) for Wine data set. The 1D (vector) and different versions of the proposed approach are compared Representations
k-NN
RLDA
SVM
1D
51.7(0.9)
36.5(1.4)
34.3(1.4)
CD(chrom dir.)
48.6(0.4)
23.7(0.2)
30.4(0.1)
CD (mass dir.)
28.5(0.2)
15.9(0.2)
21(0.3)
CD (overall)
49.5(0.3)
22.1(0.1)
25.8(0.3)
In the first data set (Table 1), it can be observed that the unfolding procedure is not very suitable. By applying the DR on this representation, the high dimensionality of the obtained data is reduced, which is one of the main problems in this procedure. Still, fictitious connections between the end point of the variables in one direction and the start of the others are inserted. That is, not existent information or shapes can be inserted. In any direction that we do the unfolding, the same phenomenon will happen; some relation will be lost or its benefit will not be used. However, the results with the combination procedure are not always better; it seems to depend on what we are measuring in each direction. Let’s look at the results when combining the DRs obtained in the second direction (chromatography direction), where we are analyzing the mass spectra for each peak of the chromatogram. There is always an improvement with respect to the unfolded data. Nevertheless, compared to the slicing in the other direction the results are worst. It could be due to the fact that there is no much discriminative information in this direction. Another explanation could be that the dissimilari-
ty measure is not the most appropriate one in this case. Nevertheless, we can also observe in Table 1 that the ACE values of the combination procedure, when slicing on the third direction (slicing in the mass direction), are significantly smaller. This result is in agreement with the nature of the problem. The influence of the changes in the shape of the chromatography profile is taken into account in the discrimination among classes. However, it seems that the same reason for the bad performance of the procedure in the second direction is affecting when the DRs from both directions are all combined. Further studies should be done on this topic. In Tables 2 and 3, it can be observed the performance of classifiers when selecting the variables (dissimilarity matrices to be computed) in each direction. In this case, we made several experiments. In each of them we selected a porcentage of the data (threw away 100%- x%), to see how it can affect the results in each case. We can see in the tables above, that this procedure does not benefit the combination process. If we compare with Table 1 where all data is used, the errors start increasing when using just 90% of the data. It could be explained by the fact that all variables in this data are important, or that this procedure is not suitable for the selection in this case. Finding a proper discriminative weight for this selection is not such an easy task. In Table 4, it can be observed that once again the proposed approach improves the results obtained for the 1D spectral representation of the Seismic volcanic data. Nonetheless, in this case there is also a combination variant that outperforms the others. Unlike the previous data, the best results are obtained when slicing in the second direction (time direction), where we are measuring the frequency information. This is also reasonable. We are analyzing the changes of frequency content for each moment in time and using this information for the discrimination. However, the results for the third direction (measuring the time information) are bad. This analysis is based on the behavior of a frequency along time. It may happen that it is not as discriminative as the information in the other direction. Inaccuracies in the computation of spectrograms, where the time Computación y Sistemas Vol. 15 No. 1, 2011 pp 117-127 ISSN 1405-5546
124 Diana Porro Muñoz, Isneri Talavera, Robert P. W. Duin... Table 2. Averaged cross-validation error in % (with standard deviation) for leave-one-out nearest neighbor error forward variable selection in the Chromatography direction of Wine data set. The columns indicate the % of the data that is used in each experiment 10%
20%
30%
40%
50%
60%
70%
80%
90%
100%
k-NN
61.4(0.5)
61.4(0.5)
61.4(0.5)
61.4(0.5)
61.4(0.5)
61.4(0.5)
61.4(0.5)
61.4(0.5)
61.4(0.5)
48.6(0.4)
RLDA
64.1(0.4)
64.1(0.4)
64.1(0.4)
64.1(0.4)
64.1(0.4)
64.1(0.4)
64.1(0.4)
64.1(0.4)
64.1(0.4)
23.7(0.2)
SVM
48.2(0.8)
48.2(0.8)
48.2(0.8)
48.2(0.8)
48.2(0.8)
48.2(0.8)
48.2(0.8)
48.2(0.8)
48.2(0.8)
30.4(0.1)
Table 3. Averaged cross-validation error in % (with standard deviation) for leave-one-out nearest neighbor error forward variable selection in the Mass direction of Wine data set. The columns indicate the % of the data that is used in each experiment 10%
20%
30%
40%
50%
60%
70%
80%
90%
100%
k-NN
46.8(0.3)
45.9(0.2)
45.9(0.2)
45.9(0.2)
45.9(0.2)
45.9(0.2)
31.8(0.3)
31.8(0.3)
31.8(0.3)
28.5(0.2)
RLDA
33.5(0.1)
31.4(0.2)
31.4(0.2)
31.4(0.2)
31.4(0.2)
31.4(0.2)
28.2(0.1)
28.2(0.1)
28.2(0.1)
15.9(0.2)
SVM
35.9(0.3)
35.9(0.3)
35.9(0.3)
35.9(0.3)
35.9(0.3)
35.9(0.3)
29.5(0.2)
29.5(0.2)
29.5(0.2)
21(0.3)
localization is obtained by windowing the data at different times and applying the Fourier transform on that part of the signal, could be another reason for this result. When analyzing the spectrograms, it can be known what frequencies are present in a time interval of the signal, but not the exact moment in time. On the other hand, although for this data the overall combination improves also the 1D representation, it is not enough. Taking into account what happens in both data sets with the overall combination, we could say that, when the information analyzed in one of the directions is not sufficiently discriminative, this can affect the goal of finding the more powerful representation. Table 4. Averaged cross-validation error in % (with standard deviation) for Volcano data set. The 1D (vector) and different versions of the proposed approach are compared Representations
k-NN
RLDA
SVM
1D
37.7(0.7)
27.6(0.6)
27.8(0.9)
CD (time dir.)
31.9(0.1)
24.5(0.3)
23.6(0.2)
CD (freq dir.)
37.7(0.08)
32.2(0.1)
28.1(0.1)
CD (overall)
38(0.06)
26(0.06)
25.3(0.04)
Computación y Sistemas Vol. 15 No. 1, 2011 pp 117-127 ISSN 1405-5546
The discrimination between classes in these data sets seems to be difficult at first. Nonetheless, for all representations, the linear classifiers perform better than the non-linear ones, and even more on the representations obtained from the proposed approach. This complements the discussion above, and could support the hypothesis of this study: finding a more powerful representation of data where simple classifiers can perform relatively well. If we take a look at Tables 5 and 6, we can see that results improve when throwing away a small percentage of the data. When slicing in the time direction (analyzing frequency in each time point), by throwing until 30% of the data away, for most classifiers we have lower errors than when using the whole data. If the error is still the same that when using all time points, we can still throw those variables because they do not seem to influence the classification performance. When slicing in the frequency direction, we can observe a similar behavior. If throwing up to 20% of the data away, a lower error is obtained compared to the error when using the whole data. It seems then that the weighting can be beneficial in this case, not only because the performance of classifiers improves, but also since the whole process can be less computationally complex.
Combining Dissimilarities for Three-Way Data Classification 125 Table 5. Averaged cross-validation error in % (with standard deviation) for leave-one-out nearest neighbor error forward variable selection in the Time direction of Volcano data set. The columns indicate the % of the data that is used in each experiment
k-NN RLDA SVM
10%
20%
30%
40%
60%
70%
80%
90%
100%
25.7(0.1)
25.7(0.2)
25.7(0.1)
25.7(0.1)
25.8(3)
50%
25.9(0.2)
25.3(0.1)
25.7(0.1)
25.1(0.2)
31.9(0.1)
31.2(0.3)
30.7(0.3)
30.7(0.3)
29.8(0.4)
28.3(0.2)
27.7(0.2)
27.1(0.1)
26.9(0.2)
26.9(0.2)
24.5(0.3)
26.4(0.1)
25.8(0.2)
25.8(0.1)
25.8(0.1)
25.8(0.1)
24.6(0.2)
22.8(0.3)
22.6(0.3)
22.6(0.2)
23.6(0.2)
Table 6. Averaged cross-validation error in % (with standard deviation) for leave-one-out nearest neighbor error forward variable selection Frequency direction of Volcano data set. The columns indicate the % of the data that is used in each experiment 10%
20%
30%
40%
50%
60%
70%
80%
90%
100%
k-NN
51.2(0.2)
50(0.1)
49.7(0.2)
48.3(0.1)
48.3(0.1)
48(0.1)
43.5(0.2)
44.1(0.2)
43.5(0.1)
37.7(0.1)
RLDA
46.5(0.1)
44.8(0.1)
44.4(0.1)
43.7(0.1)
43.5(0.1)
43(0.1)
41.4(0.1)
41.3(0.2)
38.4(0.2)
32.2 (0.1)
SVM
45.3(0.2)
45.3(0.1)
44.5(0.3)
44.3(0.2)
44.1(0.1)
43.8(0.1)
41.3(0.2)
40.9(0.3)
38.3(0.2)
28.1 (0.1)
5 Conclusions We proposed an approach for classifying threeway data, by the combination of dissimilarity representations. In this approach, the cube is sliced through the variables of each direction. Consequently, we have a vector representation of the objects on which DR can be applied. By using the DR we can analyze how the variable of each direction influences the discrimination among the classes by taking into account the information of the other direction. Information about the data that is missing in its feature representation, e.g. shape changes in spectra, can also be incorporated into the dissimilarity measure. This approach can be applied or generalized to different types of three-way data; even in those where different types of variables are all related in the complex multi-dimensional structure. By combining the DRs, all the information is projected in a more powerful representation of the data. The good performance of classifiers on the different variants of the introduced approach shows that it can be a good solution for the classification of three-way data. The DRs obtained from the slicing in each direction were combined separately first, and all together. It has been shown that the results of the combination on one direction depend on the discriminative information that is taken into account. Moreover, if the DRs from one of the di-
rections are not representative enough, this can also influence the results of the overall combination. Finally, if more robust weights are applied in the combination rule, this should lead to a better discrimination.
Acknowledgment We acknowledge financial support from the FET programme within the EU FP7, under the project “Similarity-based Pattern Analysis and Recognition- SIMBAD” (contract 213250). We would also like to thank to the project “Cálculo científico para caracterización e identificación en problemas dinámicos” (code Hermes 10722) granted by Universidad Nacional de Colombia.
References 1. Ballabio, D., Consonni, V. & Todeschini, R. (2007). Classification of multiway analytical data based on MOLMAP approach. Analytica Chimica Acta, 605 (2), 134-146. 2. Benbrahim, M., Daoudi, A., Benjelloun, K. & Ibenbrahim, A. (2005). Discrimination of Seismic Signals Using Artificial Neural Networks. World Academy of Science, Engineering and Technology, Istanbul, Turkey, (4), 4-7.
Computación y Sistemas Vol. 15 No. 1, 2011 pp 117-127 ISSN 1405-5546
126 Diana Porro Muñoz, Isneri Talavera, Robert P. W. Duin... 3. Damoulas, T. & Girolami, M. A. (2009). Combining feature spaces for classification. Pattern Recognition, 42 (11), 2671-2683. 4. Ibba, A., Duin, R. P. W. & Lee, W. J. (2010). A study on combining sets of differently measured dissimilarities. 20th International conference on Pattern Recognition, Istambul, Turkey, 3360-3363. 5. Kim, S. W. & Duin, R. P. W. (2007). On Combining Dissimilarity-Based Classifiers to Solve the Small Sample Size Problem for Appearance-Based Face Recognition. Advances in Artificial Intelligence. Lecture Notes in Computer Science, 4509, 110-121. 6. Kittler, J., Hatef, M., Duin, R. P. W. & Matas, J. (1998). On combining classifiers. IEEE Transactions on Pattern Analysis and Machine Intelligence, 20 (3), 226-239. 7. Kroonenberg, P. M. (2008). Applied Multiway Data Analysis. Hoboken, New Jersey, Wiley-Interscience 8. Kuncheva, L. I. (2004). Combining Pattern Classifiers: Methods and Algorithms. Hoboken, New Jersey: John Wiley 9. Orozco-Alzate, M., García, M. E., Duin, R. P. W. & Castellanos, C. G. (2006). Dissimilarity-Based classification of seismic signals at Nevado del Ruiz Volcano. Earth Sciences Research Journal, 10 (2), 57-65. 10. Paclik, P. & Duin, R. P. W. (2003). Dissimilaritybased classification of spectra: computational issues. Real Time Imaging, 9 (4), 237-244. 11. Pekalska, E. & Duin, R. P. W. (2001). On Combining Dissimilarity Representations. Second International Workshop on Multiple Classifier Systems. Lecture Notes in Computer Science, 2096, 359-368. 12. Pekalska, E. & Duin, R. P. W. (2005). The Dissimilarity Representation for Pattern Recognition. Foundations and Applications. Hackensack, N.J.: World Scientific. 13. Porro-Muñoz, D., Talavera, I. & Duin, R. P. W. (2009). Multi-way data analysis (RNPS No.2142 Reporte técnico, serie Azul RT_014). Cuba: CENATAV. 14. Porro-Muñoz, D., Duin, R. P. W., Talavera, I. & Hdez., N. (2009). The Representation of Chemical Spectral Data for Classification. Progress in Pattern Recognition, Image Analysis, Computer Vision, and Applications. Lecture Notes in Computer Science, 5856, 513-520. 15. Porro-Muñoz, D., Duin, R. P. W., Orozco-Alzate, M, Talavera-Bustamante, I. & Londono-Bonilla, J.M (2010). The Dissimilarity Representation as a Tool for Three-Way Data Classification: A 2D Measure. Structural, Syntactic and Statistical Pattern Recognition. Lecture Notes in Computer Science, 6218, 569-578.
Computación y Sistemas Vol. 15 No. 1, 2011 pp 117-127 ISSN 1405-5546
16. Sadecka, J. & Tothova, J. (2007). Fluorescence spectroscopy and chemometrics in the food classification − a review. Czech Journal of Food Sciences, 25 (4), 159–173. 17. Skov, T., Ballabio, D. & Bro, R. (2008). Multiblock Variance Partitioning. A new approach for comparing variation in multiple data blocks. Analytica Chimica Acta, 615 (1), 18-29. Retrieved from: http://models.kvl.dk/Wine_GCMS_FTIR.
Diana Porro Muñoz
She received her diploma of Software Engineer from the Technical University “José A. Echeverría” (CUJAE), Havana, Cuba in 2007. She is currently working as a researcher and software developer in the Advanced Technologies Application Center, Cuba and is also a PhD student of the Pattern Recognition Laboratory, TU Delft, Netherlands. Her main research interests involve pattern recognition, chemometrics, multiway data analysis, spectral data analysis and its applications. Diana is a member of the Cuban Society of Mathematics and Computation and the Cuban Association of Pattern Recognition.
Isneri Talavera Bustamante
She earned her diploma in chemistry from the University of Havana in 1980. She received the PhD degree in Technical Sciences at Technical University "José A. Echeverría" (ISPJAE) in 1986, Havana, Cuba. She is currently the Vice Director of the Advanced Technologies Application Center, Cuba. Dr. Isneri is also a Senior Researcher and Assistant Professor at the University of Havana. She was elected Senior Researcher of the
Combining Dissimilarities for Three-Way Data Classification 127 Academy of Sciences of Cuba for the period 2002-2006 and endorsed to the 2006-2010 period. Her research has been focused on two main aspects: the study paper chemistry and degradation processes of these materials as supporting documentation, and from 2003 she began working on Chemometrics. In this field, her work has been directed towards the processing and multivariate classification of chemical images, incorporating the support vector machine (SVM). At present, she is working on obtaining new calibration and multivariate prediction models with SVM and FDA and the classification tools for multiway data. Nowadays, she is responsible for this research line in her institute and its diversification and employment in the country. Dr. Isneri received the Annual Award Academy of Sciences of Cuba in 2000, among others. She is a member of the Cuban Chemical Society and the Cuban Association of Pattern Recognition.
Robert P.W. Duin
He received in 1978 the Ph.D. degree in applied physics from Delft University of Technology in The Netherlands, for a thesis on statistical pattern recognition. Presently he is connected with the Faculty of Electrical Engineering, Mathematics and Computer Science of the same university. During 1980-1990, he studied and developed hardware architectures and software configurations for interactive image analysis. After that he became involved with pattern recognition by neural networks and studied complexity issues, support vector machines, classifier combining strategies, and one-class classifiers. Around 2000 he started to investigate alternative object representations and developed with his students dissimilarity-based pattern recognition and the use and handling of nonEuclidean data. Dr. Duin is the main developer of PRTools a Matlab package for pattern recognition. He is a past associate editor of Pattern Recognition Letters and of the IEEE Transactions on Pattern Analysis and Machine Intelligence. He is a Fellow of the International Association for Pattern Recognition (IAPR). In August 2006 he was the recipient of the Pierre Devijver Award for his contributions to statistical pattern recognition.
Mauricio Orozco Alzate
He had his primary and secondary education at Colegio Mayor de Nuestra Señora (Colseñora) - Archdiocese of Manizales. He received his undergraduate degree in Electronic Engineering, his M. Eng. degree in Industrial Automation and his Dr. Eng. degree in Automatics from Universidad Nacional de Colombia Sede Manizales, in 2003, 2005 and 2008 respectively. From February to August 2007, he served as a Research Fellow at the Information and Communication Theory Group Pattern Recognition Laboratory of Delft University of Technology, the Netherlands. Since August 2008, he has been with the Department of Informatics and Computing, Universidad Nacional de Colombia Sede Manizales. He is also a researcher of the Group on Signal Processing and Recognition at the same University. His main research interests encompass pattern recognition, digital signal processing and their applications to analysis and classification of seismic, bioacoustic and hydro-meteorological signals. Mauricio is a member of the Institute of Electrical and Electronics Engineers (IEEE) and the Caldas Ornithological Society (SCO).
Computación y Sistemas Vol. 15 No. 1, 2011 pp 117-127 ISSN 1405-5546