Combining Evidence from Subsegmental and Segmental Features for Audio Clip Classification Anvita Bajpai
B. Yegnanarayana
DeciDyn Systems Bangalore, India Email:
[email protected]
International Institute of Information Technology Hyderabad, India Email:
[email protected]
Abstract-In this paper, we demonstrate the complementary nature of audio-specific excitation source (subsegmental) information present in the linear prediction (LP) residual, to the information derived using spectral (segmental) features, for audio clip classification. Classes considered for study are advertisement, cricket, cartoon, football and news, and the data is collected from TV broadcast with large intra-class variability. A baseline system based on segmental features and hidden Markov models (HMM), gives classification accuracy of 62.08%. Another baseline system, based on subsegmental features present in the LP residual, built using autoassociative neural networks (AANN) to model audio components, and multilayer perceptron (MLP) to classify audio, gives classification accuracy of 52.72 %. The two systems are combined at abstract level and give classification accuracy of 86.96%, indicating their complementary nature. The rank and measurement level combination of the two systems is further used to enhance the classification accuracy to 92.97tyo.
Index Terms- Neural networks, Pattern classification, Linear prediction residual, Combining classifiers, Audio indexing I. INTRODUCTION
In this era of information technology, the information is flooding in the form of audio, video and multimedia (http://www.sims.berkeley.edu/research/projects/ how-much-info/summary.html). Agencies as well as individuals are enabled with devices to easily record and store multimedia contents. This data, once recorded and stored, is opaque in nature (in the form of bits). Manual handling of this data is impractical for real-time applications because of its increasingly large volume. Hence, it is important to have methods to automatically index multimedia data for targeting and personalization applications based on multimedia contents. Classification of data into different categories is one important step for building such systems. Audio plays an important role in classifying multimedia data, as it is easier to process when compared to video data, and also the audio data contains perceptually significant information. The information about the audio category is contained in the excitation source (subsegmental), system/physiological (segmental) and behavioral (suprasegmental) characteristics of the audio data. In the traditional approach of audio indexing, audio is converted to text and indexed using textbased search engines
[1]. This approach not only depends on the accuracy of the speech recognizer but also lacks on using audio information present in the form of prosody and non-speech audio, like, music. Feiten et al. [2] present a method for audio retrieval based on content capability. Wold et al. [3] have used mean, variance and autocorrelation of loudness, pitch and bandwidth as audio features along with nearest neighbor classifier, to hierarchically divide the 400 audio files into sixteen classes. G. Guo et al. [4] have further refined the work by using perceptual features, composed of total power, subband powers, bandwidth, pitch and MFCCs, and support vector machines (SVMs). Wang et al. [5] classify audio into five categories of television (TV) programs using spectral features. Features based on amplitude, zerocrossing, bandwidth, band-energy in the subbands, spectrum and periodicity properties, along with hidden Markov model (HMM) for classification are explored for audio indexing applications in [6]. It is shown that perceptually significant information of the audio data is present in the form of sequence of events, residual, which is obtained after removing the predictable part in the audio signal. The residual part of the signal is subject to less degradation as compared to the system part of the same [7]. An audio class is a unique combination of various audio components like, music and speech. Using the knowledge of the audio components present in an audio class, subsegmental features present in the linear prediction (LP) residual are captured using autoassociative neural networks (AANN) by modeling audio components in [8]. The residual data contains higher order correlation among samples. As known signal processing and statistical techniques are not suitable to capture this correlation, AANNs have been used in this work. This work is extended in [9] using multilayer perceptron (MLP) to classify audio based on audio-specific subsegmental features present in the LP residual, captured by AANNs. Since, residual is obtained after removing the predictable part of the audio signal, the subsegmental information present in the residual signal can be complementary in nature to the segmental information present in the predictable part of the signal. Hence, combining the two levels of information present in the audio signal can give a better performing system. In this paper, we explore methods for combining evidence from subsegmental and segmental features based
Authorized licensed use limited to: INTERNATIONAL INSTITUTE OF INFORMATION TECHNOLOGY. Downloaded on January 30, 2009 at 02:12 from IEEE Xplore. Restrictions apply.
systems and show their complementary nature for audio clip c1assifi cation. The paper is organized as follows: Section 2 discusses the database used for study. Section 3 gives a brief description of baseline system build using segmental features [6] for audio classification. Section 4 discusses the system [9] for audio clip classification using subsegmental features. Experimental results and degraded performance of the two systems with large intra-class variability in data has also been discussed in Sections 3 and 4 respectively. Complementary nature of the two levels of information present in an audio signal is demonstrated in Section 5. Section 6 concludes the paper and gives directions for future work. II. DATABASE USED FOR STUDY The audio data used for the study is collected from TV programs broadcast in India. The TV channels used for data collection are as follows: (a) Advertisement - Across the TV channels (b) Cartoon - Cartoon network, STAR and Zee TV (c) Cricket - DO sports, ESPN, STAR sports (d) Football - DO sports, ESPN, STAR sports (e) News - Indian news TV channels (like Sun news, DO), in closed studio environment, by Indian news readers in Hindi, English, Tamil, Telugu and Kannada languages The two databases considered for the study are as follows: (a) OBI - Data collected for each category from single TV channel, contains 200 test clips, 40 clips of each category (b) DB2 - Data collected across all TV broadcast channels, contains total 1359 clips. Number of clips belonging to each category is as follows: Advertisement - 226, Cartoon - 208, Cricket - 318, Football - 300, News - 306 Each clip is recorded for 10 sec. duration with 8 KHz sampling frequency, manually labeled. OBI has very less intra-class variability, while clips belonging to DB2 have a significant intra-class variability. For each database, 10 clips per class have been randomly selected for training, and remaining clips are used for testing. III. AUDIO CLIP CLASSIFICATION SYSTEM BASED ON SEGMENTAL FEATURES A set of fourteen features is used for the audio clip classification task. The volume based features are standard deviation of volume, dynamic range of volume, volume undulation [5] and 4Hz modulation energy [10]. The zero crossing rate based features are standard deviation of zero crossing rate and nonsilence ratio (the ratio of number of non-silence frames to the total number of frames in the clip). The pitch based features are pitch contour, pitch standard deviation, similar pitch ratio (the ratio of the number of
TABLE I AUDIO CLIP CLASSIFICATION PERFORMANCE USING SYSTEM BASED ON SEGMENTAL FEATURES.
Audio Class Advertisement Cartoon Cricket Football News Average
Percentage of clips correctly classified Database - TIBZ Database - OBI 85.00 65.00 90.00 75.00 90.00 65.00 40.12 92.50 87.50 65.30 89.00 62.08
neighboring frames having similar pitch to the total number of frames), non-pitch ratio (the ratio of frames with zero pitch, i.e., frames for which pitch is not defined). Spectrum based features are frequency centroid, bandwidth and ratio of energy in various frequency sub-bands to the total energy. Using a 10 ms frame size, the gross features are computed over a one second duration clip. The fourteen features mentioned above are computed for every one-second duration of the clip and combined to form a feature vector. The feature vectors are derived for a 10 second duration clip. It can be noted that it is almost impossible to manually determine the clip category when only a short duration is present or frames of the clip are randomly shuffled. Therefore, once data is represented in terms of features, in order to capture the temporal behavior of the feature vector, HMM is used in the baseline system. HMM belongs to the class of statistical signal models in which one tries to characterize only the statistical properties of the signal. The underlying assumption of a statistical model is that the signal can be well characterize as a parametric random process, and that the parameters of the stochastic process can be determined (estimated) in a precise, well-defined manner. Ergodic HMMs with 5-states are used for carrying out the audio clip classification task. Here first and last states are simply entry and exit states, respectively. So practically, the model has only three states. The amount of data required for training an HMM increases exponentially with number of states. So the choice of having only three states is made due to the limited amount of data kept for training. For final classification, the maximum likelihood decision logic is used. The audio clip classification results of the system for the two databases are given in Table I. Performance of the system is degraded for DB2 as compared to that of OBI. Performance of the system for database DB2 degrades drastically in the case of football category as compared to other audio categories. One reason for the same may be that football may be considered as most degraded speech, and performance of the system using spectral features is known to degrade with noisy data [11].
Authorized licensed use limited to: INTERNATIONAL INSTITUTE OF INFORMATION TECHNOLOGY. Downloaded on January 30, 2009 at 02:12 from IEEE Xplore. Restrictions apply.
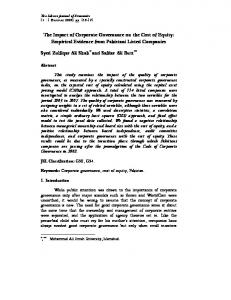
IV. AUDIO CLIP CLASSIFICATION SYSTEM BASED ON SUBSEGMENTAL FEATURES The category of the given audio clip can also be decided using the subsegmental (excitation source) information present in the audio signal. System for extraction of audio-specific subsegmental information, present in the LP residual of the signal, is shown in Figure 1.
TABLE II AUDIO CLIP CLASSIFICATION PERFORMANCE USING SYSTEM BASED ON SUBSEGMENTAL FEATURES PRESENT IN THE LP RESIDUAL.
Audio Class Advertisement Cartoon Cricket Football News Average
I
Percentage of clips correctly classified Database - DB 1 Database - DB2 83.00 43.50 88.00 45.50 86.00 38.50 90.50 72.80 85.50 63.30 86.60 52.72
I
J\udio------.t LP analysis _----.t LP residual signal. .
J\udio class Fig. 1. The block diagram of audio clip classification system based on the subsegmental information present in the LP residual. AANN-I to AANN-6 model audio components (like speech and music) for each audio category.
The LP residual is extracted from the audio signal using LP analysis. An audio class is a unique combination of the audio components present in it. Six audio components, namely, music, conversational speech, cartoon speech, clean speech, noise of cricket sport and noise of football sport, are recognized to uniquely define each of the five classes considered for study. Here, the term noise refers to nonspeech and nonmusic sounds, like clapping sound. The AANN models are trained for each of the six components. For classification, the LP residual of the signal is given to each of the six AANN models, and the output confidence scores ( Cl , C2, ..• , C6) of these models is taken as a six dimensional feature vector and given to a MLP classifier. Output of MLP is the audio class. Details of the system are given in [9]. Audio clip classification results for databases (DB 1, DB2) are given in Table II. The performance of the system for an audio category is computed as percentage of clips correctly classified, which is the ratio of the number of test audio clips of the category correctly classified to the total number of test audio clips of that category. The average performance of the system for DBI is 86.60%. When the larger database DB2 is considered, the performance of the system comes down. Inspite of relatively lower performance for DB2, it can be seen that the audio-specific information is still captured from the LP residual signal with neural network (NN) models
used for classification task. It can be noticed that degradation in performance is less in the case of news and football categories, as compared to other three audio categories. This can be due to the fact that in DB2, the variability in audio data is less in the case of news and football, as compared to the other three categories. Advertisement and cartoon clips have music, speech and other audio components. However, the type of music (depending on the musical instruments used), speech and other audio components vary from one audio clip to other clip. There is significant intra-class variability in the audio data of the advertisement and cartoon category. Hence, in the general case of advertisement and cartoon audio, the duration of the segment to be considered for capturing the subsegmental information may vary from one clip to other. Degradation in performance in the case of cricket audio is also because of the variability in the data used for testing. There is significant variation in cricket audio collected from different TV channels. Cricket audio data collected from DD sports channel has high level of noise, while noise is relatively less in the case of data collected from the ESPN channel. Also, speaking style, accent of commentator varies a lot in the case of cricket data collected across the channels. Hence, the NN models, trained using the data collected from one TV channel, may not work well for the test data collected from other TV channels. Large variability in the data makes the training of the network insufficient, due to significant overlap (of same type of patterns) among categories. Sometimes, decision making for the same is difficult for humans also without having complete domain knowledge. Hence, (1) other type of information present in the signal should also be considered to get a better picture, (2) as performance of the system degrades mainly because of the large variability in the test data, each of these categories can further be divided into subcategories (like cricket from DD sports and cricket from ESPN) with less intra-class variability in each subcategory. The problem can be addressed at a finer level and a modular approach can be used for the classification task. V. COMBINING EVIDENCE FROM SUB SEGMENTAL AND SEGMENTAL FEATURES The subsegmental information present in the audio signal can be complementary in nature to the segmental information. The subsegmental audio-specific information is captured by
Authorized licensed use limited to: INTERNATIONAL INSTITUTE OF INFORMATION TECHNOLOGY. Downloaded on January 30, 2009 at 02:12 from IEEE Xplore. Restrictions apply.
TABLE III
TABLE IV
AUDIO CLIP CLASSIFICATION PERFORMANCE FOR COMBINED (AT ABSTRACT LEVEL) SYSTEM FOR DB2.
AUDIO CLIP CLASSIFICATION PERFORMANCE FOR COMBINED (AT RANK AND MEASUREMENT LEVEL) SYSTEM FOR DB2.
Audio Class
I
Advertisement Cartoon Cricket Football News Average
Percentage of clips correctly classified Segmental SUbsegmental Abstract level featuresfeaturesbased system based system combination 65.00 43.50 83.00 75.00 45.50 92.00 65.00 38.50 87.50 40.12 72.80 86.00 86.30 65.30 63.30 52.72 62.08 86.96
Percentage of clips correctly classified Subsegmental Segmetal Rank and featuresfeaturesmeasurement level based system based system combination 92.47 65.00 43.50 75.00 45.50 98.55 65.00 38.50 88.67 40.12 72.80 90.10 65.30 63.30 95.10 52.72 92.97 62.08
Audio Class
Advert. Cartoon Cricket Football News Average
TABLE V
using the system based on the LP residual and NN models, and the segmental information is captured using the system based on spectral features and HMMs. In this section, methods to combine the two levels of information present in the audio signal are discussed. A. Abstract Level Combination of Two Systems
In this work, the information is first combined at an abstract level to show the complementary nature of subsegmental and segmental information. At this level the only information considered from the two systems is the output class label. The study has only two systems, and it is difficult to go for voting or weighing the output label of one system. Hence, the output class labels are combined using OR logic. Hence, if either of the systems is able to classify the clip, it is considered as correct classification, and misclassification is considered only when both systems fail. Since the objective of this study is to get the evidence from other system when one system fails, the OR logic is considered. Abstract level classification results are given in Table III. B. Rank and Measurement Level Combination of Two Systems
Abstract level combination shows the complementary nature of subsegmental and segmental information for audio clip classification task. However, the abstract level combination method uses least information given by the two systems, it uses only class label given by the system. It does not use any information about the confidence with which the system gives the class label. Hence, a method using rank and measurement level combination is proposed for the task. The method is summarized as follows: (i) Normalize output confidence values of the two systems [6], [9] in the range of 0 to 1. (ii) Add class-wise confidence values of the two systems. (iii) Select the maximum of the class-wise sum of confidence values. (iv) The category corresponding to this maximum confidence value (1 st rank) is assigned to the test audio clip. The classification results using rank and measurement level combination of the two systems are given in Table IV.
AN EXAMPLE OF CLASS-WISE NORMALIZED OUTPUT CONFIDENCE VALUES OF THE TWO SYSTEMS AND ITS SUM.
Audio class ~ Confidence of 1st system ~ Confidence of 2nd system ~
II
Advert.
I Cartoon I Cricket I Football I News I
1
0.8
0.5
0.4
0
0.2
0.9
1
0.3
0
S~of n ~ Confidences ~_ UL-_l_.2_....L-_l_.7_~_I_.5_....L-_0_.7 __
L2-J
This method outperforms simple abstract level combination (as given in Table III). This can be explained with the help of following example. Let the class-wise normalized output confidence values for the two systems and its sum be given in Table V. It could be seen that for the first system, the category of the clip is 'Advertisement', whereas for second system, it is 'Cricket'. This is an example when both systems are misclassifying the test clip. However, on adding the confidence values, the winning class is 'Cartoon', which is the actual category of test clip. Hence, the hidden performance is captured by this method even if both systems fail. The analysis of confidence values shows that if both models are giving highest confidence for the same category name, it is selected, and misclassification is also accepted in this case. However, when both models are not agreeing, the second-best confidence values of the systems playa role in deciding the system classifying the clip correctly. Also, it helps in bringing this hidden performance out as explained above using Table V. The best performance is obtained by giving equal weight to both systems.
VI.
CONCLUSIONS AND FUTURE WORK
In this paper, it is shown that the subsegmental information and the segmental information, present in the audio signal, are complementary in nature for the audio clip classification task. The subsegmental information is captured by the system based on the LP residual and neural networks. The segmental information is captured by the system based on spectral features and HMMs. The methods to combine the two levels
Authorized licensed use limited to: INTERNATIONAL INSTITUTE OF INFORMATION TECHNOLOGY. Downloaded on January 30, 2009 at 02:12 from IEEE Xplore. Restrictions apply.
of information present in the audio signal have been proposed. It is shown experimentally that the combined system outperforms individual systems, indicating their complementary nature. Apart from subsegmental and segmental information, suprasegmental information is also present in the audio signal, which could also be useful for the audio clip classification task. REFERENCES [I] J. Makhoul, F. Kubala, R. Leek, D. Lui, L. Nguqen, R. Schwartz and A. Srivastava, "Speech and Language Technologies for Audio Indexing and Retrieval," Proc. IEEE, vol. 88, no. 8, pp. 133S--1353, Aug. 2000. [2] B. Feiten and S. Gunzel, "Automatic Indexing of a Sound Database using Self-organizing Neural Nets.:' Computer Music Journal, vol. 18(3), pp. 53-65, 1994. [3] E. Wold, T. Blum, D. Keslar and J. Wheaton, "Content-based Classification, Search, and Retrieval of Audio:' IEEE Multimedia, vol. 3, no. 3, pp. 27-36, Jul. 1996. [4] G. Guo and S. Z. Li, "Content-based Audio Classification and Retrieval by Support Vector Machines:' IEEE Trans. on Neural Networks, vol. 14, no. I, pp. 209--215, Jan. 2003. [5] Y. Wang, Z. Liu and J.-c. Huang, "Multimedia Content Analysis using both Audio and Visual Clues:' IEEE Signal Processing Magazine, vol. 17, no. 6, pp. 12-36, Nov. 2000. [6] G. Aggarwal, A. Bajpai, A. N. Khan and B. Yegnanarayana, "Exploring Features for Audio Indexing:' in Inter-Research Institute Student Seminar, IISc Bangalore, India, Mar. 2002. [7] B. Yegnanarayana, S. R. M. Prasanna and K. S. Rao, "Speech Enhancement using Excitation Source Information:' in Proc. IEEE Int. Conf. Acoust., Speech, and Signal Processing, Orlando, FL, USA, May 2002. [8] Anvita Bajpai and B. Yegnanarayana, "Exploring Features for Audio Clip Classification using LP Residual and Neural Networks Models:' in Proc. Int. Con! Intelligent Signal and Image Processing, Chennai, India, Jan. 2004. [9] Anvita Bajpai and B. Yegnanarayana, "Audio Clip Classification using LP Residual and Neural Networks Models," in Proc. European Signal and Image Processing Conference, Vienna, Austria, Sep. 2004. [10] E. Scheirer and M. Slaney, "Construction and Evaluation of a Robust Multifeature SpeechlMusic Discriminator," in Proc. IEEE Int. Conf. Acoust.. Speech. and Signal Processing, Munich, Germany, Apr. 1997, pp. 1331-1334. [II] NIST, "Speaker Recognition Workshop Notebook:' Proc. NIST 2000 Speaker Recognition Workshop, University ofMaryland, USA, Jun 2000.
Authorized licensed use limited to: INTERNATIONAL INSTITUTE OF INFORMATION TECHNOLOGY. Downloaded on January 30, 2009 at 02:12 from IEEE Xplore. Restrictions apply.