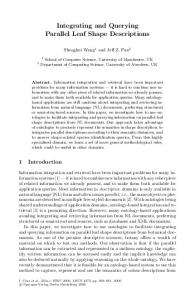
angle area representation (TAR) and the triangle side length represen- .... triangles and the number of scales and d(k) is the distance between the triangle.
Combining Leaf Salient Points and Leaf Contour Descriptions for Plant Species Recognition Sofiene Mouine1 , Itheri Yahiaoui1,2 , and Anne Verroust-Blondet1 1
Inria Paris-Rocquencourt Domaine de Voluceau 78153 Le Chesnay 2 CReSTIC Universit´e de Reims {sofiene.mouine,itheri.yahiaoui,anne.verroust}@inria.fr
Abstract. Manual Plant identification done by experts is tedious and time consuming. This process needs to be automatic and easy to handle by the different stakeholders. In this paper, we propose an original method for plant species recognition, based on the leaf observation. We consider two sources of information: the leaf margin and the leaf salient points. For the leaf shape description, we investigate the shape context descriptor and two multiscale triangular approaches: the well-known triangle area representation (TAR) and the triangle side length representation (TSL). We propose then their combination with a shape-context based descriptor that represents the spatial correlation between the leaf salient points and the leaf margin. Experiments are carried out on three public leaf datasets. Results show that our approach achieves a high retrieval accuracy and outperforms state-of-art methods. Keywords: plant species recognition, leaf retrieval, shape representation, local descriptors, shape context.
1
Introduction
Automatic plant identification is a challenging task especially when we consider the huge number of plant species existing in the world. A plant identification tool will enable botanists, as well as non-expert stakeholders, to identify a plant in a timely manner. Leaves are often the basis for identifying plants since they are easily observed. Leaf images are usually acquired using either a flat-bed scanner (scan images) or a digital camera (scan-like images). In the later case, leaves must be photographed against a light, untextured background. Plant leaves are present for several months and contain clues about the taxonomic identity of the plant. This is why most plant identification tools based on Content-Based Image Retrieval techniques work on leaf image databases [4, 16]. Leaves can be characterized by their color, shape and texture. The leaf color is not sufficiently discriminant to be used alone in a plant identification task. This feature may vary with seasons and geographical locations. Thus, shape and texture are the most relevant features of the leaf. Apart from Nam et al. [19], where the shape features computed from the leaf margin are enriched with venation features, most approaches are based on the
description of the leaf margin (see [5] for a review). Some approaches extract morphological characters commonly used in botany [4, 6]. Shape feature extraction techniques [15] have been adapted to the particular case of leaves, as for example, the Curvature Scale Space [4, 17] and Fourierbased descriptors [20, 26]. Multiscale schemes based on triangles [2, 7, 10, 21, 22] obtained promising results on 2D shape databases such as MPEG7 and Kimia and should be adapted for plant species identification. These methods represent the triangles by their areas at each scale. Shen et al. [10] showed that the triangle area representation (TAR) is affine-invariant. El Rube et al. [7] suggested computing TAR at multiscale wavelet levels (MTAR) to reduce the noise effect on the shape boundary. More recently, Alajlan et al. [1, 2] made the triangle normalization locally for each scale and used a dynamic space warping matching to compute the optimal correspondence between two shapes. An alternate method of shape representation is to use the shape context descriptor introduced by Belongie et al. [3]. Inner shape context [14] techniques have proven their efficiency for leaf image retrieval. To describe the boundary of a shape accurately and obtain good retrieval results, a regular sampling of the contour points is computed. Xie et al. [24] introduced the skeletal context, which uses a medial axis transform to produce an optimal sampling of the shape contour with a smaller number of points. In [18], the points that vote in the shape context (voting points) and the points where the shape context histograms are computed (computing points), are separated into two different sets. This scheme is used to represent, with the SC2 descriptor, spatial relationships between the salient points and the leaf margin in the context of leaf retrieval. We believe that both contour and local interest points descriptions are useful for leaf species identification. We propose an approach that combines two types of descriptors. The first one is the SC2 descriptor introduced in [18]. The second descriptor extracts shape features from contour points. Our approach is presented in Section 2. The results are reported and discussed in Section 3.
2
Our approach
Our overall approach is based on the combination of SC2 with a more accurate description of the leaf margin. Two different types of shape descriptors representing the leaf boundary are presented and evaluated. They are both based on the computation of spatial relationships between a set of sampling points uniformly distributed over the leaf boundary (see Section 2.2). The matching and fusion methods used in our approach are described in Sections 2.3 and 2.4. 2.1
Salient points description
Given a leaf image and a salient point p computed on this image, we consider the vectors obtained by connecting p to the boundary points of the shape. We compute a coarse histogram where each vector v joining p and a contour point,
represented by a radius r and an angle θ, contributes to the bin k using the log-polar quantization introduced in [3]: hp (k) = #{q ∈ {contour points} : (q − p) ∈ bin(k)} To approximate salient points of the leaf, Harris points are computed. This description corresponds to the SC2 scenario of [18]. It represents the salient points, in the context defined by the leaf margin (cf. Figure 1(b)). In the rest of the paper, this descriptor is denoted as SC2.
(a)
(b)
Fig. 1. Detected points on the leaves in SC0 and SC2 (a) Sample points on the leaf margin used in SC0 (b) Salient points in red and contour points in blue, used in SC2.
2.2
Leaf margin description
Two different types of shape-based description of the leaf margin are considered here. The fist one is based on the shape context descriptor and the second one is a multiscale triangular description of the shape boundary. 2.2.1 Shape context descriptor The leaf margin is represented by the shape context histograms of [3] associated to a set of N points regularly sampled on the shape boundary (cf. Figure 1(a)). This corresponds to the SC0 scenario of [18]. We will use SC0 to denote this descriptor in what follows. 2.2.2 Multiscale triangular representation of the shape The shape contour is represented by a set of triangular representation associated to a sequence of N sample points p1 , ...pN uniformly distributed over the contour and numbered in a clockwise order. More precisely, each boundary point pi is associated with Ns triangles Ti1 , ..., TiNs , Tik being the triangle defined by the contour points pi−d(k) , pi and pi+d(k) , 1 ≤ k ≤ Ns . Ns is both the number of triangles and the number of scales and d(k) is the distance between the triangle points at scale k, expressed in the number of boundary points, with 1 ≤ k ≤ Ns and d being an increasing function such that d(Ns ) ≤ N/2. The choice of Ns
(a)
(b)
(c)
Fig. 2. Multiscale triangular representation. (a) N boundary points of the leaf. Here N = 22. (b) Ns boundary points are selected on each side of pi . pi is represented by two triangles (Ns = 2 with d(1) = 2 and d(2) = 4) (c) pi is represented by four triangles and logarithmic distance between triangle points (Ns = 4 with d(1) = 1, d(2) = 2, d(3) = 4 and d(4) = 8)
depends on whether we are seeking to capture local or global information. The distance d(k) may be either uniform or logarithmic. (cf. Figure 2). Two representations are associated to each pi : TAR(pi ) = (TAR(Ti1 ), ..., TAR(TiNs )) and TSL(pi ) = (TSL(Ti1 ), ..., TSL(TiNs )), where T AR is the triangle area representation and T SL the triangle side lengths representation described below. The shape is then described by N feature vectors T (pi ); 1 ≤ i ≤ N , T being either TAR, TSL triangle representation. T AR and T SL are both invariant to translation and rotation of the shape. By normalizing the description locally, we also obtain a scale invariant description of the shape. Triangle area representation(TAR) For each triangle T , TAR(T ) = A(T ), where A(T ) is the signed area of T . TAR is affine-invariant, robust to noise and provides information about local concavities or convexities at a given boundary point as the signed area is computed. A normalization is made locally with respect to the maximum area in each scale as in [2]. However, the T AR used in this paper is different from the original T AR: - Here, only a set of N points sampled on the contour is used. - The number of scales is a parameter (Ns ) while in [2] M 2 − 1 scales are systematically used, where M is the number of points in the contour. - The matching process is different. A dynamic space wrapping is used in [2] to compare global signatures of the shapes at each scale. Here, the feature associated to a contour point takes into account all the selected scales and then a similarity measure based on a locality sensitive hashing is used to find similar points. Triangle side lengths representation (TSL) Considering the following property of similar triangles -”all three pairs of corresponding side lengths are in the same proportion”-, we define the TSL representation that uses the side lengths instead of the area, to represent a triangle.
Let L1k , L2k and L3k be the three side lengths sorted in ascending order (L1k ≤ L2k ≤ L3k ) of triangle Tik formed by the points pi−d(k) , pi and pi+d(k) , k ∈ {1, ..., Ns } of the shape contour. Let Mk = L1k /L3k and Nk = L2k /L3k . Then TSL(Tik ) = (Mk , Nk ). The three side lengths of Tik are proportional to Mk , Nk and 1; this is also the case for any triangle similar to Tik . Thus similar triangles have an equal TSL representation and TSL is invariant under scale, translation, rotation and reflection around the contour points (see figure 3).
2.3
Matching method
The feature matching process is the same for SC0, SC2, T AR and T SL. It is done by an approximate similarity search technique based on a Locality Sensitive Hashing (LSH) method [11]. We use the distance L2 to compute the similarity between two feature vectors. The principle of this algorithm is to project all the features in an L dimensional space and to use hash functions to reduce the search and the cost time. At query time, the features F1 , F2 , ..., FN of the query image are mapped onto the hash tables and the k-nearest neighbours of each feature Fi are searched for in the buckets associated to Fi . These N lists of candidate feature matches are used as input for a voting system to rank images according to the number of matched features.
Fig. 3. Four triangles having the same T SL representation. T2 is a result of a rotation of T1 around pi while T3 is the mirror image of T1 w.r.t. a horizontal line. Note that the vertex angle pi of T4 is different from the vertex angle pi of the other triangles.
2.4
Fusion method
All the descriptors are computed independently. Let BD be either SC0, T AR or T SL. The combination of BD with SC2 is done by a late fusion on the feature similarity ranking lists corresponding to the image queries. For each leaf query image Q, BD and SC2 return a list of images belonging to the same database but ordered differently: a same image may be present in both lists, but at a different rank. We then use the Leave Out algorithm (LO) [12] on the lists composed of the 30 first results to obtain the final list.
3
Results
Our descriptors have been tested on three leaf datasets: the Flavia dataset [23], the ImageCLEF dataset in 2011 [8] and in 2012 [9]. In all the experiments, a leaf image contains a single leaf on a uniform background. A preprocessing step is required to isolate the leaf area. First, we apply the Otsu threshold method to remove the background and keep only the mask corresponding to the leaf. A closed contour is then extracted from the leaf mask.
3.1
The Flavia dataset
The Flavia dataset is composed of 1907 scans of leaves belonging to 32 species. Several methods were tested in [13] on Flavia. To compare our approach with them, we used the evaluation metrics presented in [13]: the Mean Average Precision (MAP) and the recall/precision curves. In this experiment, we used: 400 boundary points and 10 scales (N = 400, Ns = 10) for both T AR and T SL, 100 contour points for SC0 and 100 salient points for SC2. The results are reported in Figure 4. Analysing the individual performance of 1
S C2 TAR
0.9
TS L S C2 + TAR 0.8
S C2 + TSL
0.7
Recall
0.6
0.5
0.4
0.3
0.2
0.1
0
0
0.1
0.2
0.3
0.4
0.5
0.6
0.7
0.8
0.9
1
P recision
Fig. 4. Results on the Flavia dataset. Left: Mean Average precision (MAP). Right: Recall/Precision curves.
the presented descriptors, we observe that SC2 improves slightly the state-of-art methods and the T SL descriptor significantly outperforms other methods. The combination of the SC2 with the shape based approaches is promising when the triangular methods are used. Recall/precision curves presented in Figure 4 confirm that the combinations of SC2 and the triangular methods improve the individual scores. Despite the noteworthy similarity of the shapes of many species, our approach shows a high capability to discriminate between species.
3.2
Comparison with ImageCLEF 2011 results
The ImageCLEF 2011 leaf dataset [8] contains three categories of images: scans of leaves acquired using a flat-bed scanner; scan-like leaf images acquired using a digital camera and free natural photos. For each category, the images are divided into a training set and a testing set. The goal of the task is to find the correct tree species of each test image. The identification score is quite different from the classic classification rate (cf. [8] for more details). We focus on scans and scan-like images. The first category contains 2349 images for training and 721 test images. For the scan-like category, 717 images are used for training and 180 images for testing. Table 1 shows the identification scores of our descriptors compared to other submitted runs of ImageCLEF 2011. If we compare the performances of our individual descriptors scores, we observe that T SL is the best on both scan and scan-like images. The combination of SC2 and one of the three shape descriptors, outperforms state-of-art scores. SC2 + T SL remarkably increases the identification score of scans. On the other hand, the combination of SC2 and T SL decreases slightly the score of the T SL descriptor. This is due to the fact that scan-like images may contain noise (shadows, dead leaves, uneven lighting, etc.) that may lead to incorrect salient points detection.
run id Scans Scan-like inria imedia plantnet run1 0.685 0.464 LIRIS run1 0.539 0.543 Sabanci-okan-run1 0.682 0.476 inria imedia plantnet run2 0.477 0.554 DFH+GP [25] 0.778 0.725 SC2 0.676 0.677 SC0 0.654 0.706 T AR 0.721 0.636 T SL 0.802 0.757 SC2 + SC0 0.785 0.705 SC2 + T AR 0.805 0.698 SC2 + T SL 0.839 0.753 Table 1. Normalized classification scores of the scan and scan-like images on the ImageCLEF 2011 dataset using the evaluation metric of [8]
3.3
Comparison with ImageCLEF 2012 results
The formula used to rank the runs in the ImageCLEF 2012 plant identification task is nearly the same as in 2011 (see [9] for details). The scan dataset contains 4870 images for training and 1760 test images. The scan-like category contains 1819 images for training and 907 images for testing. The results are reported in Table 2. The performances of individual descriptors on scans are similar. However, T SL has the best individual score on scan-like images. All the combinations of SC2 and the shape descriptors are equal or
higher than the previous score. Note that SC2 + T SL has the best performance if we average the identification scores on scans and scan-like images. Scans Scan-like Top 3 Scores 0.58 0.59 0.49 0.55 0.47 0.54 SC0 0.52 0.59 SC2 0.51 0.42 T AR 0.52 0.51 T SL 0.52 0.61 SC2 + SC0 0.58 0.61 SC2 + T AR 0.61 0.59 SC2 + T SL 0.60 0.64 Table 2. Normalized classification scores of the scan and scan-like images using the evaluation metric of [9] (ImageCLEF 2012)
Fig. 5. Retrieval tests showing the first five returned images. The descriptors used are: T SL (Top), SC2 (Middle) and SC2 + T SL (Bottom). The query image is framed by a solid line. Irrelevant returned images are framed by a dashed red line.
3.4
SC2+TSL description
Figure 5 illustrates the complementarity of SC2 and T SL. In fact, like most of shape-based approaches, a classic case of failure is when shapes from different classes are very similar. When we deal with botanical data, this case occurs when two leaves have nearly the same shape but they belong to different species. In this case, another source of information is required to discriminate between leaves. This additional information can be either venation or texture. These two features are represented by the salient points included in the SC2 descriptor. If we take a close look to the three retrieval tests shown in Figure 5, we note that a shape-based approach as T SL, is not discriminant enough when the shapes are very similar. SC2 gives a better retrieval result compared to T SL. This can
be explained by the fact that SC2 includes internal informations of the leaf. The combination of these two descriptors is more accurate and all the first five returned images are relevant.
4
Conclusion
We have presented a novel approach for plant species recognition. It merges two sources of information provided by the leaf: the salient points and the margin. The combination of SC2 and a shape descriptor generally improves the retrieval results. In particular, SC2 + T SL has achieved high identification rates on scans of leaves. Experiments have also shown that T SL gives better identification scores than T AR. This may be due to the fact that using side lengths to represent a triangle is more accurate than using the area, in the context of leaf shape representation for plant species identification. In fact, the T SL description takes into account the property of similar triangles. In our future work, we want to develop a specific detector of the leaf salient points, instead of using Harris detector.
5
Acknowledgements
This research has been conducted with the support of the Agropolis Foundation through the Pl@ntNet project. We would like also to thank Vera Baki´c for her help to accomplish this work and Richard James for revising the English of this paper.
References 1. Alajlan, N., Kamel, M., Freeman, G.: Geometry-based image retrieval in binary image databases. Pattern Analysis and Machine Intelligence, IEEE Transactions on 30(6) (June 2008) 1003 –1013 2. Alajlan, N., Rube, I.E., Kamel, M.S., Freeman, G.: Shape retrieval using trianglearea representation and dynamic space warping. Pattern Recognition 40(7) (2007) 1911 – 1920 3. Belongie, S., Malik, J., Puzicha, J.: Shape matching and object recognition using shape contexts. IEEE Transactions on Pattern Analysis and Machine Intelligence 24(4) (April 2002) 509 –522 4. Caballero, C., Aranda, M.C.: Plant species identification using leaf image retrieval. In: ACM International Conference on Image and Video Retrieval (CIVR). (2010) 327–334 5. Cope, J.S., Corney, D., Clark, J.Y., Remagnino, P., Wilkin, P.: Plant species identification using digital morphometrics: A review. Expert Systems with Applications 39(8) (2012) 7562 – 7573 6. Du, J.X., Wang, X.F., Zhang, G.J.: Leaf shape based plant species recognition. Applied Mathematics and Computation 185(2) (2007) 883 – 893 7. El Rube, I., Alajlan, N., Kamel, M., Ahmed, M., Freeman, G.: Robust multiscale triangle-area representation for 2D shapes. In: Image Processing, 2005. ICIP 2005. IEEE International Conference on. Volume 1. (September 2005) I – 545–8
8. Go¨eau, H., Bonnet, P., Joly, A., Boujemaa, N., Barthelemy, D., Molino, J.F., Birnbaum, P., Mouysset, E., Picard, M.: The CLEF 2011 plant images classification task. In: CLEF (Notebook Papers/Labs/Workshop). (2011) 9. Go¨eau, H., Bonnet, P., Joly, A., Yahiaoui, I., Barth´el´emy, D., Boujemaa, N., Molino, J.F.: The IMAGECLEF 2012 Plant identification Task. In: CLEF 2012, Rome, Italy (September 2012) 10. Ip, H.H., Shen, D.: An affine-invariant active contour model (ai-snake) for modelbased segmentation. Image and Vision Computing 16(2) (1998) 135 – 146 11. Joly, A., Buisson, O.: A posteriori multi-probe locality hashing. In: 16th ACM international conference on Multimedia. (2008) 209–218 12. Jovi´c, M., Hatakeyama, Y., Dong, F., Hirota, K.: Image retrieval based on similarity score fusion from feature similarity ranking lists. In: Third international conference on Fuzzy Systems and Knowledge Discovery. (2006) 461–470 13. Laga, H., Kurtek, S., Srivastava, A., Golzarian, M., Miklavcic, S.: A riemannian elastic metric for shape-based plant leaf classification. In: Digital Image Computing: Techniques and Applications. (2012) 14. Ling, H., Jacobs, D.: Shape classification using the inner-distance. IEEE Transactions on Pattern Analysis and Machine Intelligence 29(2) (February 2007) 286 –299 15. Mingqiang, Y., Kidiyo, K., Joseph, R.: A survey of shape feature extraction techniques. Pattern Recognition Techniques, Technology and Applications (2008) ISBN: 978-953-7619-24-4, InTech. 16. Mokhtarian, F., Abbasi, S.: Matching shapes with self-intersections: application to leaf classification. IEEE Transactions on Image Processing 13(5) (May 2004) 653 –661 17. Mokhtarian, F., Abbasi, S., Kittler, J.: Robust and efficient shape indexing through curvature scale space. In: British Machine Vision Conference (BMVC). (1996) 18. Mouine, S., Yahiaoui, I., Verroust-Blondet, A.: Advanced shape context for plant species identification using leaf image retrieval. In: 2nd ACM International Conference on Multimedia Retrieval (ICMR 2012). (2012) 49:1–49:8 19. Nam, Y., Hwang, E., Kim, D.: A similarity-based leaf image retrieval scheme: Joining shape and venation features. Computer Vision and Image Understanding 110(2) (2008) 245 – 259 20. Neto, J.C., Meyer, G.E., Jones, D.D., Samal, A.K.: Plant species identification using elliptic Fourier leaf shape analysis. Computers and Electronics in Agriculture 50(2) (2006) 121 – 134 21. Shen, D., Wong, W., Ip, H.: Affine-invariant image retrieval by correspondence matching of shapes (May 1999) 22. Shen, D., Ip, H.H., Teoh, E.K.: Affine invariant detection of perceptually parallel 3d planar curves. Pattern Recognition 33(11) (2000) 1909 – 1918 23. Wu, S., Bao, F., Xu, E., Wang, Y.X., Chang, Y.F., Xiang, Q.L.: A leaf recognition algorithm for plant classification using probabilistic neural network. In: Signal Processing and Information Technology, 2007 IEEE International Symposium on. (December 2007) 11 –16 24. Xie, J., Heng, P.A., Shah, M.: Shape matching and modeling using skeletal context. Pattern Recogn. 41(5) (May 2008) 1756–1767 25. Yahiaoui, I., Mzoughi, O., Boujemaa, N.: Leaf shape descriptor for tree species identification. In: Proceedings of the 2012 IEEE International Conference on Multimedia and Expo, ICME 2012. (2012) 254–259 26. Zahn, C.T., Roskies, R.Z.: Fourier descriptors for plane closed curves. IEEE Trans. Comput. 21(3) (March 1972) 269–281