International Journal of
Molecular Sciences Article
Combining Primed Photoconversion and UV-Photoactivation for Aberration-Free, Live-Cell Compliant Multi-Color Single-Molecule Localization Microscopy Imaging David Virant, Bartosz Turkowyd, Alexander Balinovic and Ulrike Endesfelder * Department of Systems and Synthetic Microbiology, Max Planck Institute for Terrestrial Microbiology & LOEWE Center for Synthetic Microbiology (SYNMIKRO), Karl-von-Frisch-Str. 16, 35043 Marburg, Germany;
[email protected] (D.V.);
[email protected] (B.T.);
[email protected] (A.B.) * Correspondence:
[email protected]; Tel.: +49-6421-28-21619 Received: 11 June 2017; Accepted: 5 July 2017; Published: 14 July 2017
Abstract: Super-resolution fluorescence microscopy plays a major role in revealing the organization and dynamics of living cells. Nevertheless, single-molecule localization microscopy imaging of multiple targets is still limited by the availability of suitable fluorophore combinations. Here, we introduce a novel imaging strategy which combines primed photoconversion (PC) and UV-photoactivation for imaging different molecular species tagged by suitable fluorescent protein combinations. In this approach, the fluorescent proteins can be specifically photoactivated/-converted by different light wavelengths using PC and UV-activation modes but emit fluorescence in the same spectral emission channel. We demonstrate that this aberration-free, live-cell compatible imaging method can be applied to various targets in bacteria, yeast and mammalian cells and can be advantageously combined with correlative imaging schemes. Keywords: multi-color imaging; primed conversion; live cell imaging; single-molecule localization microscopy
1. Introduction Over the past decade, rapid advances in single-molecule localization microscopy (SMLM) techniques have created a large, quantitative imaging toolbox which allows for the direct observations of molecular processes of life at the nanometer scale [1–3]. Part of its tremendous impact is owed to the fact that, just like in conventional fluorescence microscopy, individual species of molecules can be visualized and placed into context to each other by specific fluorescence tags in situ as well as in vivo. Nowadays, multi-color SMLM imaging is frequently performed. However, while several approaches for multi-color SMLM imaging in fixed cells have been optimized for ideal combinations of bright fluorophores with complementary staining (e.g., antibody, nanobody or protein-tag stainings), similar photoswitching requirements and distinct read-out, the choice of fluorophore combinations for multi-color imaging of difficult-to-access or densely packed samples or under physiological conditions and in living cells remains challenging [3–5]. Especially in live-cell applications the choice of suitable fluorophore pairs is limited: apart from a small number of membrane-permeable, fluorescent dyes, which photoswitch in cellular environments without the need of further imaging buffers (e.g., tetramethylrhodamine (TMR) or Atto655 [3] or the recently developed paJF549 [6]), the most popular fluorophores are genetically encoded, photoactivatable or photoconvertible fluorescent proteins (pa- and pcFPs) like the widespread Anthozoan green-to-red pcFPs (e.g., the Eos, Dendra, Maple and Dronpa families) and DsRed derived dark-to-red paFPs (e.g., PAmCherry, PAmKate and Int. J. Mol. Sci. 2017, 18, 1524; doi:10.3390/ijms18071524
www.mdpi.com/journal/ijms
Int. J. Mol. Sci. 2017, 18, 1524
2 of 13
PAtagRFPs) [1,4,5,7]. Despite being popular in quantitative imaging and single-particle tracking approaches [2,5,8], the simultaneous use of multiple pcFPs and paFPs is largely precluded by their overlapping absorption and emission spectra: they are photoactivated/-converted by illumination in the near UV light range and a vast majority of common FPs with desirable properties (being bright and monomeric, exhibiting robust photophysics in varying redox-environment and a quantitative read-out [1,4,5]) emit fluorescence in a narrow, orange-red emission channel with only a few alternative FPs in other color channels, e.g., the green fluorescing paGFP [9], psCFP2 and Dronpa [10], or the red fluorescing psmOrange [11], which have been used for dual-color SMLM. By utilizing the recently developed photoconversion technique of primed conversion (PC) for green-to-red pcFPs, we here introduce a new dual-color strategy. PC, which was first identified and characterized for Dendra2 [12,13] and has recently been shown to be very efficient for green-to-red pcFPs with threonine at residue 69, makes use of a combined illumination of 488 nm and near-infrared light in the range 700–800 nm instead of the common UV-photoconversion to convert common pcFPs from their green to their red form [12,14]. paFPs, on the other hand, only absorb light in the ultraviolet range prior to activation. As such, the 488 nm light used for PC should have no effect on the paFP. We propose that this fact could be advantageously exploited in a dual-phase, dual-color imaging scheme with a single fluorescence read-out channel. First, a PC-suitable pcFP, e.g., Dendra2 [12–15] or mEos3.2-A69T [14], is imaged using a combination of 488 and 730 nm light for photoconversion. After all pcFPs have been read out, the still-intact paFP, e.g., the commonly used PAmCherry [16], can be imaged in the second phase by UV-light mediated photoactivation. The benefits of such an approach are substantial. Since both targets are imaged in the same channel, chromatic aberration is eliminated. Both FP-tags can be endogenous, requiring no additional staining, and the above chosen FPs are bright and show no oligomerization tendencies [17]. In addition, as they fluoresce with a maximum in the 570–590 nm range upon 561 nm illumination, possible auto-fluorescence of biological samples and phototoxicity are reduced when compared to techniques using shorter wavelength channels [14,18]. This makes this labeling choice favorable compared to other, e.g., non-red, less bright and photostable or potentially self-oligomerizing pcFPs and paFPs such as paGFP [9,19], psCFP2 and Dronpa [10] or PAtagRFP [20] and PAmKate [7]. Finally, our strategy works hand in hand with existing, multi-channel approaches and can be easily used to expand them. 2. Results and Discussion To evaluate the viability of the proposed imaging scheme, two main concerns had to be addressed. First, does PC illumination have any effect on the paFP? Second, is it possible to sufficiently eliminate the pcFP imaged by PC to not cause any cross-talk during the second imaging phase as any residual, non-converted pcFP molecule would also be read-out by UV light. To test this, we performed experiments on fixed Escherichia coli cells, where the native RNA polymerase (RNAP) protein was endogenously tagged with either Dendra2 or PAmCherry (Supplementary Material and Methods). RNAP molecules appear in large nucleoid-like patterns as they decorate the bacterial chromosome. Their numbers per unit of cell size are relatively stable when expressed under the native promoter, making RNAP a satisfactory target for quantitative controls [21]. First, we determined the minimum dose of 488 nm light required to permanently bleach all Dendra2-RNAP molecules in the E. coli cells (Figure S1a). A bleaching approach like this would be necessary in a worst-case scenario, where full readout of the PC-suitable pcFP is not feasible, e.g., in cases where the POI is highly abundant. We then evaluated the effect of this high 488 nm dose on the PAmCherry molecules (Figure S1a). While the vast majority of the Dendra2-RNAP read-out in the red channel was gone after 30 s of illumination with 1 kW/cm2 of 488 nm light, we used 120 s for subsequent imaging since that is where the bleaching curve stabilized. Using the same settings, we found that 488 nm illumination slightly increased the fluorescence intensity in cells with PAmCherry-tagged RNAP, suggesting some minor activation (Figure S1a). With this information we were able to design a worst-case scenario control imaging scheme (Figure S1b,
Int. J. Mol. Sci. 2017, 18, 1524
3 of 13
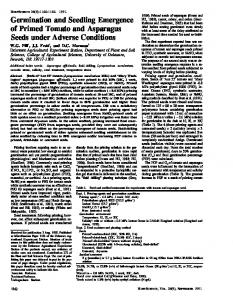
left). To quantify the loss of PAmCherry during the first, PC-photoconversion stage of imaging and potential bleed-through of Dendra2 into the second UV-photoactivation phase, we performed localization counting on E. coli cells expressing RNAP-Dendra2 and RNAP-PAmCherry under several different illumination schemes (Figure S1b, right). RNAP-Dendra2 produced a mean of 1092 ± 175 (standard deviation) localization counts/µm2 converted by primed conversion (I) and a mean of 999 ± 131 localization counts/µm2 (II) by UV photoconversion which is in agreement with previous results on RNAP numbers [21,22] and reconfirms data of a recent study which did not show any differences in quality and quantitative numbers obtained in sptPALM tracking studies comparing UV and PC photoconversion of Dendra2 [14]. After 120 s of bleaching with 1 kW/cm2 488 nm light, Dendra2 was activated by UV conversion and produced 54 ± 18 localization counts/µm2 (III), which is at the level of false positive localization counts in wild type E. coli (data not shown), confirming that little to no Dendra2 survives the bleaching step. Next, we evaluated the UV readout of RNAP-PAmCherry, resulting in 1054 ± 217 counts/µm2 (IV), which is comparable to the Dendra2 PC readout. To test the effects of high intensity 488 nm light on PAmCherry, RNAP-PAmCherry expressing cells were illuminated with the same high intensity of 1 kW/cm2 488 nm light for 120 s, and then read out with UV activation, producing 916 ± 182 counts/µm2 (V), further suggesting that 488 nm light activates PAmCherry with low efficiency. This, however, proved not to be an issue during the conversion imaging phase, where the overall dosage of 488 nm light is much lower (less than 0.1% of the bleaching dose of 1 kW/cm2 used in this experiment). PAmCherry read out by PC activation, produced 45 ± 19 counts/µm2 (VI), again at the level of background in wild type E. coli. To eliminate cross-talk, we thus implemented a brief, ~10 s pre-bleaching step with the 561 nm light readout laser before reading out the PAmCherry, bleaching away any pre-activated FP. These findings suggest that if the FP in the first phase of imaging is read out in full and a high intensity 488 nm post-bleaching step is not required, loss of PAmCherry is completely negligible. In such a case, both phases allow for a full quantitative SMLM readout. Encouraged by the promising results of the controls, we decided to evaluate how well our approach performs in dual-color imaging of different biomolecules in E. coli and in a second step, how well it integrates with additional correlative imaging schemes such as membrane point accumulation for imaging of nanoscale topography (PAINT) and DNA stains [23]. To test this, we utilized the imaging scheme on an E. coli strain where RNAP was endogenously tagged with the PC-suitable mEos3.2-A69T mutant and transformed with the pJB063 plasmid bearing the sequence for FtsZ-PAmCherry. The green-to-red pcFP mEos3.2-A69T mutant has proven, like Dendra2, to be an excellent candidate for tagging native proteins in our previous work but with a 15–20% higher photoncount for single-molecule-spots than Dendra2—thus allowing for more precise sptPALM data [14]. RNAP-mEos3.2-A69T was imaged first and read out in full (Figure 1a), followed by a full readout of FtsZ-PAmCherry (Figure 1b). Nile-red was then added to the imaging solution to image the membrane by PAINT [24] (Figure 1c) and was finally replaced with a Sytox orange containing solution, to stain the DNA (Figure 1d), for a total of four effective colors all in the orange-red channel (Figure 1e).
Int. J. Mol. Sci. 2017, 18, 1524 Int. J. Mol. Sci. 2017, 18, 1524
4 of 13 4 of 13
Figure 1. 1. (a–d) imaging workflow workflow in in E. E. coli coli cells. cells. Top: the acquisition acquisition Figure (a–d) Multi-color Multi-color imaging Top: scheme scheme representing representing the sequence by by first first imaging imaging RNAP-mEos3.2-A69T RNAP-mEos3.2-A69T (orange (orange dots) dots) by by primed primed conversion-PALM, conversion-PALM, not not sequence activated FtsZ-PAmCherry molecules are depicted as black dots (a); FtsZ-PAmCherry (orange dots) activated FtsZ-PAmCherry molecules are depicted as black dots (a); FtsZ-PAmCherry (orange dots) by UV UV activation-PALM, activation-PALM, permanently permanently bleached bleached RNAP-mEos3.2-A69T RNAP-mEos3.2-A69T are are presented presented as as dashed-lined dashed-lined by white dots dots (b); fluorescent fraction of white (b); The The outer outer membrane membraneby byPAINT PAINTusing usingNileRedNileRed-red reddots dotsdepict depict fluorescent fraction NileRed molecules in inthe NileRed in in of NileRed molecules themembrane, membrane,whereas whereasgray graydots dots represent represent non-fluorescent non-fluorescent NileRed buffer/medium (c) Orange (orange diamonds) and read-out by buffer/medium (c)and andlast lastthe theDNA DNAstained stainedbybySYTOX SYTOX Orange (orange diamonds) and read-out nearnear TIRFTIRF microscopy (d). Middle: Measured absorption and emission of all four fluorophores by microscopy (d). Middle: Measured absorption andspectra emission spectra of all four used (Supplementary Material andMaterial Methods). lineDashed rectangle represents optical the bandpassfluorophores used (Supplementary andDashed Methods). line rectangle the represents optical filter used to visualize the fluorescence channel channel of all four Bottom:Bottom: SMLMSMLM image bandpass-filter used to visualize the fluorescence of allacquisitions. four acquisitions. reconstructions (a–c) and (d) recorded; (e) Overlay of all individual images to image reconstructions (a–c)nearTIRF-snapshot and nearTIRF-snapshot (d) recorded; (e) Overlay of all individual images show thethe mutual to show mutualorganization organizationofofimaged imagedcompounds, compounds,aligned alignedby by fiducial fiducial markers (Supplementary Material and andMethods). Methods).Localization Localization precision of channels the channels drift correction ROI, Material precision of the after after drift correction (whole(whole ROI, NeNA NeNA values): mEos3.2-A69T (RNAP) 12.1 nm, PamCherry 12.3NileRed nm, NileRed (membrane) values): mEos3.2-A69T (RNAP) 12.1 nm, PamCherry (FtsZ)(FtsZ) 12.3 nm, (membrane) 11.8 11.8 nm, nm, scale scale bars:bars: 1 µm.1 μm.
Next, we we assessed assessed how how well well the the technique technique performs performs on on larger larger samples samples in in other other organisms organisms by by Next, imagingHeLa HeLacells cells transiently transfected a combination of an actin-PAmCherry plasmid imaging transiently transfected withwith a combination of an actin-PAmCherry plasmid together together with either a keratin-Dendra2 plasmid (Figure 2a) or an H2B-Dendra2 plasmid (Figure with either a keratin-Dendra2 plasmid (Figure 2a) or an H2B-Dendra2 plasmid (Figure 2b), details 2b), can details can be found in Supplementary Material and Methods. As before, the pcFP, Dendra2, was be found in Supplementary Material and Methods. As before, the pcFP, Dendra2, was read out first. read to out first. Due toof thethe large the number cell and of large number of (overexpressed) molecules full Due the large size cell size and of large (overexpressed) molecules a full read-outawas read-out was rather time consuming, thus we decided to bleach the residual Dendra2 molecules after rather time consuming, thus we decided to bleach the residual Dendra2 molecules after obtaining a obtainingnumber a sufficient number offorlocalizations for imageThe reconstruction. Thenm intensity ofstep 488 had nm sufficient of localizations image reconstruction. intensity of 488 bleaching 2 in order to fully bleach the residual Dendra2 bleaching step had to be increased to 4 kW/cm 2 to be increased to 4 kW/cm in order to fully bleach the residual Dendra2 molecules above and below molecules above and thecross imaging plane. No visible cross talkimages, was present on any of by thethe images, the imaging plane. Nobelow visible talk was present on any of the as showcased dark as showcased by the dark background around the H2B (Figure 2b(v)). background around the H2B (Figure 2b(v)).
Int. J. Mol. Sci. 2017, 18, 1524 Int. J. Mol. Sci. 2017, 18, 1524
5 of 13 5 of 13
Figure 2. 2. Two Two examples examplesof ofHela Hela cells cells imaged imaged with with sequential sequential PC PC activation. activation. (a): (a): (i) (i) Dual-color Dual-color PALM PALM Figure image of actin tagged with PamCherry (green) and keratin tagged with Dendra2 (red); (ii,iii) split image of actin tagged with PamCherry (green) and keratin tagged with Dendra2 (red); (ii,iii) split channel PALM images of the same cell. Localization precision of the channels after drift correction channel PALM images of the same cell. Localization precision of the channels after drift correction (whole ROI, ROI, NeNA NeNA values): values): Dendra2 Dendra2 (red, (red, keratin) keratin) 17.2 17.2 nm, nm, PamCherry PamCherry (green, (green, actin) actin) 17.4 17.4 nm, nm, scale scale (whole bars 55 µm; μm; (iv–vi) (iv–vi) zoom zoom in in on on an an area area with with details details only only visible visible in in the the super super resolved resolved image, image, scale scale bars bars bars μm; (b): (b): (i) (i) Dual-color Dual-color PALM PALM image image of of actin actin tagged tagged with with PAmCherry PAmCherry (green) (green) and and H2B H2B tagged tagged with with 22 µm; Dendra2 (red) (red) and and split split channel channel images images of of the the same same cell cell (ii,iii). (ii,iii). Localization Localization precision precision of of the the channels channels Dendra2 afterdrift driftcorrection correction(whole (whole ROI, NeNA values): Dendra2 16.1 PamCherry nm, PamCherry after ROI, NeNA values): Dendra2 (red,(red, H2B)H2B) 16.1 nm, (green,(green, actin) actin) 18.9 nm,bars scale bars(iv–vi) 5 μm; zoom (iv–vi)inzoom on the nucleus, showcasing the of absence of bleed 18.9 nm, scale 5 µm; on theinnucleus, showcasing the absence bleed through through (dark background on (vi)), (dark background on (vi)), scale barsscale 2 µm.bars 2 μm.
A major major advantage advantage of of the the approach approach is is its its potential potential for for use use in in living living cells, cells, especially especially for for targets targets A which are are difficult-to-reach difficult-to-reach by by extrinsic extrinsic fluorescent fluorescent markers markers or or have have precluded precluded SMLM SMLM read-out read-out which channels due to low signal-to-noise/high background, e.g., arising from intracellular channels due to low signal-to-noise/high background, e.g., arising from intracellular autofluorescence. autofluorescence. all (sequential) SMLM techniques, ourby approach is limited by theneeded temporal Like all (sequential)Like SMLM techniques, our approach is limited the temporal resolution for resolution needed for structural studies of abundant proteins but offers the read-out of two different structural studies of abundant proteins but offers the read-out of two different proteins by intrinsic proteins intrinsic FP labels with excellenttoSMLM properties to measure their molecule FP labelsby with excellent SMLM properties measure their molecule dynamics within dynamics the same within the same compartment or cell [25]. compartment or cell [25]. We thus thus first first tested tested our our E. E. coli coli strain strain under under live live conditions conditions (Figure (Figure S2a), S2a), measuring measuring diffusion diffusion We dynamics for RNAP and FtsZ (Figure S2b,c) as reported before [14,26] and could confirm the cell cell dynamics for RNAP and FtsZ (Figure S2b,c) as reported before [14,26] and could confirm the survival after after sptPALM sptPALMimaging imaging[14] [14](Figure (FigureS2d). S2d). survival We then challenged our approach by creating strain of of the the fission fission yeast yeast Schizosaccharomyces Schizosaccharomyces We then challenged our approach by creating aa strain pombe, where where the the DNA DNA binding binding protein protein cbp1 cbp1 and and the the centromeric centromeric histone histone variant variant protein protein cnp1 cnp1 were were pombe, endogenously tagged with Dendra2 and PAmCherry, respectively (Supplementary Material and endogenously tagged with Dendra2 and PAmCherry, respectively (Supplementary Material and Methods). Introducing fluorophores for live cell SMLM imaging into S. pombe is difficult. In our Methods). Introducing fluorophores for live cell SMLM imaging into S. pombe is difficult. In our hands, only only few few extrinsic extrinsic labels labels can can be be delivered delivered to to protein-tag-fusions protein-tag-fusions but but are are prone prone to to unspecific unspecific hands, background staining due to the cell wall and dense intracellular environment and do not blink in the the background staining due to the cell wall and dense intracellular environment and do not blink in intracellular living yeast environment (unpublished data). Additionally, dual-color SMLM imaging intracellular living yeast environment (unpublished data). Additionally, dual-color SMLM imaging including aa green green FP FP does does not not provide provide satisfactory satisfactory single single molecule molecule signal signal above above the the intracellular intracellular including background (unpublished data). Thus, even most recent SMLM studies of living S. pombe have have background (unpublished data). Thus, even most recent SMLM studies of living S. pombe remained exclusively single-color using mEos2/mEos3 [27,28] which is in contrast to mammalian cell remained exclusively single-color using mEos2/mEos3 [27,28] which is in contrast to mammalian cell studies,where where multi-color SMLM introducing dye molecules in the environment intracellular studies, multi-color SMLM introducing dye molecules that blinkthat in theblink intracellular environment has been applied in various studies [1,3]. has been applied in various studies [1,3]. As in in E. E. coli, coli, control control measurements measurements characterizing characterizing the the viability viability of of our our living living cells cells revealed revealed no no As negative effect of our imaging approach on the cellular growth (Figure S3a–d). As before, Dendra2 negative effect of our imaging approach on the cellular growth (Figure S3a–d). As before, Dendra2 was read out first, with lower 561 nm readout laser intensities and shorter exposure times, to capture
Int. J. Mol. Sci. 2017, 18, 1524
6 of 13
Int. J. Mol. Sci. 2017, 18, 1524
6 of 13
was read out first, with lower 561 nm readout laser intensities and shorter exposure times, to capture the movement movement of of single single molecules molecules (Figure (Figure 3a,b(i)). 3a,b(i)). PAmCherry-cnp1 PAmCherry-cnp1 was was successfully successfully read read out out in in the the the second phase, with no apparent crosstalk (Figure 3a,b(ii)). The cells were then fixed and stained with second phase, with no apparent crosstalk (Figure 3a,b(ii)). The cells were then fixed and stained with DAPI (Figure (Figure 3a,b(iii)), 3a,b(iii)), since since Sytox Sytox Orange Orange penetrated penetrated the the thick thick yeast yeast cell cell wall wall poorly poorly in in our our hands hands DAPI (data not not shown). shown). As As expected, expected, reconstructed reconstructed PALM PALM images images showed showed cbp1 cbp1 is is present present throughout throughout the the (data nucleus and co-localizes with DNA, while cnp1 appears as a single centromeric spot at the edge of nucleus and co-localizes with DNA, while cnp1 appears as a single centromeric spot at the edge of the the DNA (Figure 3a,b(iv)). We then applied a custom single particle tracking algorithm onsame the same DNA (Figure 3a,b(iv)). We then applied a custom single particle tracking algorithm on the data data and visualized the results (details in materials and methods), which showed that the cbp1 and visualized the results (details in materials and methods), which showed that the cbp1 diffuses diffusesthe around the while nucleus, thelargely cnp1 is largely immobile (Figure 3a(v)).we Finally, we calculated around nucleus, thewhile cnp1 is immobile (Figure 3a(v)). Finally, calculated diffusion diffusion coefficients for tracks longer than four consecutive frames, arevealing a mobile (fast) and an coefficients for tracks longer than four consecutive frames, revealing mobile (fast) and an immobile immobile (slow) fraction of cbp1 (Figure 3b(iv)) and exemplary mean squared displacement (MSD)(slow) fraction of cbp1 (Figure 3b(iv)) and exemplary mean squared displacement (MSD)-curves in curves S4a). in Figure S4a). fixed Imaging fixed cbp1 molecules as aunder control under otherwise same conditions Figure Imaging cbp1 molecules as a control otherwise same conditions reveals reveals that the slowis fraction is indeed moving within the precision of measurements the sptPALM that the slow fraction indeed not movingnot within the precision of the sptPALM measurements represents immobile,cbp1 DNA-bound cbp1 molecules whereasofthe fraction of mobile and represents and immobile, DNA-bound molecules whereas the fraction mobile cbp1 with a cbp1 heterogeneous with a more heterogeneous of diffusion coefficients represents DNA-associated, more distribution ofdistribution diffusion coefficients represents DNA-associated, but mobile cbp1 but mobile(Figure cbp1 molecules (Figure S4b(i,ii)) [29,30]. molecules S4b(i,ii)) [29,30].
Figure 3. Sequential dual-color PALM on S. pombe. (a) Dual-color PALM image of a representative S. Figure 3. Sequential dual-color PALM on S. pombe. (a) Dual-color PALM image of a representative pombe cell, expressing the DNA binding protein cbp1 tagged with Dendra2 (red) and the centromeric S. pombe cell, expressing the DNA binding protein cbp1 tagged with Dendra2 (red) and the centromeric protein cnp1 tagged with PAmCherry (green) and a widefield fluorescence image of DAPI stained protein cnp1 tagged with PAmCherry (green) and a widefield fluorescence image of DAPI stained DNA (blue): (i–iii) Split channels of the same cell and (iv) combined; (v) single particle track analysis DNA (blue): (i–iii) Split channels of the same cell and (iv) combined; (v) single particle track analysis performed on the same data, with tracks ≥3 consecutive frames represented in red (cbp1) and green performed on the same data, with tracks ≥3 consecutive frames represented in red (cbp1) and green (cnp1), on on top top of of DNA DNA (blue). (blue). Scale Scale bars bars 22 µm; μm; (b) (b) single single particle particle tracking tracking analysis analysis done done on on aa different different (cnp1), S. pombe cell: (i) single particle tracks of cbp1 ≥4 consecutive frames, color coded for their apparent S. pombe cell: (i) single particle tracks of cbp1 ≥4 consecutive frames, color coded for their apparent diffusion coefficient coefficient D D as as calculated calculated from from aa MSD MSD analysis analysis of of the the individual individual tracks, tracks, orange orange for for fast fast diffusion 2/s) and red for slow or immobile (D < 0.26 μm2/s); (ii) single particle moving particles (D > 0.26 μm 2 2 moving particles (D > 0.26 µm /s) and red for slow or immobile (D < 0.26 µm /s); (ii) single particle tracks of of cnp1 frames; (iii) widefield fluorescence image of DNA in the cell, after tracks cnp1 ≥≥4 4consecutive consecutive frames; (iii) widefield fluorescence image of DNA insame the same cell, fixation; (iv) overlay of all three channels. Scale bars 2 μm. after fixation; (iv) overlay of all three channels. Scale bars 2 µm.
3. Materials and Methods 3. Materials and Methods Strain constructions for E. coli and S. pombe cell lines, transient transformations for mammalian Strain constructions for E. coli and S. pombe cell lines, transient transformations for mammalian samples, protein purification, live and fixed cell sample preparations for E. coli, S. pombe and samples, protein purification, live and fixed cell sample preparations for E. coli, S. pombe and mammalian cells as well as the microscopic and spectroscopic equipment are described in detail in mammalian cells as well as the microscopic and spectroscopic equipment are described in detail the Supplementary Information (Supplemantary Materials and Methods). in the Supplementary Information (Supplementary Material and Methods).
Int. J. Mol. Sci. 2017, 18, 1524
7 of 13
3.1. Imaging Procedures 3.1.1. Influence of High Intensity of 488 nm Light on PAmCherry and Dendra2 To determine, whether high intensity of 488 nm light leads to irreversible bleaching of Dendra2 molecules while leaving PAmCherry intact, we imaged fixed MG1655 rpoC_Dendra2 and MG1655 rpoC_PAmCherry cells. First, cells were illuminated with 1 kW/cm2 of 488 nm for 0 to 180 s (Figure S1a) and then illuminated for 15 s with 2.5 W/cm2 of 405 nm light to perform photoactivation or photoconversion of non-bleached fluorescent proteins. In last step, three 60 ms frame snapshots with 800 W/cm2 of the 561 nm laser were taken. 3.1.2. Quantitative Controls-RNAP Molecule Counting To evaluate possible false positives of residual Dendra2 and the amount of pre-activated PAmCherry of the second phase of imaging (Dendra2 converted via UV light or PAmCherry preactivated via 488 nm light), a set of control experiments was performed (Figure S1b). In experiment (I) fixed MG1655 RNAP-Dendra2 cells were illuminated with three lasers: 488 nm pulsed every 20th frame and continuous 561 and 730 nm. Laser intensities were: 100–2500 mW/cm2 of 488 nm (intensity was gradually increased during movie acquisition to keep the number of detected spots roughly on the same level), 800 W/cm2 of 561 nm and 450 W/cm2 of 730 nm. Movies were recorded at 16.67 Hz image acquisition (60 ms per frame) until no new fluorescent spots appeared to ensure for a full read-out of the FP. In experiment (II), MG1655 RNAP-Dendra2 was illuminated by conventional UV-conversion PALM: The 405 nm laser was pulsed every 20th frame, gradually increasing the intensity from 250–6500 mW/cm2 and continuous 561 nm laser at a constant intensity of 800 W/cm2 . The field of view (FOV) was imaged until no new fluorescent spots appeared anymore. As a negative control (III), MG1655 RNAP-Dendra2 was first illuminated for two minutes with 1 kW/cm2 of 488 nm laser to irreversibly bleach the Dendra2 molecules. Next, the same FOV was imaged with standard UV-conversion PALM. Laser intensities were the same as for (II). The FOV was imaged for 5 min with 60 ms exposure time per frame. Experiments (IV)–(VI) were performed on the MG1655 RNAP-PAmCherry strain. Experiment (IV) was a positive control where cells were imaged with UV-conversion PALM: 405 and 561 nm laser settings were the same as for experiment (II) and the FOV was imaged until no new spots appeared. In experiment (V) MG1655 RNAP-PAmCherry cells were imaged in a similar way as cells in experiment (III) with an extended imaging time until no new spots appeared, achieving full read-out. In experiment (VI) which serves as negative control, cells were imaged as the MG1655 RNAP-Dendra2 cells in experiment (I), to evaluate the activation of PAmCherry via primed conversion. FOV was imaged for 5 min. For each control experiment two FOVs were imaged. 3.1.3. E. coli Multi-Color Imaging Detection of RNA polymerase (RNAP) fused with mEos3.2-A69T, FtsZ fused with PAmCherry, bacterial membrane and chromosomal DNA in fixed MG1655 rpoC_mEos3.2-A69T+pJB063 cells was performed sequentially (Figure 1). First, RNAP-mEos3.2-A69T molecules were imaged by primed conversion [14] (Figure 1a). Briefly, the sample was illuminated with three lasers: 488 nm pulsed every 20th frame and continuous 561 and 730 nm light. Laser intensities were: 100–2500 mW/cm2 of 488 nm (intensity was gradually increased during movie acquisition), 800 W/cm2 of 561 nm and 450 W/cm2 of 730 nm. Movies were recorded at 16.67 Hz image acquisition (60 ms per frame) until no new spots appeared. After primed conversion PALM, the sample was illuminated for one minute with 1 kW/cm2 of 488 nm laser to irreversibly bleach residual green form mEos3.2-A69T. In the second phase (Figure 1b) FtsZ-PAmCherry molecules were detected with UV-activation PALM: 405 nm laser pulsed every 20th frame (intensity gradually increasing from 250–6500 mW/cm2 ) and continuous 800 W/cm2 561 nm laser at 60 ms until all PAmCherry was read out. After finishing imaging both, RNAP-mEos3.2-A69T and FtsZ-PAmCherry, Nile Red (Sigma-Aldrich, Darmstadt, Germany) was
Int. J. Mol. Sci. 2017, 18, 1524
8 of 13
added (final concentration in imaging buffer: 7 nM) to visualize the bacterial membrane in the same cells by PAINT microscopy [24] (Figure 1c). Movies were recorded for 7 min with 60 ms exposure time per frame and the sample was illuminated with constant 1.2 kW/cm2 of 561 nm laser. In the last, fourth step (Figure 1d), chromosomal DNA was visualized by addition of SYTOX Orange (Thermo Fischer, Darmstadt, Germany) to a final concentration 20 nM. One-frame 60 ms snapshots were taken with low intensity 561 nm laser (10 W/cm2 ). For all fixed bacteria images, the Nearest Neighbor Analysis (NeNA) values [31] were in the range of 10–15 nm, exact values of the exemplary images are given in the respective captions. Single-particle tracking PALM (sptPALM) imaging (Figure S2) of rpoC_mEos3.2-A69T+pJB063 cells was performed on a heating stage and heated objective at 32 ◦ C. As for the fixed samples, RNAP-mEos3.2-A69T was imaged first and FtsZ-PAmCherry was imaged afterwards. Applied laser intensities were: 2 W/cm2 of 405 nm, 600 mW/cm2 of 488 nm, 450 W/cm2 of 730 nm and 800 W/cm2 of 561 nm laser light. 405 and 488 nm lasers were pulsed every 20th frame. Movies were recorded at 77 Hz image acquisition rate for two minutes to follow the diffusing RNA polymerase and at 33 Hz image acquisition rate for five minutes to follow the FtsZ protein. For the FtsZ imaging we used slower acquisition mode to exclude cytosolic FtsZ molecules—as they diffuse much faster than FtsZ built into the ring structures, their point-spread functions are blurred, thus most of the cytosolic FtsZ molecules are not included in further analysis steps. This approach was first used by Etheridge et al. in their work [32]. mEos3.2-A69T molecules were converted by primed conversion, while PAmCherry was photoactivated using UV. Right after recording the RNAP-mEos3.2-A69T molecules, a two minute bleaching step to bleach the remaining unconverted mEos3.2-A69T molecules was performed using 1 kW/cm2 488 nm laser light illumination to avoid false positives during the FtsZ-PAmCherry readout. After sptPALM imaging, the cells of the imaged FOVs were tested for their cell viability. For this, all FOVs were imaged under bright light for three hours with two minutes interval to quantify their cellular growth after the sptPALM experiment. 3.1.4. HeLa Dual-Color Imaging Keratin-Dendra2 or H2B-Dendra2 were imaged first, activated with 450 W/cm2 of the 730 nm laser and 100–2500 mW/cm2 of the 488 nm laser (pulsed every 20th frame) with the intensity gradually increased to keep the number of localizations per frame constant and read out with the 561 (800 W/cm2 ) laser for 20 thousand frames at an exposure of 60 ms per frame. The sample was then illuminated with 4 kW/cm2 of the 488 nm laser for 2 min, to bleach any residual Dendra2. Actin-PAmCherry was imaged second, activated with the 405 nm laser, pulsed on every 12th frame, with the intensity gradually adjusted from 250–6500 mW/cm2 and read out with constant 561 illumination at 800 W/cm2 for 10 to 20 thousand frames at an exposure time of 60 ms per frame. Lasers were angled to achieve near-TIRF illumination. For all mammalian images, the NeNA values were in the range of 15–20 nm, exact values of the exemplary images are given in the respective captions. 3.1.5. S. pombe Multi-Color Imaging Cbp1-Dendra2 was imaged first, activated with 450 W/cm2 of the 730 nm laser and 100–2500 mW/cm2 of the 488 nm laser (pulsed every 20th frame) with the intensity gradually increased to keep the number of localizations per frame constant and read out with the 561 (500 W/cm2 ) laser for 20 thousand frames at an exposure of 20 ms per frame. The sample was then illuminated with 2 kW/cm2 of the 488 nm laser for 1 min, to bleach any residual Dendra2. Cnp1-PAmCherry was imaged second, activated with the 405 laser, pulsed on every 12th frame, with the intensity gradually adjusted from 250–6500 mW/cm2 and read out with constant 561 illumination at 500 W/cm2 for 10 thousand frames at an exposure time of 20 ms per frame. Finally, cells were fixed with 1% paraformaldehyde (Sigma-Aldrich, F8775) without moving the sample and stained for DNA with 1 µg/mL DAPI, read out by the 405 nm laser (10 W/cm2 ).
Int. J. Mol. Sci. 2017, 18, 1524
9 of 13
3.1.6. Viability Controls S. pombe cbp1-Dendra2 cnp1-PAmCherry cells were grown in YES medium at 25 ◦ C overnight, then inoculated into fresh YES to a starting OD600 of 0.1 and grown for ~6 h before imaging. 1 mL of culture was spun down at 500× g for 5 min and resuspended in 10 µL fresh YES medium. Cells were immobilized on a 1% low-gelling temperature agarose pad (Sigma-Aldrich, A9414) in YES medium and covered with a coverslip previously cleaned with Hellmanex. Cells were imaged on a custom-built heating stage at 30 ◦ C. To compare growth, 8 FOVs at least 1000 µm apart were chosen and bright field images were taken at time t0 . The first two FOVs were imaged with PC activation 450 W/cm2 of the 730 nm laser and 100–2500 mW/cm2 of the 488 nm laser (pulsed every 20th frame) with the intensity gradually increased to keep the number of localizations per frame constant and read out with the 561 (500 W/cm2 ) laser for 20 thousand frames at an exposure of 15 ms per frame. The next two FOVs were imaged with the same conditions but also post-bleached with 2 kW/cm2 of the 488 nm laser for 2 min. Two further FOVs were then imaged and post-bleached as described above, then also imaged with UV activation, 405 laser pulsed on every 12th frame, with the intensity gradually adjusted from 250–6500 mW/cm2 and read out with constant 561 illumination at 500 W/cm2 for 5 thousand frames at an exposure time of 30 ms per frame. A bright field of each position was taken every 10 min for 12 h after imaging with an automated µManager script, though FOVs were lost after ~4 h due to drift. Exemplary cells are depicted in Figure S3. 3.2. Data Analysis 3.2.1. Analysis of the Influence of High Intensity 488 nm Images Acquired three-frame snapshots were analyzed with a custom written script in Fiji software (ImageJ 1.51f ) [33]. Cell FOVs were extracted by identifying individual bacterial shapes from fluorescence averages excluding overlapping or out-of-focus cells. Averaged fluorescence intensity for each cell was used as a parameter of bleaching degree (Figure S1b). 3.2.2. Super-Resolution Image Reconstruction of Bacterial and Mammalian Multi-Color Images Localizations of the fitted single fluorescent spots were obtained by the open source software rapidSTORM (version 3.3) [34]. Fitting parameters were determined individually for each kind of fluorophore (Dendra2, mEos3.2-A69T, PAmCherry and Nile Red). In the next step, localization precision for all FOVs was estimated using NeNA [31] as implemented in the open-source software LAMA (version 16.10) [35] on a section of the image that contained no fiducial markers. For all FOVs localization precision was determined between 10 and 15 nm for bacteria and 15 and 20 nm for mammalian cells. Localization data were filtered to connect neighboring localizations in adjacent frames, to avoid several-fold counting of molecules with fluorescence lifetimes exceeding the framerate of the movie. In the last post-processing step, all localization files were drift corrected with custom written Python algorithms that extract and correct for fluorescent bead trajectories. Additionally, for FtsZ-PAmCherry localizations, density based clustering analysis was performed with the density-based spatial clustering of applications with noise (DBSCAN) algorithm [36], as single cytosolic FtsZ-PAmCherry proteins were abundantly present in cell. Only clustered molecules (DBSCAN parameters: ε = 35 nm; MinPts = 10) were used for image reconstruction of FtsZ-PAmCherry. Super-resolution image reconstructions and DNA-Sytox Orange image were stacked and superimposed in Fiji software. For HeLa cells, images were reconstructed with a pixel size of 20 nm. 3.2.3. Single Particle Tracking in E. coli and S. pombe Single molecule localizations were extracted from the movies with the open-source software rapidSTORM. Final images were reconstructed with a pixel size of 10 nm. Single particles were tracked with the help of customized tracking software written in C++ and visualized by customized software written in C++, to filter and group single molecule localizations or trajectories by their apparent
Int. J. Mol. Sci. 2017, 18, 1524
10 of 13
diffusion coefficient (as calculated by MSD analysis). For MSD analysis, only trajectories with 4 and more steps were used for calculating the MSD values. Independent of the total length of each trajectory, only the first steps of each trajectory were used for the MSD calculation (for the first 3 ∆t values) to account for heterogeneous diffusion behavior over time as well as the confinement of the yeast nucleus/E. coli cell. To account for the localization precision σ of the data, the constant offset of 4*σ2 was included into the fit-function. For diffusion coefficient statistics, only MSD fits with an R2 value of 0.85 or higher were used. 4. Summary and Conclusions In summary, our new technique produced high quality PALM images on all tested samples. The controls showed there is little to no crosstalk between the two proteins and loss of PAmCherry is minimal. This can be further reduced by avoiding the post-bleaching step with high intensity of 488 nm light, by reading out the entire signal in the first phase of imaging and, for fixed cells, by increasing the pH to 8–8.5 where PC is most efficient [14]—making both phases of imaging fully quantitative. We have also shown that the approach is easily combined with other sequential imaging techniques, such as membrane PAINT. This correlative approach could be extended further, by e.g., substituting the Sytox Orange DNA stain for the transiently binding Hoechst-JF646 probe for DNA-PAINT [37]. Perhaps most importantly, the combination of a PC-suitable pcFP and an only UV-activatable paFP allows for dual-color SMLM imaging in living specimens, without the need for any additional staining steps, as shown in E. coli and S. pombe. Previously, this could only be done through the use of proteins with different emission spectra, such as paGFP or psCFP2. This requires imaging in different readout channels, introducing chromatic aberration, which makes overlaying the channels more difficult. Additionally, many biological samples, e.g., including S. pombe, can exhibit high degrees of autofluorescence in the GFP channel. Combined with the lower brightness of paGFP and psCFP2 compared to red paFPs, this results in a limited achievable resolution. Also, the superior brightness of FPs such as Dendra2, mEos3.2-A69T and PAmCherry allows for single particle tracking experiments, where brightness is essential due to shorter exposure times and lower excitation light intensities. That being said, our approach could potentially be combined with other FPs that emit in different channels, further expanding the palette of available colors for live-cell imaging or be used in tandem with enzyme tags such as Halo-tag [38] and SNAP-tag [39] together with membrane-permeable dyes (and e.g., as well using sequential orange stainings like TMR and paJF549). In conclusion, our measurements demonstrate that this new method can be applied to various targets in different organisms and can be advantageously combined with existing imaging schemes. As it is an aberration-free, live-cell compatible method, which is simple to implement on conventional SMLM systems (even when using a red instead of an infrared laser source, PC can be efficient enough for SMLM imaging [13,14]), we believe it is a valuable addition to the current SMLM toolbox. Supplementary Materials: Supplementary materials can be found at www.mdpi.com/1422-0067/18/7/1524/s1. Acknowledgments: We thank Matthias Plessner, Institute of Pharmacology, Marburg, for the transient transfections of the Hela cells and Ilijana Vojnovic, MPI Marburg for her help with the cell culture during the revision of the manuscript. We further thank Jie Xiao, John Hopkins, Baltimore, USA, for kindly sharing their FtsZ-PAmCherry-plasmid pJB063. This work was funded by the Max Planck Society, SYNMIKRO and the Fonds der Chemischen Industrie. Author Contributions: Ulrike Endesfelder and David Virant conceived the idea; Ulrike Endesfelder, David Virant, Alexander Balinovic and Bartosz Turkowyd designed the experiments; David Virant, Alexander Balinovic and Bartosz Turkowyd performed the experiments and analyzed the data; Ulrike Endesfelder and David Virant wrote the paper with the help of all authors. Conflicts of Interest: The authors declare no conflict of interest.
Int. J. Mol. Sci. 2017, 18, 1524
11 of 13
Abbreviations FP paFP PAINT PALM PC pcFP SMLM
Fluorescent protein Photoactivatable fluorescent protein Points accumulation for imaging in nanoscale topography Photoactivated localization microscopy Primed conversion Photoconvertible fluorescent protein Single molecule localization microscopy
References 1. 2. 3. 4. 5. 6.
7.
8. 9.
10.
11.
12. 13.
14.
15. 16.
Turkowyd, B.; Virant, D.; Endesfelder, U. From single molecules to life: Microscopy at the nanoscale. Anal. Bioanal. Chem. 2016, 408, 6885–6911. [CrossRef] [PubMed] Nicovich, P.R.; Owen, D.M.; Gaus, K. Turning single-molecule localization microscopy into a quantitative bioanalytical tool. Nat. Protoc. 2017, 12, 453–460. [CrossRef] [PubMed] Sauer, M.; Heilemann, M. Single-molecule localization microscopy in eukaryotes. Chem. Rev. 2017, 117, 7478–7509. [CrossRef] [PubMed] Nienhaus, K.; Nienhaus, G.U. Fluorescent proteins for live-cell imaging with super-resolution. Chem. Soc. Rev. 2014, 43, 1088–1106. [CrossRef] [PubMed] Shcherbakova, D.M.; Sengupta, P.; Lippincott-Schwartz, J.; Verkhusha, V.V. Photocontrollable fluorescent proteins for superresolution imaging. Annu. Rev. Biophys. 2014, 43, 303–329. [CrossRef] [PubMed] Grimm, J.B.; English, B.P.; Choi, H.; Muthusamy, A.K.; Mehl, B.P.; Dong, P.; Brown, T.A.; Lippincott-Schwartz, J.; Liu, Z.; Lionnet, T.; et al. Bright photoactivatable fluorophores for single-molecule imaging. Nat. Methods 2016, 13, 985–988. [CrossRef] [PubMed] Gunewardene, M.S.; Subach, F.V.; Gould, T.J.; Penoncello, G.P.; Gudheti, M.V.; Verkhusha, V.V.; Hess, S.T. Superresolution imaging of multiple fluorescent proteins with highly overlapping emission spectra in living cells. Biophys. J. 2011, 101, 1522–1528. [CrossRef] [PubMed] Gahlmann, A.; Moerner, W.E. Exploring bacterial cell biology with single-molecule tracking and super-resolution imaging. Nat. Rev. Microbiol. 2014, 12, 9–22. [CrossRef] [PubMed] Wilmes, S.; Staufenbiel, M.; Lisse, D.; Richter, C.P.; Beutel, O.; Busch, K.B.; Hess, S.T.; Piehler, J. Triple-color super-resolution imaging of live cells: Resolving submicroscopic receptor organization in the plasma membrane. Angew. Chem. 2012, 51, 4868–4871. [CrossRef] [PubMed] Shroff, H.; Galbraith, C.G.; Galbraith, J.A.; White, H.; Gillette, J.; Olenych, S.; Davidson, M.W.; Betzig, E. Dual-color superresolution imaging of genetically expressed probes within individual adhesion complexes. Proc. Natl. Acad. Sci. USA 2007, 104, 20308–20313. [CrossRef] [PubMed] Nahmani, M.; Lanahan, C.; DeRosier, D.; Turrigiano, G.G. High-numerical-aperture cryogenic light microscopy for increased precision of superresolution reconstructions. Proc. Natl. Acad. Sci. USA. 2017, 114, 3832–3836. [CrossRef] [PubMed] Dempsey, W.P.; Georgieva, L.; Helbling, P.M.; Sonay, A.Y.; Truong, T.V.; Haffner, M.; Pantazis, P. In vivo single-cell labeling by confined primed conversion. Nat. Methods 2015, 12, 645–648. [CrossRef] [PubMed] Klementieva, N.V.; Lukyanov, K.A.; Markina, N.M.; Lukyanov, S.A.; Zagaynova, E.V.; Mishin, A.S. Green-to-red primed conversion of dendra2 using blue and red lasers. Chem. Commun. 2016, 52, 13144–13146. [CrossRef] [PubMed] Turkowyd, B.; Balinovic, A.; Virant, D.; Golz Carnero, H.G.; Caldana, F.; Endesfelder, M.; Bourgeois, D.; Endesfelder, U. A general mechanism of photoconversion of green-to-red fluorescent proteins based on blue and infrared light reduces phototoxicity in live-cell single-molecule imaging. Angew. Chem. 2017. [CrossRef] Mohr, M.A.; Argast, P.; Pantazis, P. Labeling cellular structures in vivo using confined primed conversion of photoconvertible fluorescent proteins. Nat. Protoc. 2016, 11, 2419–2431. [CrossRef] [PubMed] Subach, F.V.; Patterson, G.H.; Manley, S.; Gillette, J.M.; Lippincott-Schwartz, J.; Verkhusha, V.V. Photoactivatable mcherry for high-resolution two-color fluorescence microscopy. Nat. Methods 2009, 6, 153–159. [CrossRef] [PubMed]
Int. J. Mol. Sci. 2017, 18, 1524
17.
18. 19. 20.
21. 22.
23.
24. 25. 26. 27.
28.
29.
30. 31.
32.
33.
34.
35. 36.
12 of 13
Wang, S.; Moffitt, J.R.; Dempsey, G.T.; Xie, X.S.; Zhuang, X. Characterization and development of photoactivatable fluorescent proteins for single-molecule–based superresolution imaging. Proc. Natl. Acad. Sci. USA 2014, 111, 8452–8457. [CrossRef] [PubMed] Wäldchen, S.; Lehmann, J.; Klein, T.; van de Linde, S.; Sauer, M. Light-induced cell damage in live-cell super-resolution microscopy. Sci. Rep. 2015, 5, 15348. [CrossRef] [PubMed] Patterson, G.H.; Lippincott-Schwartz, J. A photoactivatable gfp for selective photolabeling of proteins and cells. Science 2002, 297, 1873–1877. [CrossRef] [PubMed] Subach, F.V.; Patterson, G.H.; Renz, M.; Lippincott-Schwartz, J.; Verkhusha, V.V. Bright monomeric photoactivatable red fluorescent protein for two-color super-resolution sptpalm of live cells. J. Am. Chem. Soc. 2010, 132, 6481–6491. [CrossRef] [PubMed] Endesfelder, U.; Finan, K.; Holden, S.J.; Cook, P.R.; Kapanidis, A.N.; Heilemann, M. Multiscale spatial organization of rna polymerase in escherichia coli. Biophys. J. 2013, 105, 172–181. [CrossRef] [PubMed] Stracy, M.; Lesterlin, C.; Garza de Leon, F.; Uphoff, S.; Zawadzki, P.; Kapanidis, A.N. Live-cell superresolution microscopy reveals the organization of rna polymerase in the bacterial nucleoid. Proc. Natl. Acad. Sci. USA 2015, 112, E4390–E4399. [CrossRef] [PubMed] Spahn, C.; Cella-Zannacchi, F.; Endesfelder, U.; Heilemann, M. Correlative super-resolution imaging of rna polymerase distribution and dynamics, bacterial membrane and chromosomal structure inescherichia coli. Methods Appl. Fluoresc. 2015, 3, 014005. [CrossRef] Sharonov, A.; Hochstrasser, R.M. Wide-field subdiffraction imaging by accumulated binding of diffusing probes. Proc. Natl. Acad. Sci. USA 2006, 103, 18911–18916. [CrossRef] [PubMed] Jung, S.R.; Fujimoto, B.S.; Chiu, D.T. Quantitative microscopy based on single-molecule fluorescence. Curr. Opin. Chem. Biol. 2017, 39, 64–73. [CrossRef] [PubMed] Niu, L.; Yu, J. Investigating intracellular dynamics of ftsz cytoskeleton with photoactivation single-molecule tracking. Biophys. J. 2008, 95, 2009–2016. [CrossRef] [PubMed] Laplante, C.; Huang, F.; Tebbs, I.R.; Bewersdorf, J.; Pollard, T.D. Molecular organization of cytokinesis nodes and contractile rings by super-resolution fluorescence microscopy of live fission yeast. Proc. Natl. Acad. Sci. USA 2016, 113, E5876–E5885. [CrossRef] [PubMed] Daigaku, Y.; Etheridge, T.J.; Nakazawa, Y.; Nakayama, M.; Watson, A.T.; Miyabe, I.; Ogi, T.; Osborne, M.A.; Carr, A.M. Pcna ubiquitylation ensures timely completion of unperturbed DNA replication in fission yeast. PLoS Genet. 2017, 13, e1006789. [CrossRef] [PubMed] Zaratiegui, M.; Vaughn, M.W.; Irvine, D.V.; Goto, D.; Watt, S.; Bahler, J.; Arcangioli, B.; Martienssen, R.A. Cenp-b preserves genome integrity at replication forks paused by retrotransposon ltr. Nature 2011, 469, 112–115. [CrossRef] [PubMed] Mizuguchi, T.; Barrowman, J.; Grewal, S.I. Chromosome domain architecture and dynamic organization of the fission yeast genome. FEBS Lett. 2015, 589, 2975–2986. [CrossRef] [PubMed] Endesfelder, U.; Malkusch, S.; Fricke, F.; Heilemann, M. A simple method to estimate the average localization precision of a single-molecule localization microscopy experiment. Histochem. Cell Biol. 2014, 141, 629–638. [CrossRef] [PubMed] Etheridge, T.J.; Boulineau, R.L.; Herbert, A.; Watson, A.T.; Daigaku, Y.; Tucker, J.; George, S.; Jonsson, P.; Palayret, M.; Lando, D.; et al. Quantification of DNA-associated proteins inside eukaryotic cells using single-molecule localization microscopy. Nucleic Acids Res. 2014, 42, e146. [CrossRef] [PubMed] Schindelin, J.; Arganda-Carreras, I.; Frise, E.; Kaynig, V.; Longair, M.; Pietzsch, T.; Preibisch, S.; Rueden, C.; Saalfeld, S.; Schmid, B.; et al. Fiji: An open-source platform for biological-image analysis. Nat. Methods 2012, 9, 676–682. [CrossRef] [PubMed] Wolter, S.; Loschberger, A.; Holm, T.; Aufmkolk, S.; Dabauvalle, M.C.; van de Linde, S.; Sauer, M. Rapidstorm: Accurate, fast open-source software for localization microscopy. Nat. Methods 2012, 9, 1040–1041. [CrossRef] [PubMed] Malkusch, S.; Heilemann, M. Extracting quantitative information from single-molecule super-resolution imaging data with lama—Localization microscopy analyzer. Sci. Rep. 2016, 6, 34486. [CrossRef] [PubMed] Ester, M.; Kriegel, H.P.; Sander, J.; Xu, X. A Density-Based Algorithm for Discovering Clusters in Large Spatial Databases with Noise; Kdd: Portland, OH, USA, 1996; pp. 226–231.
Int. J. Mol. Sci. 2017, 18, 1524
37.
38.
39.
13 of 13
Legant, W.R.; Shao, L.; Grimm, J.B.; Brown, T.A.; Milkie, D.E.; Avants, B.B.; Lavis, L.D.; Betzig, E. High-density three-dimensional localization microscopy across large volumes. Nat. Methods 2016, 13, 359–365. [CrossRef] [PubMed] Los, G.V.; Encell, L.P.; McDougall, M.G.; Hartzell, D.D.; Karassina, N.; Zimprich, C.; Wood, M.G.; Learish, R.; Ohana, R.F.; Urh, M.; et al. Halotag: A novel protein labeling technology for cell imaging and protein analysis. ACS Chem. Biol. 2008, 3, 373–382. [CrossRef] [PubMed] Sun, X.; Zhang, A.; Baker, B.; Sun, L.; Howard, A.; Buswell, J.; Maurel, D.; Masharina, A.; Johnsson, K.; Noren, C.J.; et al. Development of snap-tag fluorogenic probes for wash-free fluorescence imaging. Chembiochem 2011, 12, 2217–2226. [CrossRef] [PubMed] © 2017 by the authors. Licensee MDPI, Basel, Switzerland. This article is an open access article distributed under the terms and conditions of the Creative Commons Attribution (CC BY) license (http://creativecommons.org/licenses/by/4.0/).