BMC Bioinformatics
BioMed Central
Open Access
Research article
Combining specificity determining and conserved residues improves functional site prediction Olga V Kalinina*1,2, Mikhail S Gelfand†1 and Robert B Russell†2 Address: 1EMBL Heidelberg, Meyerhofstrasse 1, 69117 Heidelberg, Germany and 2Institute for Information Transmission Problems RAS, Bolshoi Karenty pereulok 19, Moscow, 127994, Russia Email: Olga V Kalinina* -
[email protected]; Mikhail S Gelfand -
[email protected]; Robert B Russell -
[email protected] * Corresponding author †Equal contributors
Published: 9 June 2009 BMC Bioinformatics 2009, 10:174
doi:10.1186/1471-2105-10-174
Received: 23 January 2009 Accepted: 9 June 2009
This article is available from: http://www.biomedcentral.com/1471-2105/10/174 © 2009 Kalinina et al; licensee BioMed Central Ltd. This is an Open Access article distributed under the terms of the Creative Commons Attribution License (http://creativecommons.org/licenses/by/2.0), which permits unrestricted use, distribution, and reproduction in any medium, provided the original work is properly cited.
Abstract Background: Predicting the location of functionally important sites from protein sequence and/ or structure is a long-standing problem in computational biology. Most current approaches make use of sequence conservation, assuming that amino acid residues conserved within a protein family are most likely to be functionally important. Most often these approaches do not consider many residues that act to define specific sub-functions within a family, or they make no distinction between residues important for function and those more relevant for maintaining structure (e.g. in the hydrophobic core). Many protein families bind and/or act on a variety of ligands, meaning that conserved residues often only bind a common ligand sub-structure or perform general catalytic activities. Results: Here we present a novel method for functional site prediction based on identification of conserved positions, as well as those responsible for determining ligand specificity. We define Specificity-Determining Positions (SDPs), as those occupied by conserved residues within subgroups of proteins in a family having a common specificity, but differ between groups, and are thus likely to account for specific recognition events. We benchmark the approach on enzyme families of known 3D structure with bound substrates, and find that in nearly all families residues predicted by SDPsite are in contact with the bound substrate, and that the addition of SDPs significantly improves functional site prediction accuracy. We apply SDPsite to various families of proteins containing known three-dimensional structures, but lacking clear functional annotations, and discusse several illustrative examples. Conclusion: The results suggest a better means to predict functional details for the thousands of protein structures determined prior to a clear understanding of molecular function.
Background Structural genomics, and the increased pace of structure determination by X-ray and NMR approaches makes methods to predict protein function from 3D structure of continuing importance. Proteins of known structure and unknown function are normally subjected to a battery of
comparisons to find proteins adopting similar folds (DALI [1], SSAP [2], CE [3] and others) or containing recurring active-site residue constellations (SPASM [4], PINTS [5], Catalytic Site Atlas [6]). Proteins of similar structure can provide functional hints, since it is very often the case that proteins share structural and functional simPage 1 of 24 (page number not for citation purposes)
BMC Bioinformatics 2009, 10:174
ilarities in the absence of sequence similarity. Active siteonly similarities (i.e. in the absence of overall fold similarity) are typically less revealing, but can sometimes suggest the presence of a convergently evolved catalytic machinery (e.g. the peptidase catalytic triad [7]) or binding sites for particular metals or ligands [8]. When comparative approaches fail to identify a clear similarity, or if such similarities are ambiguous – for instance, suggesting a possible weak functional similarity requiring confirmation – additional functional hints can come from analyses of the protein structure, similar structures, and what is typically a large collection of homologous sequences from the set of genomes now available. There are now several methods that exploit sequence conservation to identify putative functional sites in proteins, including ConSurf [9], approaches based on identification of 3D clusters of conserved residues [10], the evolutionary trace (ET) approach [11,12], correlated mutations [13], prediction of 3D motifs correlated with function [14], Jensen-Shannon entropy approach [15], algorithm based on contrasting global and local similarity matrices that interpret locality in terms of sequence [16] or structure [17]. The approaches differ in design, but share a unifying theme of using conserved amino acids, together with structural constraints such as location on the protein surface, as indicators of likely functional importance. Some of the presented techniques make a special emphasis on using a protein structure for prediction. A number of methods identify interaction hot spots on different kinds of interaction interfaces [18-20]. Other methods concentrate on predicting pockets in protein structures, as they are possible ligand-binding sites [21-23], sometimes supplementing them with annotation derived from other available sources [24]. In contrast to those, several approaches, including our own [25], have attempted to exploit protein sequence alignments to determine those residues likely to confer specificity for a particular sub-function in a protein family [25-41]. Although they differ in algorithmic details, all approaches aim to use the statistics of a multiple sequence alignment to identify positions that correlate well with sub-families that account for a certain specific function. Sub-families are either explicitly given in advance (for instance taken from gene or protein annotation) or are predicted by the algorithm. Here, we extend our previously derived approach for identifying specificity determining residues [25] to the problem of predicting protein functional sites (SDPsite). We combine routine predictions of conserved residues with those for specificity determinants, and use structural information to identify spatial clusters of the predicted
http://www.biomedcentral.com/1471-2105/10/174
important residues. SDPsite differs from structure-based methods in that the major part of the prediction is derived from the protein sequences. So, in theory, the method can also be applied in absence of structural information. The structure-based step filters out part of the predicted positions, thus leaving only the most reliable predictions, which can be useful in the design of experimental studies. To test our method on a large scale, we developed two benchmark datasets of diverse enzyme families, using the Enzyme Classification (EC) system. Enzymes are the simplest class of proteins to benchmark as their functional annotations are well specified in databases. However, they are not necessarily representative of other protein functions that are less discretely characterized by precise catalytic machinery (e.g. protein recognition modules, etc.). In the absence of a reliable source of functional annotations for non-enzymes, we previously tested the presented approach on two examples, for which reasonable experimental data are available, the LacI family of the bacterial transcription factors and subtilisin-like proteases [42]. On these examples, SDPsite results have a sensitivity between 0.06 and 0.17, specificity between 0.43 and 0.75 and false positive rate between 0.007 and 0.05. Thus, in these anecdotal cases, SDPsite seems to miss a lot of truly functional amino acids, but still provides reliable predictions. We also predicted the functional sites in 124 unannotated structures derived from Structural Genomics efforts. For the benchmark datasets, the success rate of our method (SDPsite) was 96–100%. We were then able to make confident functional site predictions for ~76% of a set of families lacking functional annotation.
Results 1. Testing SDPsite on a benchmark set of enzymes with bound cognate ligands We previously tested SDPsite on a number of protein families with known sites and compared the performance with several other approaches [42]. The results encouraged us to predict functionally important sites in poorly characterized protein families. Structural genomics projects now provide up to 20% of annual growth of the Protein data bank (PDB) and a greater coverage than ever before of the space of protein structures [43]. This has led to the current situation where hundreds of protein families include a protein with a known 3D structure, but no available functional information. These families are a perfect target for functional site prediction methods that use both sequence and structural information.
However, before applying our approach to families lacking functional information, we needed to benchmark the approach on a set of protein families that are well-characterised in terms of function. To do this we considered
Page 2 of 24 (page number not for citation purposes)
BMC Bioinformatics 2009, 10:174
enzyme protein families from the Pfam database, for which there is a functional characterization scheme in the Enzyme Classification (EC) number system. This classification consists of four numbers denoting a hierarchical system that delineates enzyme function. We focused on families containing EC numbers differing in the last number, which normally accounts for the substrate specificity. Since protein families generally correspond to a single functional or structural domain, complications can arise for multi-domain proteins that correspond to a single EC number. We inspected the families manually to ensure that the catalytic operation for each EC number did indeed correspond to the domain considered. Thus each considered protein domain corresponds to a single EC number, thus catalyzing only one reaction (or one class of reactions), and presumably have only one active site. To assess performance of SDPsite on these Pfam enzyme families, we generated two benchmark datasets. The first consisted of families containing proteins with at least two EC numbers differing in the last position; the second consisted of families containing only a single EC number. We refer to these datasets as diverse and homogeneous in the sections that follow. The rationale is that when one is predicting function and/or specificity, one does not known in advance whether or not there are multiple specificities in the family. These two datasets mimic both of these situations. For all families we computed both specificity determining positions (SDPs) and conserved positions (CPs), then mapped them onto a 3D structure of one of the proteins of the family and extracted a portion of the two sets that forms a compact spatial cluster, as described previously [42] and in the Methods section. We designed several distance measures to assess the quality of the predictions. These were: 1) the minimal distance from the residues of each of the predicted sets (SDPs, CPs, best cluster) to a bound ligand; 2) the average distance to the ligand; 3) the diameter of the set; and 4) the average distance between residues of the set. We performed a Mann-Whitney test to assess the statistical significance of the best derived cluster, i.e. we tested if the set of the amino acid residues in the best cluster is significantly closer to the ligand than all residues in the protein. These data are given in Additional file 1. We considered predictions to be successful if minimal distances were smaller than 5 Å and average distances smaller than 10 Å. We selected these thresholds based on inspection of known binding sites, and found that they capture characteristics of typical binding sites, which are normally 15–20 Å in diameter and typically some of the amino acids of the cluster contact the ligand directly. A small minimal distance and a large average distance means that
http://www.biomedcentral.com/1471-2105/10/174
the cluster is too sparse and does not define the active site well enough, but still a part of it is close to ligand and might be functional. Generally there is no correlation between either diameter or average distance within a predicted set of residues and the set's proximity to the active site. As might be expected, predicted SDPs tend to be more sparsely distributed in the structure, compared to the more compact distribution of CPs. The best clusters are tightest, which is natural from their construction procedure, though the minimal distance suggests they are sometimes further away from the active site (even if the average distance is similar to CPs). We discuss these observations in more detail below. a. The diverse dataset: protein families with at least two distinct EC numbers Application of all the filters described in the Methods section yielded 26 Pfam families (Table 1). SDPsite was applied in different ways, either ignoring SDPs thus mimicking the standard, conservation-based approaches, or including them when constructing the best cluster. For the inclusion of SDPs, we either gave them twice the weight as the CPs (λ = 0.5, λ being the relative weight of a CP to an SDP) or same weight (λ = 1). (Fig. 1). For details on the choice of the λ parameter, see Methods. In all but one of the considered families (Carboxylesterase, see below) at least one predictor performs well, and in the Asparaginase_2 family the average distance is slightly higher than 10 Å. This means that the best clusters are located in enzyme catalytic sites, and some of residues are in direct contact with the ligand. This result is significant (p < 0.01) for all but four, one of which is the Carboxylesterase family; for the other three the best cluster contains positions accounting for intersubunit contacts. The resulting implications for quaternary structure are discussed below.
Average values for all the above measures are given in Tables 2 and 3. Note that SDPs contribute to identification of the active site, although leading to prediction of a more disperse cluster. When no SDPs are predicted (last column), the average distance is smaller, because CPs form a more compact cluster in the active pocket. Unlike other methods that attempt to predict functional sites solely using the conservation of surface residues, SDPsite predicts a number of additional positions of potential importance. In 11 out of 26 families the best cluster is significantly (p-value < 0.01 in a Mann-Whitney test) closer to the ligand in both λ = 0.5 and λ = 1 scenarios, and in 20 out of 26 in at least one of them, whereas the CPs-only based prediction succeeded in only 15 families (Table 4). This indicates that the inclusion of SDPs in the prediction often leads to a significant improvement.
Page 3 of 24 (page number not for citation purposes)
BMC Bioinformatics 2009, 10:174
http://www.biomedcentral.com/1471-2105/10/174
Table 1: Statistics of the benchmark datasets: diverse dataset, two or more EC numbers per family
Family ID Family name
# sequences Alignment length
ECs
PDB
Bound ligand equivalent to natural substrate/product
PF00108
Thiolase_N
22
291
2.3.1.9 2.3.1.16 2.3.1.176
1NL7
Coenzyme A
PF00128
Alpha-amylase
54
673
2.4.1.4 2.4.1.7 3.2.1.10 3.2.1.20 3.2.1.70 3.2.1.98 3.2.1.93 3.2.1.141 5.4.99.16 5.4.99.15
2D3N
Glucose
PF00135
COesterase
129
889
3.1.1.1 3.1.1.3 3.1.1.7 3.1.1.8 3.1.1.13 3.1.1.59
1P0M
Choline ion
PF00215
OMPdecase
92
402
4.1.1.23 4.1.1.85
2CZE
Uridine-5'-monophosphate
PF00278
Orn_DAP_Arg_deC
55
220
4.1.1.17 4.1.1.18 4.1.1.19 4.1.1.20
1TWI
Lysine
PF00293
NUDIX
205
314
2.7.7.1 3.6.1.13 3.6.1.17 3.6.1.52 3.6.1.52 5.3.3.2
2DSC
Adenosine-5-diphosphoribose
PF00348
Polyprenyl_synt
16
289
2.5.1.10 2.5.1.29
2F8Z
Zoledronic acid, 3-methylbut-3-enyl trihydrogen diphosphate
PF00351
Biopterin_H
6
332
1.14.16.1 1.14.16.2 1.14.16.4
1MMK
5,6,7,8-tetrahydrobiopterin, beta(2-thienyl)alanine
PF00579
tRNA-synt_1b
41
402
6.1.1.1 6.1.1.2
1WQ 4
Tyrosine
PF00583
Acetyltransf_1
244
150
2.3.1.1 2.3.1.4 2.3.1.48 2.3.1.57 2.3.1.59 2.3.1.82 2.3.1.87 2.3.1.88 2.3.1.128
1TIQ
Coenzyme A
Page 4 of 24 (page number not for citation purposes)
BMC Bioinformatics 2009, 10:174
http://www.biomedcentral.com/1471-2105/10/174
Table 1: Statistics of the benchmark datasets: diverse dataset, two or more EC numbers per family (Continued)
PF00590
TP_methylase
22
247
2.1.1.98 2.1.1.107 2.1.1.130 2.1.1.131 2.1.1.132 2.1.1.133 2.1.1.152 2.1.1.151 4.2.1.75 4.99.1.4
1S4D
S-adenosyl-L-homocysteine
PF00755
Carn_acyltransf
22
867
2.3.1.6 2.3.1.7 2.3.1.21 2.3.1.137
1NDI
Coenzyme A
PF00871
Acetate_kinase
12
405
2.7.2.1 2.7.2.7 2.7.2.15
1TUY
Adenosine-5'-diphosphate
PF00896
Mtap_PNP
13
288
2.4.2.1 2.4.2.28
1V48
9-(5,5-difluoro-5-phosphonopentyl)guanine
PF00962
A_deaminase
17
475
3.5.4.4 3.5.4.6
1NDZ
1-((1r)-1-(hydroxymethyl)-3-(6-((3-(1-methyl- 1hbenzimidazol-2-yl)propanoyl)amino)-1h- indol-1yl)propyl)-1h-imidazole-4-carboxamide
PF01048
PNP_UDP_1
16
276
2.4.2.1 2.4.2.3 2.4.2.28 3.2.2.4 3.2.2.9
1PK7
Adenosine
PF01112
Asparaginase_2
7
365
3.5.1.1 3.5.1.26
1SEO
Aspartic acid
PF01135
PCMT
9
232
2.1.1.77 2.1.1.36
1R18
S-adenosyl-L-homocysteine
PF01202
SKI
100
263
2.7.4.3 2.7.1.12 2.7.4.14 2.7.1.71 4.2.3.4
1WE2
Adenosine-5'-diphosphate
PF01234
NNMT_PNMT_TEMT
7
289
2.1.1.1 2.1.1.28 2.1.1.49
2AN4
S-adenosyl-L-homocysteine
PF01467
CTP_transf_2
66
302
2.7.7.1 2.7.7.3 2.7.7.14 2.7.7.15 2.7.7.18 2.7.7.39
1N1D
[Cytidine-5'-phosphate] glycerylphosphoric acid ester
PF01712
dNK
14
174
1.6.99.3 2.7.1.21 2.7.1.74 2.7.1.76 2.7.1.113 2.7.1.145
2A2Z
Uridine-5'-diphosphate, 2'-deoxycytidine
Page 5 of 24 (page number not for citation purposes)
BMC Bioinformatics 2009, 10:174
http://www.biomedcentral.com/1471-2105/10/174
Table 1: Statistics of the benchmark datasets: diverse dataset, two or more EC numbers per family (Continued)
PF02274
Amidinotransf
32
455
2.1.4.1 3.5.3.6 3.5.3.18
2A9G
Arginine
PF03061
4HBT
153
102
3.1.2.2 3.1.2.23
1LO7
2-oxyglutaric acid, 2-aminoethanesulfonic acid
PF03171
2OG-FeII_Oxy
147
183
1.14.11.2 1.14.11.4 1.14.11.7 1.14.11.9 1.14.11.1 1 1.14.11.1 3 1.14.11.1 9 1.14.11.2 0 1.14.11.2 3 1.14.11.2 6 1.14.17.4 1.14.20.1 1.21.3.1
2FDJ
4-hydroxyphenacyl coenzyme A
PF03414
Glyco_transf_6
6
341
2.4.1.87 2.4.1.40
1LZJ
Succinic acid
For instance, in the Protein-L-isoaspartate(D-aspartate) O-methyltransferase (PCMT, PF01135) and Thioesterase (4HBT, PF03061) families, the CP-based cluster is located distant from the active site, whereas addition of SDPs rescues the prediction leading to the correct site. In the C-terminal domain of Pyridoxal-dependent decarboxylases (Orn_DAP_Arg_deC, PF00278), bacterial transferase hexapeptide (Hexapep, PF00132) and Asparaginase (Asparaginase_2, PF01112) families, SDPs rescue the cluster for λ = 0.5. In contrast, for the Shikimate kinase family (SKI, PF01202) a heavier reliance on SDPs skews the prediction, whereas more equal considerations of SDPs and CPs, or of CPs only, perform considerably better. The Carboxylesterase (COesterase; PF00135) family is the only clear failure of the method, i.e. its active site is not identified by either variant of the method. Even the catalytic triad, Ser198, His438 and Glu197 (numbering from ChlE_Human), is not among either SDPs or CPs. The fact that the catalytic residues are not conserved in the alignment is puzzling. This could be because the alignment from Pfam contains many uncharacterized paralogs from C. elegans and D. melanogaster, which could perform a different function or be non-functional. Indeed, catalytic residues are often substituted in these proteins: Ser198 to alanine, asparagine, glycine or valine, His438 to asparagine, glutamic acid, leucine, lysine, tyrosine or valine, and Glu197 to asparagine, glutamic acid, glutamine, histidine, isoleucine, proline, threonine, tryptophane or tyrosine.
Such changes mean that these residues are ignored in the prediction procedure, and highlights the need for some caution when building alignments to predict function. We overlook details of quaternary structure when making predictions, and this can have interesting consequences, as discussed previously (e.g. ref. [25]). For instance, for the Thiolase N-terminal domain (Thiolase_N, PF00108) family, we found the minimal and the average distance to be rather large. From the structure of a protein from this family (biosynthetic thiolase from Z. ramigera, 1NL7), it is evident that the best cluster is located on the contact interface between two subunits of a dimer. Indeed, the minimal and the average distance to the second subunit are 2.73 Å and 6.90 Å, respectively. The second best cluster is, however, in the active pocket with the distances below the threshold. The family of Gcn5-related acetyltransferases (Acetyltransf_1, PF00583) is a similar case: for λ = 0.5 the best cluster is located on subunit contact interface and the second best in the active site, for λ = 1 vice versa. This highlights the need to consider quaternary structure explicitly when making and interpreting predictions using this or similar approaches. A natural question is how well the predicted grouping of the sequences agrees with the EC numbers of the proteins considered. For most families there was a good agreement, with EC numbers segregating into discrete branches of the trees derived from the alignments. There were two Page 6 of 24 (page number not for citation purposes)
BMC Bioinformatics 2009, 10:174
http://www.biomedcentral.com/1471-2105/10/174
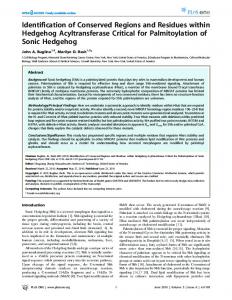
Figure 1 of the prediction quality for the diverse dataset Assessment Assessment of the prediction quality for the diverse dataset. In each plot, the green and the blue bars represent SDPsite predictions with λ = 0.5 and λ = 1, respectively. Yellow bars represent prediction based solely on conserved positions. (a) Minimal distance from the best cluster to the bound ligand. (b) Average distance from residues of the best cluster to the bound ligand. (c) Significance of the average distance.
Page 7 of 24 (page number not for citation purposes)
BMC Bioinformatics 2009, 10:174
http://www.biomedcentral.com/1471-2105/10/174
Table 2: Averages for the best cluster over all families from the Datasets, Å.
Diverse dataset
Homogeneous dataset
λ = 0.5
λ=1
No SDPs
λ = 0.5
λ=1
No SDPs
minimal distance
4.22
5.37
4.56
3.81
2.95
4.84
average distance
8.89
9.95
7.14
9.83
8.39
8.47
families where proteins with one EC number would split between two groups that contain proteins with other EC numbers (alpha-amylase, PF00128, and polyprenyl synthetase families, PF00348). For both, the same enzymatic activity seems to evolve independently on two separate branches of the phylogenetic tree. b. The homogeneous dataset: protein families with a single EC number The 18 families with a single EC number are listed in Table 5. Again, we applied SDPsite with λ = 0.5, λ = 1 and without prediction of SDPs (Fig. 2). For all studies families, except Eukaryotic phosphomannomutases (PMM, PF03332), at least one of these variants puts the best cluster to the active site of the enzyme according to the described criteria. For 9 out of 18, the best cluster identified by either procedure is located in the active site. These results are significant (p < 0.01) for all families, except Adenylylsulphate kinases (discussed below).
The remaining nine families, for which active sites were not identified by all variants of SDPsite, can be split into four categories: (1) λ = 0.5 fails (Thymidylate synthases, Thymidylat_synt, PF00303; thymidine kinases from Herpesviridae, Herpes_TK, PF00693); (2) both λ = 0.5 and λ = 1 fail (GTP cyclohydrolases II, GTP_cyclohydro2, PF00925; Phosphoenolpyruvate carboxykinases, PEPCK_ATP, PF01293; Adenylylsulphate kinases, APS_kinase, PF01583); (3) CP-only prediction fails (Queuine tRNA-ribosyltransferases, TGT, PF01702; Pyruvate formate lyases, PFL, PF02901); and (4) at least two of the three fail (oxygenase domain of Nitric oxide synthases, NO_synthase, PF02898; Eukaryotic phosphomannomutases, PMM, PF03332).
SDPs are expected to perform worse for this dataset, because in theory there are no specificity differences within each family as defined by the EC system. However, CP-based clusters significantly skew the predictions in two cases out of eighteen. One explanation of this observation could be inaccuracy or ambiguity in the assignment of the EC numbers, which would mean that we have identified some real differences the specificity. It might also be that a substitution to an amino acid with similar properties (e.g. size, polarity, charge) occurred, which can perform an equivalent enzymatic role. Another possibility is the functional convergence to a single specificity at the molecular level: SDPs indicate different residues that distant species or distant paralogs evolved to perform the same function (e.g. [44]). Alternatively, as discussed below, SDPs may indicate differences specific to certain phylogenetic clades. Similarly to the diverse dataset, there are two families for which the best cluster is located on the subunit contact interface: Thymidylate synthases and Adenylylsulphate kinases. The minimal and average distances to the second subunit of the dimer are 3.30 Å and 5.73 Å for Thymidylate synthases and 2.65 Å and 6.55 Å for Adenylylsulphate kinases. For both, the second best cluster is in the active site. For two families, all three versions of SDPsite produce poor results. For the oxygenase domain of Nitric oxide synthases the average distance of the residues from the best cluster to the ligand is between 10 and 15 Å for all three versions, and for Eukaryotic phosphomannomutases it even exceed 15 Å in two out of three versions. However, for both families, the second best cluster is located in the active site. In the case of the oxygenase
Table 3: Sensitivity and false positive rate over all families from the Datasets, Å.
Diverse dataset
Homogeneous dataset
Combined dataset
λ = 0.5
λ=1
No SDPs
λ = 0.5
λ=1
No SDPs
λ = 0.5
λ=1
No SDPs
Sensitivity
0.13
0.14
0.06
0.13
0.16
0.07
0.14
0.15
0.07
False positive rate
0.03
0.02
0.008
0.05
0.04
0.01
0.04
0.03
0.01
Page 8 of 24 (page number not for citation purposes)
BMC Bioinformatics 2009, 10:174
http://www.biomedcentral.com/1471-2105/10/174
Table 4: Assessment of SDPsite versions, diverse dataset.
Family
SDPsite (λ = 0.5 AND λ = 1)
SDPsite (λ = 0.5 OR λ = 1)
SDPsite (no SDPs)
PF00108 PF00128 PF00135 PF00215 PF00278 PF00293 PF00348 PF00351 PF00579 PF00583 PF00590 PF00755 PF00871 PF00896 PF00962 PF01048 PF01112 PF01135 PF01202 PF01234 PF01467 PF01712 PF02274 PF03061 PF03171 PF03414
+ + + + + + + + -* + + -* + -
+ + + + + + -* + + + + + + + + + + + + -* + +
+ + + + + + + + + + + + -* + + +
Accuracy
0.42 (11/26)
0.78 (20/26)
0.58 (15/26)
'+': successful prediction (average distance to ligand