Research and applications
Combining structured and unstructured data to identify a cohort of ICU patients who received dialysis Swapna Abhyankar, Dina Demner-Fushman, Fiona M Callaghan, Clement J McDonald ▸ Additional material is published online only. To view please visit the journal online (http://dx.doi.org/10.1136/ amiajnl-2013-001915). National Library of Medicine, National Institutes of Health, Lister Hill National Center for Biomedical Communications, Bethesda, Maryland, USA Correspondence to Dr Swapna Abhyankar, National Library of Medicine, Lister Hill National Center for Biomedical Communications, 8600 Rockville Pike, Building 38A/9N917, Bethesda, MD 20894, USA;
[email protected] Received 12 April 2013 Revised 30 October 2013 Accepted 13 December 2013 Published Online First 2 January 2014
ABSTRACT Objective To develop a generalizable method for identifying patient cohorts from electronic health record (EHR) data—in this case, patients having dialysis—that uses simple information retrieval (IR) tools. Methods We used the coded data and clinical notes from the 24 506 adult patients in the Multiparameter Intelligent Monitoring in Intensive Care database to identify patients who had dialysis. We used SQL queries to search the procedure, diagnosis, and coded nursing observations tables based on ICD-9 and local codes. We used a domain-specific search engine to find clinical notes containing terms related to dialysis. We manually validated the available records for a 10% random sample of patients who potentially had dialysis and a random sample of 200 patients who were not identified as having dialysis based on any of the sources. Results We identified 1844 patients that potentially had dialysis: 1481 from the three coded sources and 1624 from the clinical notes. Precision for identifying dialysis patients based on available data was estimated to be 78.4% (95% CI 71.9% to 84.2%) and recall was 100% (95% CI 86% to 100%). Conclusions Combining structured EHR data with information from clinical notes using simple queries increases the utility of both types of data for cohort identification. Patients identified by more than one source are more likely to meet the inclusion criteria; however, including patients found in any of the sources increases recall. This method is attractive because it is available to researchers with access to EHR data and off-the-shelf IR tools.
BACKGROUND AND SIGNIFICANCE
To cite: Abhyankar S, Demner-Fushman D, Callaghan FM, et al. J Am Med Inform Assoc 2014;21:801–807.
Electronic health record (EHR) data are a valuable source of information for retrospective clinical studies and comparative effectiveness research. EHR data have become increasingly available to researchers as more hospitals and practices have adopted these systems. One benefit of using these databases is that most contain many years of data that would be time- and cost-prohibitive for individual researchers to collect on their own. EHRs primarily contain two types of data: (1) structured, or coded data, such as laboratory results and diagnosis codes; and (2) unstructured data, such as freetext clinical notes. The structured data is useful in that generally, specific types of information are easier to identify and extract, but each individual data element taken on its own does not provide information about the overall clinical context. For example, patients are often assigned a diagnosis code for a suspected condition as justification for a
Abhyankar S, et al. J Am Med Inform Assoc 2014;21:801–807. doi:10.1136/amiajnl-2013-001915
particular laboratory or radiology test, but even if the test results show that the patient does not have that condition, the diagnosis code will remain in the patient’s record and might be misleading if viewed in isolation. In contrast, narrative notes have a wealth of information with details and nuances that do provide clinical context. However, these details are difficult to encode and their unstructured format requires special processing to access. Developing methods to identify patient cohorts using both structured and unstructured data is an active area of medical informatics research. Many researchers have studied the accuracy of structured administrative data such as International Classification of Diseases, 9th edition, Clinical Modification (referred to in this paper as ICD-9) billing codes for identifying specific patient populations.1–9 For example, Segal and Powe1 found that ICD-9 codes were useful for identifying inpatients with immune thrombocytopenic purpura (ITP); Eichler and Lamont2 reported that the code for secondary brain or spinal cord neoplasms, 198.3, had good recall (sensitivity), precision ( positive predictive value), and specificity for identifying patients with brain metastases. The precision and specificity increased when the code recurred on different days. Both ITP and brain metastasis are specific diagnoses with precise ICD-9 codes, which makes the codes a useful marker for identifying relevant patients. ICD-9 codes did not perform as well when used to identify patients with more complicated conditions due to issues such as underreporting or lack of granular codes. Kern et al3 attempted to identify patients with chronic kidney disease in a population of Veterans’ Administration patients with diabetes and found that the specificity of the codes was good but the recall was very low. Zhan and colleagues4 used ICD-9 codes to identify patients with catheter-acquired urinary tract infections (UTI). Their task was complicated in that the patient had to have a diagnosis code for UTI and a procedure code for catheterization. Zhan et al discovered that only 1.4% of patients who had catheters were assigned the procedure code, which made it difficult to distinguish between patients admitted with UTI and those with catheter-acquired infection. Floyd et al5 combined prescription and ICD-9 data to identify patients with statin-related rhabdomyolysis. ICD-9 does not have separate codes for rhabdomyolysis due to different causes, and out of 292 patients taking a statin drug who were assigned the rhabdomyolysis ICD-9, manual chart review 801
Research and applications confirmed only 22 cases of statin-related rhabdomyolysis (precision of 7.5%). van Walravena et al6 compared International Classification of Diseases, 10th edition, Clinical Modification billing codes to a model containing 29 predictors, all from administrative data, to identify patients with kidney disease and kidney failure. Patients with billing codes were likely to have the disease, but combining multiple administrative data elements in a multivariable model identified more patients with the disease compared to billing codes alone. We found only one study similar to ours in that the outcome of interest was an intervention rather than a diagnosis. Lamont and Lan7 used Medicare claims codes to correctly identify about 75% of patients on specific chemotherapy protocols, including both different combinations of chemotherapeutic agents and variations in treatment over time. Several groups have used natural language processing (NLP) techniques to identify patient cohorts.10–16 Friedman et al10 presented an NLP-based method that extracted data from clinical text and converted it to a structured format that could then be searched. For the 2011 and 2012 Text REtrieval Conference, approaches for cohort identification ranged from strictly information retrieval (IR) methods11 to NLP-oriented methods such as translating cohort inclusion and exclusion criteria into modified PICO (Population, Intervention, Comparison, Outcome) frames to search over the clinical documents.12 A handful of research groups, such as the Electronic Medical Records and Genomics (eMERGE) network and Partners Healthcare,13–16 have explored combining structured administrative and clinical data, such as laboratory results and medications, with NLP-derived data for cohort identification. Carroll and colleagues13 used structured data based on a published model for identifying patients with rheumatoid arthritis (RA) with NLP-derived data from clinical notes to identify patients with RA. They tested their algorithm with EHR data from three sites; it had high specificity across institutions and outperformed the comparison algorithm that used billing codes alone. The eMERGE network is combining EHR data with genetic testing results to study genotype–phenotype relationships.14–16 For example, Kho et al14 report using EHR data to identify five different disease phenotypes for use in genome-wide association studies (GWAS) across five institutions. The eMERGE network has shown that using advanced NLP methods significantly increases the number of cases identified by a particular algorithm14 15 and also improves the algorithm’s precision.15 Our goal was to compare the accuracy of the coded data, the data obtained by querying the clinical notes, and the combination of the two for identifying a specific patient population. We used dialysis as a case study because it is an important variable that we needed for several clinical studies, such as the effect of obesity on outcomes after critical care,17 and information about dialysis was not available in a single source within our dataset.
extracted data from three structured MIMIC-II tables (discharge diagnoses, procedures, and coded nursing observations) and the unstructured clinical notes as follows.
Structured table data extraction The MIMIC-II discharge diagnoses table contains ICD-9 diagnosis codes, the procedures table contains ICD-9 procedure codes, and the coded nursing observations table has local MIMIC-II codes. We used a publicly-available ICD-9 database22 to find diagnosis and procedure codes related to dialysis from 2008 (the final year of data collection), and we found the variables related to dialysis in the coded nursing observations table by doing a case-insensitive search for the string ‘dial’ (the first four letters common to the words ‘dialysis’ and ‘dialysate’) in the variable name and then picking the relevant ones. Table 1 contains all of the variables we used, with an asterisk marking the ones that, during the course of the study, we determined unambiguously indicated that the dialysis procedure was performed (starred codes). We used structured query language (SQL) queries to find patients in each of the structured data tables based on the table-specific codes. We included patients that had at least one code in any of the three tables. Note that more ICD-9 diagnosis and procedure codes related to dialysis exist than the ones given in table 1, but only the ones assigned to patients in MIMIC-II are shown (see online supplementary appendix A for the full list of ICD-9 dialysis codes and code changes since 2008).
Table 1 Variables indicating that a patient had dialysis from three structured data tables in MIMIC-II: (1) discharge diagnosis; (2) procedures; and (3) coded nursing observations Procedure codes (ICD-9 procedure code/description)
Discharge diagnosis codes (ICD-9 diagnosis code/description)
METHODS We are using the Multiparameter Intelligent Monitoring in Intensive Care (MIMIC-II) database18 19 to answer clinical research questions related to intensive care. MIMIC-II contains data on over 30 000 patients hospitalized in an intensive care unit (ICU) at Beth Israel Deaconess Medical Center from 2001 to 2008. The Massachusetts Institute of Technology (MIT) Laboratory for Computational Physiology maintains the database and de-identifies the data20 per Health Insurance Portability and Accountability Act Privacy Rules.21 In this study, we included all 24 506 adult patients in MIMIC-II v2.6. We 802
Coded nursing observations (MIMIC-II code/description)
38.95 Venous catheterization for renal dialysis 39.27 Arteriovenostomy for renal dialysis 39.42 Revision of arteriovenous shunt for renal dialysis 39.43 Removal of arteriovenous shunt for renal dialysis 39.95 Hemodialysis* 54.98 Peritoneal dialysis* 585.6 End stage renal disease (requiring chronic dialysis) 996.1 Mechanical complication of other vascular device, implant, and graft 996.56 Mechanical complication due to peritoneal dialysis catheter 996.68 Infection and inflammatory reaction due to peritoneal dialysis catheter 996.73 Other complications due to renal dialysis device, implant, and graft E879.1 Kidney dialysis as the cause of abnormal reaction of patient, or of later complication, without mention of misadventure at time of procedure V45.1 Postsurgical renal dialysis status* V56.0 Encounter for extracorporeal dialysis* V56.1 Fitting and adjustment of extracorporeal dialysis catheter 146 Dialysate flow mL/h* 147 Dialysate infusing* 148 Dialysis access site 149 Dialysis access type 150 Dialysis machine* 151 Dialysis site appear 152 Dialysis type*
*Unambiguous code (starred) indicating the actual dialysis procedure and not just related to dialysis in general.
Abhyankar S, et al. J Am Med Inform Assoc 2014;21:801–807. doi:10.1136/amiajnl-2013-001915
Research and applications Unstructured clinical note data extraction The notes in MIMIC-II include physician discharge summaries, nursing progress notes, and radiology reports. We extracted the notes from the database into XML format with the following elements: patient identification number, hospital identification number, ICU identification number, note date/time, note type, and text. The text element is a single element containing the entire body of the clinical note. We used the Essie corpus analysis and mining tool23 to search the notes. Essie is a domain specific search engine with built-in synonymy expansion based on the Unified Medical Language System (UMLS).24 Essie supports the National Library of Medicine’s ClinicalTrials.gov25 and we also use it for internal research efforts. Essie takes XML documents as input, and if the documents contain negation, family history, section indicators (such as past medical history), or other tags, the Essie search can be tailored based on those document sections. However, we wanted to test a method that was generalizable and did not require special document processing techniques, so we used the MIMIC-II documents with the basic elements described above and indexed the full text of the notes using Essie. Our first Essie search consisted of the word dialysis. Based on this simple search, we retrieved a large number of radiology reports that mentioned the presence of a dialysis catheter without any other clinical notes that suggested the patient had dialysis. Therefore, we excluded radiology reports from our subsequent queries. Essie allows users to review the sentences that contain the search terms as well as the patterns of use of the terms in the collection, such as frequency of the word(s) immediately preceding and following the search term and statistics on which specific terms and/or synonyms were identified. We used this information to iteratively refine our query: for example, the first query only returned sentences that contained dialysis and peritoneal dialysis but not hemodialysis, because as we discovered, hemodialysis is not a synonym for dialysis in the UMLS. Lastly, we reviewed a convenience sample of the notes from patients that were identified by structured dialysis codes but not by our query to find terms we had missed. Our final query parameters were as follows (see online supplementary appendix B for the formal Essie query syntax and explanation): (1) exclude radiology reports; (2) include documents with any of the terms: dialysis, hemodialysis, peritoneal dialysis, CVVH, CVVHD, HD today, tunneled HD, on PD, continue PD, cont PD, dwell time, dwell hour; and (3) exclude documents with any of the terms in group A near any of the terms in group B. A: dialysis, hemodialysis, CVVH, CVVHD. B: ?, not, no, never, decline, declined, avoid, refuse, possible, possibility, discuss, consider, hold.
Kidney transplant patients We were only interested in identifying patients who had dialysis during their ICU admission, not in the past. Patients who have had kidney transplants typically no longer need dialysis even though their discharge diagnoses and clinical notes continue to reflect their history of end-stage renal disease requiring dialysis. Our broad search identified them as potential dialysis patients primarily based on the code 585.6 End-stage renal disease (requiring dialysis) or a mention of dialysis history in the notes. Because we only wanted to identify current dialysis patients, we excluded the patients with kidney transplants from the discharge diagnosis and clinical note subsets. We identified transplant patients based on the ICD-9 discharge diagnosis code V42.0 Kidney replaced by transplant and ICD-9 procedure code 55.69 Other kidney transplantation (no patients had the code 55.61 Kidney autotransplantation). We did not exclude transplant
patients if they also had dialysis procedure codes or coded nursing observation, because these two sources should only reflect actual ICU events.
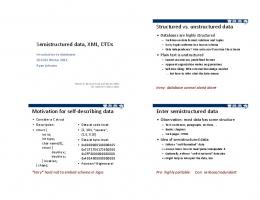
Manual review We manually reviewed random samples of both patients identified as potentially having dialysis and those not identified as having dialysis to estimate precision, recall, and specificity of our methods. One of the authors (SA) reviewed the data for a random 10% (185) of the patients identified by the codes and/or clinical notes to determine whether they truly had dialysis during the ICU admission or were false positives. Figure 1A illustrates the algorithm she used to make the determination. She took the starred codes at face value since they indicate actual events in the hospital or procedures that were submitted on the insurance claims. To estimate the number of patients who potentially had dialysis but were not identified by any of our methods (false negatives), two of the authors (SA and DD) reviewed the charts of 200 randomly selected patients (100 patients each) that were not identified as having dialysis in any source (see figure 1B). We estimated the 95% CI for precision based on the one-sample test of proportion, and we used Bayes’ theorem and bootstrap methods based on 100 000 draws26 to estimate recall, specificity, and the corresponding 95% CI using the statistical software package R (R Foundation for Statistical Computing, Vienna, Austria). Finally, SA informally evaluated the utility of the non-starred codes by manually reviewing the notes for the patients who were identified by code 996.1 as the only structured data element to determine whether or not they truly had dialysis (see figure 1C).
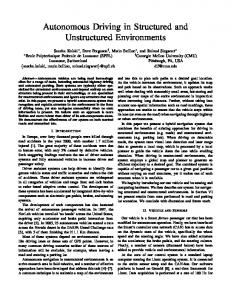
RESULTS We identified 1844 candidates for inclusion in the dialysis cohort according to either the full set of codes or the unstructured clinical notes that satisfied our search query. We identified 1481 patients (80.3% of 1844) from the three coded sources and 1624 (88.1% of 1844) from the notes; of these, 1261 patients (68.4% of 1844) were identified by both approaches (see figure 2). Out of the 1481 patients with any of the full set of dialysis codes, 1251 had procedure codes, 543 had diagnosis codes, and 580 had coded nursing observations with some overlap between sources (see figure 3). The largest population of potential dialysis patients (1251) in the coded data was found in the procedures table. Adding ICD-9 diagnosis codes yielded an additional 129 patients, and coded nursing observations added another 101. Table 2 gives a detailed breakdown of the patients found in each combination of coded sources and notes. Of the 185 randomly selected potential dialysis patients that we manually reviewed, 145 (78.4%) truly had dialysis and 40 (21.6%) were false positives (see figure 1A for details). Of the 200 randomly selected patients that were not in our potential dialysis cohort that we manually reviewed, none had dialysis during their hospital stay. Based on these two manually validated samples and the total number of MIMIC-II adult patients (24 506), the method had 100% recall (95% CI 86.0% to 100%) and 98.3% specificity (95% CI 97.8% to 98.7%). The precision was 78.4% (95% CI 71.9% to 84.2%), meaning we are 95% confident that the true number of patients who underwent dialysis was between 1326 and 1553. Of the 145 manually-reviewed patients with dialysis, 137 had two different coded sources or a clinical note plus at least one coded source indicating dialysis. Of those with coded data, all but 10 had one of the unambiguous codes. Most (28 out of 40) of the false positives were found by our Essie query and not in
Abhyankar S, et al. J Am Med Inform Assoc 2014;21:801–807. doi:10.1136/amiajnl-2013-001915
803
Research and applications
Figure 1 Algorithms used for manual validation. (A) illustrates the manual process for determining whether patients identified as having dialysis by searching the structured data tables and/or unstructured clinical notes truly had dialysis or not (true positive, false positive). (B) shows the process for determining which patients who potentially had dialysis were missed by our method. (C) represents the informal evaluation of patients with the non-starred code 996.1 to help determine the utility of the non-starred codes.
any of the structured sources. Several had dialysis catheters in place and/or a plan for dialysis but died before the procedure was performed, and many had discussions about dialysis documented in at least one note but ultimately did not receive dialysis. Additional false positives were patients with a family history of dialysis, notes stating that they were not eligible for dialysis, and two instances of documentation in the wrong patient’s chart (as clarified in subsequent notes). Eight of the 10 patients only identified by a non-starred code had codes from the diagnosis table, and the remaining two had one each from procedures and coded nursing observations. Finally, of the 63 patients identified by ICD-9 code 996.1 as the only structured data point, 21 had evidence of dialysis in the clinical notes.
DISCUSSION We found that for a procedure such as dialysis with a unique vocabulary, simple IR using the full-text clinical notes was a 804
good supplement to structured data sources. Our findings enrich the previously published research that identifying patients by combining data from the unstructured clinical notes and multiple sources of structured data is superior to using the notes alone, one or more structured sources, or the notes plus a single structured source. In our study, each individual structured source added at least 100 patients that were not found in either of the other two structured sources (see figure 3), and querying the unstructured clinical notes identified 363 patients that were not found in any of the structured data sources (see figure 2). Combining multiple sources had 100% recall and 98.3% specificity based on the samples we manually reviewed. At the beginning of the study we chose a list of structured data codes we thought were reliable indicators of dialysis, but during the manual review process, we found that only a subset of the codes (starred in table 1) were unambiguous indicators for the dialysis procedure actually taking place during the hospital stay (see figure 4 for counts of patients identified by the
Abhyankar S, et al. J Am Med Inform Assoc 2014;21:801–807. doi:10.1136/amiajnl-2013-001915
Research and applications Table 2 The number of patients and percentage of the total found in different unique combinations of sources Number of patients (%), N=1844 (100)
Figure 2 Comparison of potential dialysis patients identified in the three structured data tables and the unstructured clinical notes (total N=1844). The underlined numbers represent patients found in both the clinical notes and one or more structured sources.
starred subset of codes). In general, the procedure and nursing observation codes represented specific ICU dialysis events and diagnosis codes were less specific. For example, code 996.1 Mechanical complication of other vascular device, implant, and graft covers dialysis and non-dialysis devices. In addition, diagnosis codes might be assigned based on a patient’s past medical history or anticipated needs and not necessarily on current clinical status. Code 585.6 End-stage renal disease by definition applies to patients on dialysis but is not necessarily utilized based on the strict definition. However, not all procedure and nursing observation codes were precise indicators of dialysis during the hospital stay. Some patients had dialysis catheters placed for outpatient dialysis and did not have dialysis during the hospital stay, but were correctly assigned the catheter placement procedure code. Likewise, several patients had coded
Figure 3 Comparison of potential dialysis patients across the three structured data tables: procedure codes, discharge diagnosis codes, and coded nursing observations. The underlined numbers represent patients found in more than one coded source. The total number of patients found in all three structured sources together is 1481.
119 (6.5) 285 (15.5) 10 (