Abstract - This paper describes an Air Traffic Control (ATC) cognitive complexity indicator yielded from a human-in-the-loop simulation. The analysis used to this ...
Combining ATC Subjective Cognitive Complexity Evaluation Metrics in a Single Indicator Emilio. A. F. Albuquerque Filho1, Luis. G. Trabasso2, Rodrigo Scarpel2, R. John Hansman1 and Lishuai Li1 1
International Center for Air Transportation, MIT, Cambridge, USA 2
Instituto Tecnológico de Aeronáutica (ITA), Brazil
Abstract This paper describes an Air Traffic Control (ATC) cognitive complexity indicator yielded from a human-in-the-loop simulation. The analysis used to this end employs factor analysis for the identification of the correlation between cognitive complexity and several cognitive complexity and workload metrics. Thereby, a single complexity indicator has been developed. It has proved to be more responsive to the overall complexity than any of the other subjective metrics alone. Nonetheless, there is indication that the proposed complexity indicator must not be taken alone, but analyzed together with other metrics. The paper also tackles the impacts of traffic history, automation and optimized schedules on the perceived complexity and how these impacts should be taken into consideration on the design of future concepts of air traffic control operations. This is done through the application of the proposed indicator into several ATC scenarios. Keywords Cognitive Complexity, Air Traffic Control, Design of Experiment, Factor Analysis, Metrics
1
INTRODUCTION
Composed of Concept of Operations (Con Ops), the Next Generation Air Transportation System (NGATS) provides a vision that focuses on increasing the safety, security, and capacity of air transportation operations. For achieving that goal, NGATS proposes a combination of new procedures and technologies. As a consequence of these modifications, the controller’s workload, which is very likely to alter, must remain in safe limits. Given that one of the key factors that drive the controller’s workload is the cognitive complexity [3], it is necessary to understand the complexity’s behavior under current and future operations. The same assumption made by [5] is adopted: complexity is related to the cognitive difficulty of controlling the air traffic situation, which in turn is tied to the ability of controllers to maintain safe operations under normal and abnormal conditions. This research works with the Four-Dimensional Trajectory (4DT) control, which is the description of an aircraft path both in space and time. Some of the waypoints in a 4DT path may be associated with Control Time of Arrivals (CTA), which are time windows for the aircraft to cross specific waypoints within a prescribed conformance tolerance [6]. The use of 4DT relies on an enhanced precision and predictability in Air Traffic Control (ATC) operations, thereby minimizing the aircraft’s excess separation and increasing airspace capacity [6]. The lack of a clear definition of complexity in the literature is evident in the many measures used to evaluate it [3].. This variation makes it difficult to compare results across studies. Nonetheless, the following subjective evaluation tools are employed in this work. A short explanation of each of them and their derived metrics are presented below: 1.
Modified Cooper Harper Scale [2]: This tool was proposed by the scientists Cooper and Harper to quantify how a pilot’s workload affects the tasks’ performance and safety. Its scale ranges from 1 to 10. The participant goes through yes or no questions, which direct him (her) to the proper rating, reducing diversion. The modified measurement tool evaluates cognitive complexity in terms of the difficulty and the effort of maintaining desired levels of performance and safety. Participants are presented with the related concepts of performance, safety, workload and cognitive complexity and are trained to evaluate the traffic situation. The resulting metrics is referred to as CH.
2.
Modified Aircraft Count [4] [8]: This tool enables the participant to evaluate each aircraft’s individual complexity with respect to a standard aircraft. Then the participants assign a complexity score for each aircraft, which is how many times a certain aircraft is more, or less, complex than the standard aircraft, which has, by default, a complexity score equal to 1. The standard aircraft is presented beforehand and the participants are trained to make subjective evaluations. Two metrics are derived from the collected data, namely: (1) Effective Number of Aircraft (ENA): individual complexities are used as weighting factors in the aircraft count, and the results are normalized to a scale of 1 to 10; and (2) Percentage of Complex Aircraft (PCA): relative quantity of complex aircraft to the total aircraft.
3.
NASA WAK (Workload Assessment Keypad) [7]: Also used on NASA experiments, where keypads were installed at each test position as a means of recording workload ratings. Participants are instructed to evaluate the overall level of workload, based on the concepts already presented in a 7-point Likert scale.
It is known that the concept of complexity is multi-dimensional and cannot be captured by one single metric, because each metric is only good for capturing some aspects of complexity [14]. Nonetheless, it is desirable to have one single cognitive complexity indicator, as a function of subjective readings. This is convenient for depicting dependence models that may explain general complexity mechanisms. The objective of this work is to develop cognitive complexity metrics that might be used in future ATC operations (as anticipated by the NGATS Con Ops). The hypothesis is that a single indicator that combines features from different metrics is more representative of the overall cognitive complexity than any metric alone. Furthermore, this single indicator might bring insights of how the employed metrics are relevant to complexity measurement. A second objective is to apply the derived indicator to evaluate future NGATS Con-Ops impacts on cognitive complexity. In order to accomplish these objectives, within the experiment design, three main tools were developed: a part-task ATC simulator, subjective evaluation tools and a complexity measure indicator. 2
EXPERIMENT DESIGN
Built in MATLAB™, the ATC simulation includes arriving traffic and some crossover aircraft [1] [9]. The simulated environment was designed to mimic the key factors of two types of control: current or position based operations and time based operations (a simplified version of 4DT operations anticipated by the NGATS Con-Ops [6]). Three different types of schedule were used: no schedule (NS), First Come First Serve (FCFS) and an optimized scheduler named Constrained Position Shifting (CPS). CPS was developed by [8] and it is similar to the optimized schedules that might be used in 4DT [6]. In summary, the experiment’s independent variables are control type (two levels) and schedule type (three levels). The airspace structure is composed of four main streams converging to the right edge of the screen. The task of the participant is to deliver the normal arriving traffic to the next-to-last waypoint (the CTA) in conformance with the Scheduled Time of Arrival (STA, see Figure 1) and then to the last waypoint on the right edge of the screen. The crossover aircraft have to be safely delivered to the opposite side of the airspace that they came from. The participant has to manage the arriving aircraft as safely and quickly as possible. He/she has three primary goals, in decreasing order of importance: 1. Guarantee the airspace safety; 2. Avoid losing aircraft from the airspace; 3. Manage traffic efficiently.
Figure 1 Air Traffic Control Part Task Simulator Interface
2.1
Scenarios
In order to minimize the learning and memory effects of the participant during the whole experiment, it was decided to:
Invert the route structure in some scenarios; Split the traffic in traffic block and reorder them.
Each traffic block is defined by the entering rate of traffic (entering aircrafts per minute). Blocks A and C, which are presented to the participants at the beginning and at the end of the experiment, are least dense. Block B, which is presented at the middle of the experiment, is the densest. Table 1 presents the allocation of independent variables, structure orientation and traffic orders that define six different scenarios. Table 1 Allocation of Independent Variables and Scenarios [1] [9] Control Type Position Based Time Based (Direction and speed (Time, direction and commands) speed commands) Scenario 1 Scenario 4 Structure: Normal Structure: Normal Traffic: A-B-C Traffic: C-B-A Scenario 2 Scenario 5 Structure: Inverted Structure: Inverted Traffic: C-B-A Traffic: A-B-C Scenario 3 Scenario 6 Structure: Normal Structure: Normal Traffic: C-B-A Traffic: A-B-C
NONE Schedule Type
FCFS
CPS
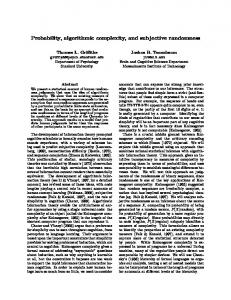
Surveys with the participants were carried out at the moments that the traffic load is most relevant. Figure 2 shows five sample times: (1) easy at the beginning; (2) medium and increasing difficulty; (3) hard; (4) medium and decreasing difficulty and (5) easy at the end. Traffic entering rate was designed so that the aircraft count in surveys 1 and 5 and 2 and 4 would be approximately the same, regardless of the blocks’ order (subjected to the participant's commands variability). The simulation was paused at each survey and the three evaluation tools were conducted, resulting in one observation. 20 Entering Rate Sample Times
19
3
Traffic Entering Rate (ac/hour)
18 17 16 15
2
4
14
1
13
5
12 11 10
0
10
20
30
40 50 Time (min)
60
70
80
90
Figure 2 Traffic and Sample Time configurations [1]
2.2
Method
It was decided to split the experiment participants in two types: (1) those who execute first the position-based scenarios; and (2) those who execute first the time-based scenarios. Given this rule, it was obtained 72 possible scenario orders or runs. Because of time restrictions, the total of 72 runs was further reduced to 12 [1]. As the behavior of cognitive complexity is barely known, each experiment run was repeated six times, totaling 72 participants joining the experiment. Out of the 90 participants (ITA undergraduate students), 20 of them had to be discarded, due to noticeable miscomprehension of the underlying concepts or lack of commitment to the experiment and / or to the subjective evaluation. 3
Results
The adopted approach for analyzing the collected data was to create a unified complexity measure indicator that was further analyzed with respect to its capability of capturing the impacts of several factors on complexity. Factor analysis was used for creating the single complexity indicator and analysis of variance was used for evaluating the effects of selected factors on complexity. The following sections present the analysis method and results.
3.1
Generating a Complexity Measure Indicator
Factor analysis is a branch of multivariate analysis that is based on the examination of correlation matrices of multiple variables [13]. Its purpose is to reduce these multiple variables to a lesser number of underlying factors, as a means of analyzing the internal structure of the covariance and correlation matrices concerned [13]. Variables that have correlation with each other can be grouped as being driven by one factor or construct. In this work the authors are concerned only with the cognitive complexity construct. In order to employ factor analysis, it was assumed that any sort of complexity reading is a linear function of the cognitive complexity level and the unique participant’s evaluation of the traffic situation. These functions can be seen as a set of regression equations, where the level of each metric is the dependent variable, the general cognitive complexity is the independent variable and the participant’s evaluation is the error term. These relationships are illustrated in Figure 3.
Figure 3 Relationship among cognitive complexity, complexity readings and participants’ evaluation
Table 2 presents the correlation among the variables, which is the input for factor analysis. Table 2 Correlation Matrix for the metrics readings PCA CH ENA WAK
PCA 1.00 0.37 0.27 0.41
CH 0.37 1.00 0.42 0.64
ENA 0.27 0.42 1.00 0.45
WAK 0.41 0.64 0.45 1.00
Table 3 presents the results of the maximum likelihood estimate computation [13] for the communalities, error or unique variances, loadings and shared variance. Table 3 Communalities, Error or Unique Variance, Loadings and Shared Variance Communalities PCA CH ENA WAK
0.24 0.59 0.30 0.70
Error or Unique Variance 0.76 0.41 0.70 0.30
Loadings 0.49 0.77 0.55 0.83
The explained variance of this model is 45.64%. The cognitive complexity indicator can be estimated with the loading matrix Λ and the correlation matrix Σ [12] with: (1)
The computation of equation (1) yields an estimator of the complexity measure (CM) for each observation: (2)
3.2
Analyzing Complexity Factors
Analysis of variance was conducted for evaluating the performance of the cognitive complexity indicator and further clarifying the cognitive complexity mechanisms. The variability of the participants’ evaluation of complexity is a known nuisance factor, which
is desired to be eliminated on the statistical comparisons among factors. Blocking is the design technique used for this purpose [11]. Based on the experiment design, control type and schedule type were included in the model. The results of this first analysis of variance are presented in Table 4. Table 4 Analysis of Variance for survey (SV) and scenario (SC) as factors and participant as block Source
Sum Sq.
d.f.
SV SC PARTICIPANT SV*SC Error Total
1385.08 152.08 1409.37 120.69 3067.75 6134.97
4 5 69 20 2001 2099
Mean Sq. 346.270 30.417 20.426 6.034 1.533
F
Prob>F
225.86 19.84 13.32 3.94
0.0000 0.0000 0.0000 0.0000
Table 4 suggests that both factors survey and scenario and their interaction are significant on complexity readings. Furthermore, the p-value for participants suggests that blocking was a correct technique to adopt. Using Tukey’s test [11], the cognitive complexity means of scenarios and surveys are compared. The results are summarized in Figures 4 and 5, respectively, with 95% confidence intervals. Because time-based controlling tools are used without any restriction for aircraft delivery (NONE schedule), significantly lower cognitive complexity evaluation was expected in scenario 4 and realized (see Figure 4). The change in complexity from FCFS to CPS schedule seems to have mild interaction effect with the control type being used: it is positive under position-based and negative under time-based operations. Moreover, the optimized schedule is less cognitively complex under time-based control than under position-based control (scenarios 3 and 4, respectively). Figure 5 shows that all complexity evaluations of each survey are significantly different from all the others, including those with the same aircraft count (statistical analysis confirmed that the aircraft count is similar for the survey pairs 1 and 5 and 2 and 4).
Figure 4 Estimated 95% Confidence interval for cognitive Complexity per scenario – Tukey’s Test
Figure 5 Estimated 95% Confidence interval for cognitive complexity per survey – Tukey’s test
Given the evidence of interaction between the chosen independent variables and general effects when each variable is accounted separately, it was decided to break each scenario down in its describing factors: control type and schedule type. Participants remain as blocks, and survey is kept in the model for assessing its interaction with the independent variables. Table 5 presents the results, where all chosen factors and their interactions of second order are significantly different. Once again, Tukey’s test is done for all factors and the results are presented in Figures 6 and 7, with their 95% confidence intervals. Table 5 Analysis of Variance for survey (SV), control type (CT) and schedule (SCH) as factors and participant as block Source
Sum Sq.
d. f.
SV CT SCH PARTICIPANT SV*CT SV*SCH CT*SCH Error Total
1385.08 93.25 12.04 1409.37 20.08 40.34 15.52 3159.29 6134.97
4 1 2 69 4 8 2 2009 2099
Mean Sq. 346.270 93.252 6.020 20.426 5.021 5.042 7.759 1.573
F
Prob>F
220.19 29.30 3.83 12.99 3.19 3.21 4.93
0.0000 0.0000 0.0219 0.0000 0.0126 0.0013 0.0073
As Figure 6 suggests, schedule results are close to each other and there is mild indication of difference between CPS and the other schedules. Although statistically different, there is mild evidence of practical difference in Figures 6 and 7.
Figure 6 Estimated 95% Confidence interval for cognitive complexity per schedule – Tukey’s test
Figure 7 Estimated 95% Confidence interval for cognitive complexity per control type – Tukey’s test
Table 5 points out that there is interaction between survey and the independent variables. Then, it was decided to make two further analyses with new variables created by combining survey and schedule type (SV–SCH) and then by combining survey and control type (SV-CT). Analysis of SV-SCH did not manifest any remarkable pattern resultant from interaction of factors. The results from the analysis of variance for the SV-CT factor and the Tukey’s test with the 95% confidence intervals are presented in Table 6 and Figure 8, respectively. Table 6 Analysis of Variance for combinations of survey and control type (SV - CT) as factors and participant as block Source
Sum Sq.
d. f.
SV – CT PARTICIPANT Error Total
1498.41 1409.37 3227.19 6134.97
9 69 2021 2099
Mean Sq. 166.49 20.426 1.597
F
Prob>F
104.26 12.79
0.0000 0.0000
Figure 8 Estimated 95% Confidence interval for cognitive complexity per combination of control type and survey– Tukey’s test
Figure 8 suggests that position-based operations tend to be more complex in all traffic situations, except for the traffic situation on the last survey. This exception for the last survey may be explained as a result of the participants’ effort to correct the timing errors of the remaining aircraft [1]. Furthermore, position-based operations tend to yield higher complexity values under higher traffic situations (survey 3). 4
CONCLUSIONS
It was found that WAK, although a simple metric (7-point Likert scale), was the most correlated to the cognitive complexity level. The second metric most correlated to cognitive complexity was CH, from the modified Cooper Harper scale, as the result of structured questions for assessment of cognitive effort for maintaining a desired level of performance and safety. Factor analysis identified that the metrics least correlated to the cognitive complexity level were those based on the identification of individual aircraft complexities. Nonetheless, the implementation of such metrics in [1] and [9] allowed the analysis of how some recognized complexity factors (such as proximity and structure) interfered in the individual aircraft complexities. It is a common accepted fact that a higher number of aircraft yields a higher complexity [3]. This work found that complexity also depends on traffic history outcomes (such as accumulated problems, frustration and tiredness) to which the controller is exposed. The evidence to this claim is presented in Figure 5, where traffic situations with similar aircraft count yielded different levels of complexity. This research also found that the implemented automations had an interactive influence on cognitive complexity. The introduction of an optimized schedule created the requirement for more sophisticated forms of coordination, in order for the controller to adapt to new demands and pressures. Consequently, an optimized schedule was most useful under the use of automation tools that allowed aircraft delivery with time control, as presented in Figure 4. Therefore, optimized algorithms, such as CPS, might complicate controller’s work if an additional automated tool is not provided for proper conformance with the imposed restriction. It was also verified that, for the same number of controlled aircraft, position-based control yields higher complexity measures than time-based control and this difference tends to be greater with increasing number of aircraft. Factor analysis aided the creation of a joint complexity indicator, which was useful for detection of general complexity mechanisms. Good explanation of complexity behavior could be captured even with low explained variance (45.64%) and experiment limitations. But the researcher must bear in mind that the complexity measure indicator cannot be taken alone; some aspects of complexity are better explained by each metric individually, accordingly to the complexity facet to be analyzed.
5
REFERENCES
[1] ALBUQUERQUE FILHO, E. A. F. Experimental Setup for Air Traffic Control Cognitive Complexity Analysis. Master’s Thesis, Instituto Tecnológico de Aeronáutica (ITA), Brazil, 2010, in print. [2] CUMMINGS, M.L., K. MEYERS, and S.D. SCOTT. Modified Cooper Harper Evaluation Tool for Unmanned Vehicle Displays. UVS Canada Conference, 2006. [3] HILBURN, B. Cognitive complexity in air traffic control - A literature review. EUROCONTROL EXPERIMENTAL CENTRE. EEC Note No. 04/04 April, 2004. [4] HISTON, J. M. Mitigating Complexity in Air Traffic Control: The Role of Structure-Based Abstractions. Ph.D thesis, Massachusetts Institute of Technology (MIT), 2008. [5] HISTON, J. M., HANSMAN, R. J., AIGOIN, G., DELAHAYE, D., and PUECHMOREL, S. Introducing Structural Considerations into Complexity Metrics. Air Traffic Control Quarterly , 10(2), 2002, Pg 115-130. [6] Joint Planning and Development Office. Concept of Operations for the Next Generation Air Transportation System. June 13, 2007. [7] KOPARDEKAR, P., Schwartz, A., MAGYARITS, S. and RHODES, J. Airspace Complexity Measurement: an Air Traffic Control Simulation Analysis. 7th USA Europe Air Traffic Management RD Seminar, 2007 [8] LEE, H. Tradeoff Evaluation of Scheduling Algorithms for Terminal-Area Air Traffic Control. Master’s thesis, Massachusetts Institute of Technology (MIT), 2008. [9] LI, L. Experimental Studies of Cognitively Based Air Traffic Control Complexity Metrics for Future Operational Concepts. Master’s thesis, Massachusetts Institute of Technology (MIT), 2009. [11]
MONTGOMERY, D. C. Design and Analysis of Experiments. 6th ed. John Wiley & Sons, Hoboken, New Jersey, 2005.
[12]
SHARMA, S. Applied Multivariate Techniques. John Wiley & Sons, New York,1996.
[13] LAWLEY, D. N., MAXWELL, A. E., Factor Analysis as a Statistical Method. Journal of the Royal Statistical Society. Series D (The Statistician), Vol. 12, No. 3, Factor Analysis (1962), pp. 209-229 [14] SEAMAN, J. M., KOENIG, F. A Comparison of Measures of Cognitive Complexity. Sociometry, Vol. 37, No. 3 (Sep., 1974), pp. 375-390