annotations that have 3D references to the virtual 3D city model and. (b) collection information ..... A collaboration server handling synchronous collaboration.
Combining Synchronous and Asynchronous Collaboration within 3D City Models Jan Klimke, J¨ urgen D¨ollner Hasso-Plattner-Institute, University of Potsdam, Prof.-Dr.-Helmert-Str. 2-3, Potsdam, Germany, {jan.klimke,juergen.doellner}@hpi.uni-potsdam.de
Abstract. This paper presents an approach for combining spatially distributed synchronous and asynchronous collaboration within 3D city models. Software applications use these models as additional communication medium to facilitate communication of georeferenced and geospatial information. Collaboration tools should support both the communication with other collaborators and their awareness of the current collaboration context. To support collaborative knowledge construction and gathering, we have designed a collaboration system to facilitate (a) creation of annotations that have 3D references to the virtual 3D city model and (b) collection information about the context in which these annotations are created. Our approach supports synchronous collaboration in connection with the creation of non volatile, precisely georeferenced units of information allow for a comprehensible form of cooperation in spatially distributed settings. Storage and retrieval of this information is provided through a Web Feature Service, which eases integration of collaboration data into existing applications. We further introduce a visualization technique that integrates annotations as complex structured data into the 3D visualization. This avoids media breaks and disruptions in working processes and creates a spatial coherence between annotation and annotated feature or geometry.
Keywords: Collaboration, Geospatial Annotation, 3D Geovirtual Environment, 3D Information Visualization
1
Introduction
Virtual 3D city models represent complex urban geographical and geospatial data. A number of systems provide functionality for presentation, exploration, analysis, and management of these models. Application domains such as urban planning, landscape architecture, city marketing, tourism information, and disaster management, typically involve a large number of stakeholders, specific requirements, and appropreate work flows. Users from different areas of expertise need to work collaboratively to master the complexity evolving from these issues. The need for communication between these experts is rising due to the increasing level of specialization and internationalization of parties, each working on specific aspects of a project. Since virtual 3D city models as 3D geovirtual
environments (3D GeoVEs) serve as integration spaces for multiple, heterogeneous, and distributed sources of geodata [1], they are designated to simplify communication of space-related information. In contrast to other environments for collaboration, e.g., maps or text-based systems, 3D GeoVEs are not only tools for communication, but also represent the collaboration subject space in 3D. This eases understanding of spatial situations for collaborators by reducing a user’s mental effort needed to create an insight of the geographic space visualized by 3D city model [2]. Hence, it is easier for a user to recognize a real-world spatial situation in 3D GeoVEs compared to 2D maps [3]. The contribution of this paper is a model for synchronous and asynchronous communication in 3D GeoVEs such as virtual 3D city models. We present communication tools that serve in combination with a standard-based persistence model for geospatial annotations as basis for collaboration concerning geospatial subjects. The two are combined to facilitate collaboration within 3D GeoVEs. Additionally we propose an approach for integrating complex structured, georeferenced information into 3D representation to avoid context switches. These would be required if such information is presented outside the 3D GeoVE. The remainder of this paper is organized as follows: Section 2 describes related work, while Section 3 explains communication means for collaboration in 3D GeoVEs. Section 4 subsequently introduces our concept for information storage, during a collaboration process, followed by Section 5 illustrating our approach for visualizing complex structured information within a 3D GeoVE. Section 6 describes a prototypical implementation of our collaboration model. In Section 7 the advantages and drawbacks of the approach are discussed. Finally, future research directions are outlined in Section 8.
2
Related Work
Collaboration in 3D virtual environments has been a topic for more than 20 years [4,5,6,7,8]. Applications for Computer Supported Collaborative Work are classified by their distribution of the collaboration process in space (local vs. distributed) and time (synchronous vs. asynchronous) [9,10]. Synchronous collaboration demands for interaction means as well as an awareness for participating collaborators and the context of a situation [7]. Additionally, asynchronous collaboration processes need to effectively model, describe, and store the information created in course of a collaboration. Several researchers have done work in the area of modeling geospatial annotations [11,12,13]. While many approaches use a single point location for georeferencing information, spatial references of information is often more complex. This demands for a more general model of an annotation’s spatial reference to store . The system introduced by Rinner et al. [14] provides such a model for collaboration using georeferenced arguments in discussions, but relies on a direct database access, which makes it hard to reuse the data efficiently. Furthermore, many approaches are limited to 2D reference geometries - nevertheless sufficient for their purpose since they are based on maps as collaboration tools [15,16,17]. Our collaboration approach targets 3D
GeoVEs. An extended Geographic Markup Language (GML) [18] based model for annotations together with separately modeled spatial references [19] is used for handling of annotations and their spatial references. The management of annotations in a virtual environment is a complex task [20], especially if they are embedded into the 3D environment. There are multiple 3D annotation techniques that use simple labels, like short texts or icons, to markup entities or geometries [21,22,23,24]. Said simple annotation contents are not fully sufficient for visualization of complex structured data, i.e., annotations equipped with metadata, which additionally provide interactive features for data exploration. Previous attempts dealing this problem integrate visualization approaches known from 2D user interfaces into 3D virtual environments [25]. Andujar et al. [26] employ Qt1 widgets rendered as textures to enable a fast and easy creation of virtual data representations. They these widgets to control the virtual environment and to explore complex data. Since the functionality of the Qt user-interface library has grown in recent years, the framework offers a wide range of possibilities for data display and interaction. Our system provides interactive visualization of Qt widgets embedded into the virtual environment, which enables structured display and exploration of data associated with a spatial subject. Jung et al. [27] performed a user study to evaluate an asynchronous collaborative virtual environment for architectural design. Besides textual annotations associated with points in 3D space, the users demanded a way to express change requests or ideas visually. Commonly Sketches have been described as an efficient tool to communicate ideas, opinions, and proposals. Several approaches already use sketches to convey visual or spatial information in 3D environments [28,29]. Heer et al. [30] analyzed the collaborative annotation of data visualizations. In their user study, they identified sketch drawing on those visualizations as an expressive means. Especially pointing in sketches was used frequently. Our system makes use of sketches as communication means. They can be drawn collaboratively during a synchronous collaboration and also be stored alongside with metadata for asynchronous collaboration. Large, interactive, and heavily distributed virtual environments, such as Second Life 2 or Twinity 3 support immediate interaction throughout large numbers of participants, embodied by avatars. Their gesticulation are used for pointing and expressing a variety of feelings. Verbal communication means are integrated into clients. Many concepts in Second Life, i.e., signs for information display, are real-world metaphors. By mapping geographical regions onto parts of the Second Life world it is also used for geocollaboration [31]. In contrast to these online virtual worlds we do not store the state of a virtual environment, but only data that is explicitly designated to be persistent.
1 2 3
http://qt.nokia.com http://www.secondlife.com http://www.twinity.com
Verbal Form Nonvisual Information
Chat
Nonvisual Information
Voice Visual/Spatial Information
Mark Up
Visual/Spatial Information
Sketch Drawing Visual/Spatial Form
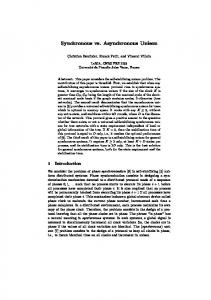
Fig. 1. Communication means for collaboration within 3D GeoVEs. Because conversions between visual information and non-visual form is lossy, visual information is communicated most efficiently using a visual form.
3
Communication Means for Collaboration within 3D City Models
Communication is the central part of a collaborative process. Therefore, communication means are needed that assure efficient transfer of information such as ideas, opinions, options, or proposals efficiently from one user to other collaborators. Due to the spatial nature of the collaboration subject in 3D GeoVEs, large parts of the communicated information is of visual, respectively spatial nature. Standard communication means such as text or audio chats are less suitable to convey such information. They imply a conversion of the form of information from a visual (spatial) form of information to a non-visual form like spoken or written text. In each conversion, information contained in spatial concepts may be lost [32]. Therefore, tools should support users to express the visual part of their ideas efficiently (Fig. 1). The most important ones are markups for 2D and 3D geometries (points, areas, and volumes), geographic features, or groups of those. They facilitate making precise geographic references and, therefore, avoid disambiguities in communication. Verbal communication on the other hand are used to convey non spatial, domain-specific information. We assume that usually external tools for telephony or chat are used for this kind of communication. In 3D virtual environments, a user’s current view is an important factor: information about visible features, current activities, or intents are at least partially encoded. Because of this, a collaborative environment should support both, independent and shared scene views [33]. To share a user’s view during synchronous collaboration sessions virtual cameras of all participants need to be synchronized. Further, the user that controls the virtual camera movement has to be determined. We implemented a broadcast-subscription mechanism to enable multiple distinct camera streams with different users subscribed to them in parallel. Through sharing the camera parameters only, users are still able to
adapt their model visualization style and integrate different kinds of domain specific data. We are thus using a relaxed variant of the ”What You See is What I See” (WYSIWIS) concept [34]. If collaboration is performed asynchronously, a user’s view of the scene should still be available to reproduce his spatial context. To communicate space-related proposals or ideas, e.g., variants of arrangements of geographic features, design options, or routes, they have to be described effectively to minimize loss of information. A 3D scene can be annotated by georeferenced 3D geometry or free-hand sketches to encode this visual information in a visual form (Fig. 1). Additional 3D geometry, e.g., in form of modeled variants of a building, can convey more details of a design or proposal then a hand-draw sketch. Said annotation geometry more difficult to create and adapt compared to sketch annotations, particularly if proposals should be communicated [27]. Moreover, sketch-based depictions are found useful for visualizing ideas that are in early stages of development or focussing certain aspects of a design or proposal [35]. ”Sketches stimulate viewers more than shaded images to discuss and actively participate in design development” [36]. So the sketchiness and unfinished look of drawings encourage people to critically scrutinize ideas expressed using a sketch. Their informal character and easy creation make them an essential part of our communication model for synchronous and asynchronous collaboration. Sketching is an effective form of annotation if the 3D GeoVE application is used with touch input devices such as a tablet PC, smart phone, or a tangible wall-mounted display, since those devices provide a more natural interface for drawing. Free hand sketches can be connected to objects or scene views. While objectbased sketches require 3D geometry as surface to draw onto, for view dependent sketches this surface is defined implicitly as the virtual camera’s projection plane. Thus, view dependent sketches are more suitable to roughly describe spatial issues, e.g., in early stages where no geometry is available. Further, view-based sketches can be created more easily since users do not need to handle the complexity of the third dimension for drawing. We therefore decided to use camera position dependent sketches drawn onto the scene depiction. Fig. 2 provides an example for such a sketch that describes a proposal for which no 3D geometry exists. To communicate the different parts of space-related problems in a way that minimizes loss of information, means to communicate spatial and non spatial information are combined.
4
Documentation of Collaboration Processes
Collaboration aims at solving apparent problems when information is shared between co-workers, i.e., knowledge of domain experts in form of opinions, ideas, or proposals. Geospatial annotations are collaboration artifacts that have to be stored to allow comprehension of the collaboration process. For spatial collaboration subjects, such as an urban planning project, information and its spatial references have to be connected in a way that they both can be evaluated and un-
Fig. 2. Example for a sketch illustrating a building extension and its road access.
derstood later on. An annotation’s spatial references are described, encoded, and stored precisely to avoid a loss of information. They associate annotations with geospatial features, 3D geometry, or view description in real world coordinates. Besides the spatial subject of an annotation, information about the context in which an annotation was created helps to comprehend a user’s statement later on. Thus, additional metainformation, such as camera parameters, author information, creation time as well as information about the current collaboration session is stored and linked to its respective annotation. Data created in course of collaborative work should be applicable throughout different specialized software systems that are used by domain experts, e.g., urban planners, architects, or security specialists. To ensure interoperability and to allow integration of collaboration data into such systems, we use a transactional Web Feature Service (WFS-T) [37], which is a standard interface for serving and storing geodata. A GML-based WFS application schema defines the encoding of information created during a collaboration process [19], such as session and user information, geospatial annotations and their precise 3D spatial references. These are modeled as distinct features to ease explicit sharing of instances, i.e., multiple annotation objects sharing spatial references. The usage of a WFS for data management enables a broad range of applications to integrate collaboration data. For example, GIS-tools can be used for collaboration-data analysis. Besides the obligatory GML output, multiple other output formats are supported. We use XSL-transformations to convert results
Fig. 3. Example of a widget embedded into a 3D GeoVE. The widget shows a website and an annotation’s metainformation. In the background other annotations are displayed in different, distance-dependent representations.
into KML documents and thus simplify integration into KML-enabled clients such as Google Earth4 , Nasa World Wind5 , and Bing Maps 3D6 .
5
Embedding Interactive Data into 3D Environments
Information associated with spatial references can be externally visualized using 2D widgets provided by user interface libraries (e.g., Qt, GTK7 ). Alternatively information can be internally visualized by embedding those widgets into virtual 3D space. External visualization uses separate windows and, therefore, spatial references must be encoded into the 3D visualization. The internal visualization, however, implicitly encodes spatial references within the 3D virtual world. Our client application uses embedded widgets for complex structured data (annotations and their metainformation listings or forms) (Fig. 3) to allow users a seamless interaction with the 3D GeoVE . Users can interact with the widgets to control the system, e.g., taking the camera position of an annotation’s author or highlighting all spatial references when clicking a button using the mouse 4 5 6 7
http://earth.google.com/ http://worldwind.arc.nasa.gov/ http://www.bing.com/maps http://www.gtk.org
pointer. Systems without window management, e.g., CAVE [38] or a kiosk systems, could profit from this kind of embedded interface [26]. In addition, application development based on Qt widgets is very well supported by tools. This helps to create such widget-based interactive 3D user interfaces quickly. Embedded widgets are integrated into the 3D space of a 3D GeoVE. Especially when collaborators share the same scene view, 3D widgets can be included into the collaboration process and, therefore, serve as collaboration subjects itself. Users are able to talk about and to annotate the visualization of the collaboration data itself like any other scene view using free-hand sketches or markup elements, such as arrows for pointing.
6
System Implementation
We implemented a prototypic system that supports synchronous and asynchronous collaboration based on 3D city models. Our architecture is divided into three components (Fig. 4): – A C++ client for visualization and user interaction – A collaboration server handling synchronous collaboration – A transactional WFS implementation encapsulating storage and lookup of collaboration data The encoding format for collaboration information that has to be stored is described using a GML-based WFS-application schema [19]. It defines feature types as well as their relations. As service implementation we use the open source implementation from the deegree8 project. A PostGIS9 database is used as data-backend for the service. For generation of KML-encoded output the service is configured using XSL-transformations. This way, collaboration data can be integrated into KML enabled clients for exploration and analysis. The collaboration server for handling of volatile session data, such as the currently participating users and their positions in the 3D GeoVE, is implemented in C++. We use a slim message passing protocol via TCP for communication between server and client applications. Messages are used to transmit a variety of data types, i.e., line strings of sketches, camera positions and orientations for camera synchronization, or text messages for the chat implementation. The system’s user interface is implemented through the Collaboration Client component. Each user executes an instance of the client application. This application visualizes a virtual 3D city model interactively. The distribution of the model is done using an XML descriptor file, which specifies access to a file containing model data. While other distribution methods, such as loading the model through a CityGML [39] serving WFS, are possible, we decided the simplest, file-based one was sufficients for our needs. Georeferenced images (e.g., satellite images or rendered maps) can be included as terrain textures to improve the visual quality of the rendering and provide additional orientation to 8 9
http://www.deegree.org http://postgis.refractions.net
XSD Application Schema
Configure
Transactional Web Feature Service GML encoded Data via HTTP
Read
3D City Model Data
Collaboration Client Messages / Events for Synchronous Collaboration via TCP
Session State
SQL
PostGIS
Annotation Data User Data Session Data
Collaboration Server Manages
Fig. 4. Architecture of our system for geocollaboration. All persistent data is stored by the WFS-T service in a PostGIS database. The Collaboration Server manages TCP-based message passing and the state of a synchronous collaboration session. 3D visualization and interaction is handled by the collaboration client application.
the user. The client is implemented using the Qt user-interface framework and OpenGL as rendering back-end. Communication with the WFS relies on the Qt implementation of the HTTP-protocol, which is used to manage network communications with the service. A user may perform sketch drawings on the view plane. Since the current view plane is defined by the camera position and alignment, those drawings are view dependent. Hence, during synchronous collaboration they are only allowed when users share the same scene view. To store those sketches the line strings of a sketch drawing are inversely projected into the 3D geographic coordinate system and encoded as GML geometry. To optimize information display inside the virtual environment our approach also addresses problems like visual clutter and decreasing screen space with increasing camera distance in 3D virtual environments. To adapt the display of information in 3D, we use an visualization that adjusts itself with regard to the distance from the location of the virtual camera. Annotations for the same spatial reference are grouped to reduce the total number of elements displayed at once in the 3D GeoVE. We distinguish three levels of semantic zoom [40] for information integration into 3D GeoVEs (Fig. 3): Level 0 - Far distance An icon, which symbolizes the existence of an information associated with this region. Level 1 - Medium distance A group of icons. Each icon symbolizes a category of information, e.g., information, hint or question. Together with the icon the number of information units (annotations) is displayed. The categories are chosen exemplarily.
Level 2 - Near distance An embedded Qt widget (Fig. 3) showing the information connected to the spatial subject and providing interaction possibilities. We use the Qt widget engine for embedding an interactive widget into the 3D GeoVE. This user-interface framework provides an OpenGL framebuffer object as paint device, which enables rendering widgets directly into an OpenGL texture (Fig. 5). Rendering a widget as texture is very efficient because no explicit data transfer from the memory of the graphic hardware is necessary. In this way, refresh rates can be achieved that are sufficient to enable video playback using such widgets. A single quad, which is placed above the spatial reference of the annotation, is used as underlying geometry for texturing. The connection between annotation content and annotated spatial geometry is strengthened by this annotation placement strategy. Besides widget display, input events must be mapped to the virtual widget. First of all, for each widget a test is necessary to determine whether a mouse event happened above the depiction of the 3D embedded widget. Through saving the projection, orientation, and model-view matrix for each embedded widget when the OpenGL rendering is performed, this test is performed efficiently. The mouse position is transformed into widget coordinates using these matrices. If these widget coordinates comply with the encapsulated Qt widget’s boundaries the event is forwarded. Afterwards the widget texture is updated and the 3D scene is redrawn.
Events
QWidget
Widget Rendering
Use for Rendering
Repaint with
QGLFrambufferObject
3D GeoVE Rendering
GPU Memory
Renders Widget into
3D GeoVE Renderer produces
Texture
Scene View with embedded Widget
Fig. 5. Process of efficiently rendering an embedded widget. A QGLFramebufferObject is used as rendering device for the Qt widget. An OpenGL texture in GPU memory is used as render target. No separate transfer of pixel data to the GPU for rendering of the 3D GeoVE is necessary.
7
Discussion
Data created in course of collaboration sessions can be integrated in a variety of WFS or KML enabled clients. As a test, we used a generic WFS and WMS client (Gaia10 ), which is able to cope with 3D GML-geometries, to create mapbased visualizations. We combined the georeferenced collaboration information received from our WFS with several layers originating from diverse WMS services covering the same area (Boston, MA, USA). The result was useful for an overview of annotated regions. After configuring the feature’s display and styling the information the data could be usefully combined with other, possible domain-specific data and map layers. Currently, the display of 3D scene-embedded information is clustered in an straight forward way. Visualized information groups are tightly coupled to the model of spatial references, which describes georeferenced geometry. Information belonging to one spatial reference creates one group, depicted by a single element within the 3D GeoVE. It would be possible to create clusters that use spatial or functional properties as clustering parameters as well as dynamic clustering criteria. Such an approach for integration of information into 3D virtual environments would benefit from the interactivity of 3D virtual environments. For example, view-dependent animations can be used to highlight creation or merge of annotation clusters dependent to the camera position. At the moment, we are using a simple chat component, which optionally integrates collaboration events, such as annotation creation or joining or leaving users. The log created by our chat component shows a time ordered overview over the collaboration process. This component could be expanded by information about actually visible geographic markups at the time of message sending, which would additionally allow to trace the spatial course of a discussion. This could be used to implement and extend of the concept of ”Argumentation Maps” [14] for 3D GeoVEs. A sketch drawing can be helpful for communicating concepts that are hard to describe verbally. We created several sketch annotations using a mouse as input device and also using a tangible large-scale, wall-mounted display. It turned out that sketch creation using such an tangible display is much more natural than using a standard mouse. In the future, additional tools, e.g., a text typing integration into the sketch editor or prepared shapes, as they are found in conventional 2D drawing programs, could be added to improve the support for sketch creation using standard input devices. Additionally, the advantages and visualization mechanism for object sketching like the one provided by Sin et al. [28] could be further evaluated and integrated. Synchronous and asynchronous collaboration have different requirements regarding the type of communication. In contrast to asynchronous collabration, for synchronous collaboration, instant communication between collaborators is possible. Hence, asychronous collaboration scenarios need persistent annotations with information about the context of their creation. Because of the other ex10
http://www.thecarbonproject.com/
isting communication means in synchronous collaboration, annotations are not the primary communication means but provide a tool for persisting knowledge gained during an synchronous collaboration session. The basis for synchronous collaboration and integration of annotations into the 3D GeoVE is geographic space and also model data. This eases adaptation and usage of synchronous and asynchronous collaborative tools into different systems. Nevertheless, collboration sessions might need contraints to direct the collboration process towards a specialized problem. Such authoring functionality, e.g., defining boundaries or categories for annotations, is not supported by tools right now. This would be necessary to apply our collaboration approach for more application areas and more specific problems. At the moment such definitions are specified exemplarily. The current collaboration model is limited regarding its support for group collaboration. So no access registrictions or rights management is implemented by now. Especially large scale applications, e.g., public participation scenarios, could profit from annotations (information as well as sketches). Precise spatial boundaries of reference geometries and metadata collected during annotation creation in the 3d GeoVE allow for detailed analysis of this data. In this case, the informal nature of sketches is a disadvantage. The meaning of a sketch cannot be automatically analyzed, while text analysis techniques can be used for textual annotations.
8
Conclusions
We have shown concepts that support connecting synchronous collaboration (e.g., planning teams, virtual meetings) with asynchronous collaboration processes. We found sketches are useful for collaboration especially when a collaboration system with tangible displays is used to markup or to describe ideas of visual nature, such as arrangements or routes. Our approach for visualizing complex structured information in 3D GeoVEs supports large numbers of annotations to be visualized interactively. By integrating arbitrary Qt widgets into a virtual 3D environment we showed a possibility to create interactive scene elements whose applications are widespread. From integration of custom Qt widgets, videos, up to usable websites a large variety of content can be displayed and used for interaction purposes in 3D. Especially the annotation function used via an OGC WFS interface is considered valuable to support capturing collaboration or other geo-related data for later evaluation. This evaluation can either be performed collaboratively using our system for data exploration or externally using exisiting GIS software. The standard-based interface to collaboration data supports both. By now, the system has not been used in a real-world scenario. Additional user tests within a real collaboration scenario will be necessary to generate a more representative number of annotations. Analysis of these collaboration artifacts will yield a more thourough understanding of annotation usage, especially regarding the benefits of different types of annotations.
Future research directions could include the modeling of collaboration processes and their implementation in the system presented in this paper. Those defined processes could be used to generate a more fluid user interaction, by guiding users depentend to collaboration objectives to be achieved. Further, our concepts could be integrated into service-based systems for 3D geovisualization, e.g., into slim, web-based clients [41]. This would lower entry barriers for users and therefore open up a larger user base for a collaborative 3D GeoVE. Through our data-backend is already working with a standard OGC service, integration into a service-based geovisualization landscape should be a realistic scenario.
References 1. D¨ ollner, J., Baumann, K., Buchholz, H.: Virtual 3D City Models as Foundation of Complex Urban Information Spaces. CORP, Vienna (2006) 2. Sarjakoski, T.: Networked GIS for Public Participation Emphasis on Utilizing Image Data. Computers, Environment and Urban Systems 22(4) (7 1998) 381– 392 3. Nurminen, A., Oulasvirta, A.: Designing Interactions for Navigation in 3D Mobile Maps. In Meng, L., Zipf, A., Winter, S., eds.: Map-based Mobile Services: Design, Interaction and Usability, London, Springer (2008) 198–224 4. Greenhalgh, C., Benford, S.: MASSIVE: a collaborative virtual environment for teleconferencing. ACM Transactions on Computer-Human Interaction (TOCHI) 2(3) (1995) 239—-261 5. Pang, A., Wittenbrink, C.: Collaborative 3D Visualization with CSpray. IEEE Computer Graphics and Applications 17(2) (1997) 3241 6. Kay, A., Smith, D., Raab, A., Reed, D.: Croquet - A Collaboration System Architecture. In: Proc. First Conf. on Creating, Connecting and Collaborating Through Computing, 2003., IEEE (2003) 2–9 7. Dodds, T., Ruddle, R.: Using teleporting, awareness and multiple views to improve teamwork in collaborative virtual environments. In: Proc. of the 14th eurographics Symp. on virtual environments (EGVE’08), Eindhoven, Eurographics Association (2008) 81–88 8. Hindmarsh, J., Fraser, M., Heath, C., Benford, S., Greenhalgh, C.: Objectfocused Interaction in Collaborative Virtual Environments. ACM Transactions on Computer-Human Interaction (TOCHI) 7(4) (2000) 477–509 9. Applegate, L.M.: Technology Support for Cooperative Work: A Framework for Studying Introduction and Assimilation in Organization. Journal of Organizational Computing 1 (1991) 11–39 10. Duce, D.A., Brodlie, K.W., Gallop, J.R., Walton, J.P.R.B., Wood, J.D.: Distributed and Collaborative Visualization. Computer Graphics Forum 23(2) (Juni 2004) 223–251 11. Knapp, S., Coors, V.: The Use of EParticipation Systems in Public Participation: The VEPs Example. In: Urban and Regional Data Management, London, Taylor & Francis (2008) 93 – 104 12. Hopfer, S., MacEachren, a.M.: Leveraging the Potential of Geospatial Annotations for Collaboration: A Communication Theory Perspective. Int. Journal of Geographical Information Science 21(8) (2007) 921–934
13. Schill, C., Koch, B., Bogdahn, J., Coors, V.: Public Participation Comment Markup Language and WFS 1.1. In: Urban and Regional Data Management, London, Taylor & Francis (2008) 85–92 14. Kessler, C., Rinner, C., Raubal, M.: An Argumentation Map Prototype to Support Decision-Making in Spatial Planning. In: AGILE 2005 - 8th Conf. on Geographic Information Scienc, Springer (2005) 135–142 15. Yu, B., Cai, G.: Facilitating Participatory Decision-Making in Local Communities through Map-based Online Discussion. In: Proc. of the 4th Int. Conf. on Communities and technologies, New York, ACM (2009) 215–224 16. Mittlboeck M. Resch, B., Eibl, C.: geOpinion: Interaktives geo-Collaboration Framework - 3D-Visualisierung in Google Earth mit OGC WMS- und WFSDiensten. In Strobl J., B.T., Griesebner, G., eds.: Angewandte Geoinformatik 2006. Beitr¨ age zum 18. AGIT-Symp. Salzbur, Herbert Wichman Verlag, Heidelberg (2006) 464–469 17. Cai, G.: Extending Distributed GIS to Support Geo-Collaborative Crisis Management. Geographic Information Sciences 11(1) (2005) 4–14 18. Portele, C.: OpenGIS Geography Markup Language (GML) Encoding Standard, http://www.opengeospatial.org/standards/gml (Juli 2007) 19. Klimke, J., D¨ ollner, J.: Geospatial Annotations for 3D Environments and their WFS-based Implementation. In Painho, M., Santos, M.Y., Pundt, H., eds.: Geospatial Thinking. Lecture Notes in Geoinformation and Cartography, Berlin, Heidelberg, Springer (2010) 379–397 20. Lenne, D., Thouvenin, I., Aubry, S.: Supporting Design with 3D-Annotations in a Collaborative Virtual Environment. Research in Engineering Design 20(3) (September 2009) 149–155 21. Maass, S., D¨ ollner, J. In: Efficient View Management for Dynamic Annotation Placement in Virtual Landscapes. Volume 4073 of LNCS. Springer Berlin Heidelberg, Berlin, Heidelberg (2006) 1–12 22. Maaß, S., D¨ ollner, J.: Dynamic Annotation of Interactive Environments Using Object-Integrated Billboards. In: 14-th Int. Conf. in Central Europe on Computer Graphics, Visualization and Computer Vision, WSCG. (2006) 327–334 23. Ellis, S.E., Groth, D.P.: A Collaborative Annotation System for Data Visualization. In: AVI ’04: Proc. of the working Conf. on Advanced Visual Interfaces, New York, ACM (2004) 411–414 24. Kadobayashi, R., Lombardi, J., McCahill, M., Stearns, H., Tanaka, K., Kay, A.: Annotation Authoring in Collaborative 3D Virtual Environments. In: Proc. of the 2005 Int. Conf. on Augmented Tele-Existence, New York, ACM (2005) 255–256 25. Kadobayashi, R., Lombardi, J., McCahill, M., Stearns, H., Tanaka, K., Kay, A.: 3D Model Annotation from Multiple Viewpoints for Croquet. 4th Int. Conf. on Creating, Connecting and Collaborating through Computing (C5’06) (Januar 2006) 10–15 26. Andujar, C., Fairen, M., Argelaguet, F.: A Cost-effective Approach for Developing Application-control GUIs for Virtual Environments. In: IEEE Symp. on 3D User Interfaces, 2006. 3DUI 2006., IEEE (2006) 45–52 27. Jung, T., Gross, M., Do, E.: Annotating and Sketching on 3D Web Models. In: Proc. of the 7th Int. Conf. on Intelligent User Interfaces. Volume 1., New York, ACM (2002) 95–102 28. Sin, E.J., Choy, Y.C., Lim, S.B.: Content-based Sketch Annotations for Collaboration. ACM SIGGRAPH 2006 Research posters on - SIGGRAPH ’06 (2006) 21
29. Do, E.Y., Gross, M.D.: As if You Were Here - Intelligent Annotation in Space: 3D Sketching as an Interface to Knowledge-Based Design Systems. In: AAAI Fall Symp. - Making Pen-Based Interaction Intelligent and Natural. Volume 1., AAAI Press (2004) 55–57 30. Heer, J., Vi´egas, F.B., Wattenberg, M.: Voyagers and Voyeurs:Supporting Asynchronous Collaborative Visualization. Comm. of the ACM 52(1) (2009) 87–97 31. Ondrejka, C.: Collapsing Geography (Second Life, Innovation, and the Future of National Power). Innovations: Technology, Governance, Globalization 2(3) (2007) 27–54 32. Yao, J., Fernando, T., Tawfik, H., Armitage, R., Billing, I.: Computer Supported Cooperative Work in Design II. Volume 3865 of LNCS. Springer, Berlin/Heidelberg (2006) 33. Chastine, J., Brooks, J., Owen, G., Harrison, R., Weber, I.: A Collaborative MultiView Virtual Environment for Molecular Visualization and Modeling. In: Coordinated and Multiple Views in Exploratory Visualization (CMV’05), IEEE (2005) 77–84 34. Benford, S., Greenhalgh, C., Rodden, T., Pycock, J.: Collaborative Virtual Environments. Comm. of the ACM 44 (2001) 79–85 35. Strothotte, T., Masuch, M., Isenberg, T.: Visualizing Knowledge about Virtual Reconstructions of Ancient Architecture. In: Proc. of the Int. Conf. on Computer Graphics, IEEE Comput. Soc (1999) 36–43 36. Schumann, J., Strothotte, T., Laser, S., Raab, A.: Assessing the Effect of NonPhotorealistic Rendered Images in CAD. In: Proc. of the SIGCHI Conf. on Human Factors in Computing Systems: Common Ground, New York, ACM (1996) 35–41 37. Vretanos, P.A.: OpenGIS Web Feature Service (WFS) Implementation Specification (Mai 2005) 38. Cruz-Neira, C., Sandin, D.J., DeFanti, T.A., Kenyon, R.V., Hart, J.C.: The CAVE: Audio Visual Experience Automatic Virtual Environment. Comm. of the ACM 35(6) (1992) 64–72 39. Gr¨ oger, G., Kolbe, T.H., Czerwinski, A., Nagel, C.: OpenGIS City Geography Markup Language (CityGML) Encoding Standard Version 1.0.0 (2008) 40. Perlin, K., Fox, D.: Pad: An Alternative Approach to the Computer Interface. In: Proc. of the 20th Ann. Conf. on Computer Graphics and Interactive Techniques, New York, ACM (1993) 57–64 41. Hagedorn, B., Hildebrandt, D., D¨ ollner, J.: Towards Advanced and Interactive Web Perspective View Services. In: Developments in 3D Geo-Information Sciences, Berlin/Heidelberg, Springer (2009) 33–51