Toxicology and Applied Pharmacology 332 (2017) 149–158
Contents lists available at ScienceDirect
Toxicology and Applied Pharmacology journal homepage: www.elsevier.com/locate/taap
Combining transcriptomics and PBPK modeling indicates a primary role of hypoxia and altered circadian signaling in dichloromethane carcinogenicity in mouse lung and liver Melvin E. Andersen a, Michael B. Black a,⁎, Jerry L. Campbell b, Salil N. Pendse a, Harvey J. Clewell III a, Lynn H. Pottenger c, James S. Bus d, Darol E. Dodd e, Daniel C. Kemp f, Patrick D. McMullen a a
ScitoVation LLC, Six Davis Drive, PO Box 110566, Research Triangle Park, NC 27709-5566, United States Ramboll-Enviro, Inc., Six Davis Drive, PO Box 13441, Research Triangle Park, NC 27709, United States c Olin Corporation, 100 Larkin Center, Midland, MI 48674, United States d Exponent, Inc., 5806 Woodberry Drive, Midland, MI 48640, United States e Charles River, 640 N. Elizabeth St., Spencerville, OH 45887, United States f Quintiles, 4820 Emperor Blvd., Durham, NC 27703, United States b
a r t i c l e
i n f o
Article history: Received 4 February 2017 Revised 31 March 2017 Accepted 4 April 2017 Available online 7 April 2017 Keywords: Dichloromethane Carcinogen Mouse Hypoxia Circadian cycle
a b s t r a c t Dichloromethane (DCM) is a lung and liver carcinogen in mice at inhalation exposures ≥ 2000 ppm. The modes of action (MOA) of these responses have been attributed to formation of genotoxic, reactive metabolite(s). Here, we examined gene expression in lung and liver from female B6C3F1 mice exposed to 0, 100, 500, 2000, 3000 and 4000 ppm DCM for 90 days. We also simulated dose measures - rates of DCM oxidation to carbon monoxide (CO) in lung and liver and expected blood carboxyhemoglobin (HbCO) time courses with a PBPK model inclusive of both conjugation and oxidation pathways. Expression of large numbers of genes was altered at 100 ppm with maximal changes in the numbers occurring by 500 or 2000 ppm. Most changes in genes common to the two tissues were related to cellular metabolism and circadian clock. At the lower concentrations, the changes in metabolism-related genes were discordant – up in liver and down in lung. These processes included organelle biogenesis, TCA cycle, and respiratory electron transport. Changes in circadian cycle genes – primarily transcription factors - showed strong concentration-related response at higher concentrations (Arntl, Npas2, and Clock were down-regulated; Cry2, Wee1, Bhlhe40, Per3, Nr1d1, Nr1d2 and Dbp) were up-regulated with similar directionality in both tissues. Overall, persistently elevated HbCO from DCM oxidation appears to cause extended periods of hypoxia, leading to altered circadian coupling to cellular metabolism. The dose response for altered circadian processes correlates with the cancer outcome. We found no evidence of changes in genes indicative of responses to cytotoxic, DNA-reactive metabolites. © 2017 The Authors. Published by Elsevier Inc. This is an open access article under the CC BY-NC-ND license (http://creativecommons.org/licenses/by-nc-nd/4.0/).
1. Introduction Dichloromethane (DCM; methylene chloride; CH2Cl2, CAS no. 7509-2), a multi-purpose solvent, has a long history of use in various commercial operations including paint stripping and, for a short period of time, in decaffeinating coffee. In two separate two-year inhalation exposure studies in mice, lung and liver tumor incidence increased between 2000 and 4000 ppm in both tissues (US_NTP, 1986; Aiso et al., 2014). These tumors were not seen in similarly exposed rats. In the 1980s mode of action (MOA) studies with chemical carcinogens emphasized the potential for formation of reactive metabolites that might interact with DNA leading to mutations and ultimately to cancer. Studies in ⁎ Corresponding author. E-mail address:
[email protected] (M.B. Black).
intact rats and mice provided detailed dose response relationships for DCM metabolism through two distinct pathways. Detailed analyses were conducted to compare dose response relationships among enriched ontology pathways and cancer outcome. DCM oxidation is the major metabolic pathway and results in formation of carbon monoxide - CO (Rodkey and Collison, 1977; Kubic and Anders, 1978). A second pathway, conjugation with glutathione (GSH) (Ahmed and Anders, 1978), produced metabolites that are mutagenic in bacterial and mammalian cell assays (Green, 1983; Longstaff et al., 1984). One challenge with DCM was to estimate the expected dose response for metabolism through these pathways in intact animals. Gas uptake studies with DCM, exposing rats in a closed, recirculating chamber atmosphere, showed that two kinetic processes controlled loss from the chamber (Gargas et al., 1986a). Using a group of dihalomethanes, including DCM, chlorobromomethane and dibromomethane (CH2Cl2,
http://dx.doi.org/10.1016/j.taap.2017.04.002 0041-008X/© 2017 The Authors. Published by Elsevier Inc. This is an open access article under the CC BY-NC-ND license (http://creativecommons.org/licenses/by-nc-nd/4.0/).
150
M.E. Andersen et al. / Toxicology and Applied Pharmacology 332 (2017) 149–158
CH2ClBr, CH2Br2), it was possible to differentiate the contribution of the two pathways across exposures by evaluating production of CO and the release of bromide (Gargas and Andersen, 1982). Metabolic constants estimated by bromide release and production of carboxyhemoglobin (HbCO) confirmed the accuracy of gas uptake methods, increasing confidence in the kinetic parameters for DCM metabolism (Gargas et al., 1986b). Overall, these studies showed that oxidation was a high affinity, lowcapacity pathway for DCM that showed saturation above about 500 ppm in rats and mice. The GSH pathway was low affinity, higher capacity, and was expected to be nearly linear above exposure concentrations causing saturation of oxidation. On the basis of these detailed studies of the metabolism of DCM and in vitro mutagenicity of GSHpathway metabolites, cancer risk assessments used rates of metabolism through the GSH-conjugation pathway as carcinogenic dose measures and assumed that carcinogenicity in the lung and liver arose from the GSH-derived mutagenic metabolite – chloromethylglutathione (Andersen et al., 1987). It bears emphasis that this conclusion regarding chloromethylglutathione as a putative carcinogenic metabolite was based on MOA research conducted over thirty years ago. A great deal of new information has been gathered since that time to allow extension, confirmation and refinement of the original ideas about the carcinogenic modes of action of DCM in mouse lung and liver. Over the intervening period, many compounds with very diverse structures have caused tumors in mouse lung and liver on lifetime exposures. Today, it is not at all clear that direct mutagenicity/DNA-reactivity is the dominant MOA for the carcinogenicity of the majority of these compounds. New approaches for assessing MOAs of these diverse chemicals are needed to have a better overall appreciation of the tissue responses for these diverse compounds. Our group has assessed MOAs by evaluating gene expression changes in target tissues after exposure to various chemicals, coupled with pathway enrichment analysis to examine alterations in the biochemical and disease-oriented pathways following exposures. These analyses have increasingly relied on Reactome ontologies and several new bioinformatic tools for visualizing the network of changes associated with the exposures (McMullen et al., 2014; Pendse, 2014; Black et al., 2015). Gene expression changes were previously evaluated in cancer target tissues after 90 day exposures for 26 chemicals – half of these caused tumors in mouse lung in 2-year bioassays, the other half did not (Thomas et al., 2009). One of the lung tumor positives in this study was DCM. In this paper, we use the DCM gene expression results to infer possible MOAs in lung and liver from the female B6C3/F1 mice. The gene expression changes in these tissues were correlated with expected tissue doses for DCM, including rates of metabolism through the oxidation pathway and the expected time course behaviors of blood HbCO arising from DCM oxidation. These dose measures were calculated with an updated mouse PBPK model for DCM inhalation (Andersen et al., 1994) that was expanded to include metabolism in lung and the presence of deep tissue compartments. The inclusion of deep compartments for DCM was consistent with earlier work on DCM blood time courses following intravenous and oral dosing in male B6C3F1 mice (Angelo et al., 1984, 1986). Deep tissue compartments act as depots that continue to release DCM in the hours immediately following the inhalation exposures. 2. Methods 2.1. In-life study The details of the inhalation exposures to DCM (CASRN 75–09-2) and other aspects of the in-life portion of this study are included in supplemental materials (Supplemental File S1: In-life DCM exposures in Female B6C3F1 Mice). The study exposed adult female B6C3F1 mice obtained from Charles River Laboratories (Raleigh, NC) in six exposure groups (0, 100, 500, 2000, 3000 and 4000 ppm DCM) for 13 weeks (6 h/day; 5 d/week). Animal use in this study was approved by the
Institutional Animal Use and Care Committee of CIIT Centers for Health Research and was conducted in accordance with the National Institutes of Health guidelines for the care and use of laboratory animals. Animals were housed in fully accredited American Association for Accreditation of Laboratory Animal Care facilities. 2.2. Gene expression The gene expression array files from the original study are available in the National Center for Biotechnology Information Gene Expression Omnibus (GEO data GSE17933 - lung and GSE18858 - liver). Each series of arrays for the two tissues was analyzed independently and included 4 biological replicates for each treatment concentration and for the air only control group. Affymetrix CEL files were normalized by RMA (Irizarry et al., 2003) using the BioConductor (release 3.0) package affy (Gautier et al., 2004) and analyzed with the package LIMMA (Smyth, 2005). LIMMA fits a general linear model to the array data by robust regression allowing for sufficient iterations to ensure convergence of the model coefficients. A series of contrasts was then applied to the linear model. Each contrast is an estimate of the Log2 expression ratio [mean Log2 expression treatment – mean Log2 expression control] or Log2 fold change at each concentration. Statistical significance testing was then performed on the GLM fitted data using the R package eBayes which uses Bayesian methods to infer statistics based on the estimated prior distribution of the data (prior distribution estimated by maximum likelihood). Individual contrasts are tested by moderated T statistics (i.e., estimated Log2 fold change divided by its standard error), moderated in that their estimated standard error will have been “shrunk” by permutation towards a common (mean) posterior distribution value estimated by the Bayesian maximum likelihood model. Moderated F statistics were used across all data to test differential expression at any exposure level, analogous to a one-way ANOVA test of significance by dose across all doses. Significant differential gene expression could then be determined for genes showing a concentration-dependent response by dose across all exposure concentrations, as well as those showing a specific response, relative to controls, for each exposure concentration. Differential gene expression was determined by two criteria. A statistical threshold of change is determined by multiplicity corrected pvalues and expressed as a False Discovery Rate (FDR) of b0.05 (Benjamini and Hochberg, 1995). For some of the analyses, a magnitude of change threshold was also applied, where the estimated fold change of a gene passing the FDR must be N1.5-fold up-regulated or 1.5-fold down-regulated, relative to the common control samples (|FC| N 1.5). For the concentration-specific contrasts, these two thresholds were applied simultaneously to give higher stringency for determining differential gene expression. All initial statistical testing was performed on the whole array of 45,037 probes representing 20,627 unique annotated genes. Once probes passing the significance threshold were identified, all un-annotated and promiscuous probes were discarded. A promiscuous probe is a probe set that may bind to multiple genomic transcripts from different genes (e.g., transcripts within a family of highly conserved genes), but thus cannot be taken to unambiguously indicate the presence of some specific gene product. All remaining annotated probes were then summarized by averaging estimated fold-change for any genes with significant redundant probes, to produce a final list of unique genes passing the significance threshold. 2.3. Pathway enrichment Using lists derived from these differential expression analyses, ontologic enrichment was performed using conventional hypergeometric tests for set enrichment against the public Reactome data base (www. reactome.org). Ontologic enrichment was considered significant if at least 5 of the query set elements were found within the ontology category
M.E. Andersen et al. / Toxicology and Applied Pharmacology 332 (2017) 149–158
elements, and if the hypergeometric enrichment FDR corrected p-value was N0.05. The relationship of the enrichment categories was then displayed using visualization programs referred to as ‘bubble maps’ (McMullen et al., 2014; Pendse, 2014; Black et al., 2015). 2.4. Physiologically based pharmacokinetic modeling PBPK models for DCM in the mouse have been developed for intravenous, oral, and inhalation exposures (Angelo et al., 1984, 1986; Andersen et al., 1987, 1994). Studies with metabolite production in rats in the 1980s have served as the basis for establishing kinetic constants for oxidation (cytochrome P-450 mediated pathways) and conjugation (GSH – mediated pathways). Here, we modified a PBPK model for DCM in mice that was initially developed to track rates of oxidation and GSH conjugation in lung and liver, CO production, and formation of blood HbCO (Andersen et al., 1994). A similar model structure had also successfully described the kinetics of DCM, blood HbCO and exhaled CO in rats and human subjects (Andersen et al., 1991). There were two changes introduced in the present model structure. First, deep tissue compartments based on the lipid content of tissues, as had been used with the intravenous/oral models (Angelo et al., 1986), were added to examine factors governing persistence of blood HbCO after cessation of exposure. The deep tissue compartments volumes were set to the values for tissue lipid content and, for the purposes of the simulations, the permeation area cross product for transport from the well-mixed to the deep compartments were set to 10% of tissue blood flow. Second, to more directly compare responses in lung and liver, metabolic capacity for oxidation was included in lung with a total capacity of 15% that of liver. In the model, DCM oxidation occurred in both liver and lung with a stoichiometric yield of 0.76 mol CO per mole DCM oxidized, as determined previously (Gargas et al., 1986b; Andersen et al., 1994). The CO moved directly to the blood compartment. A Coburn-Forster-Kane model (Coburn et al., 1965) accounted for CO production from DCM, CO binding to hemoglobin, diffusion of CO from blood to air in lung, and exhalation of CO. The parameter set used for the simulations provided a maximum of HbCO of 15%. Modeling was carried out using acslX™ software (Aegis Technologies, Huntsville, Alabama). The supplemental file (Supplemental File S2) contains the PBPK model schematic, the model code (in acslX) and a table of parameters, largely derived from the work with female B6C3F1 mice (Andersen et al., 1994). 3. Results 3.1. In-life results The measured DCM exposures for the 6 test groups were: 0 ± 0, 102 ± 3, 500 ± 40, 2014 ± 28, 2961 ± 263, or 3991 ± 115 ppm. There was no mortality during the 90-day exposures. At the end of the exposures, no lung histopathological changes were observed. Livers were enlarged at the higher exposures with some minor evidence of periportal vacuolation (Supplemental File S1). 3.2. Gene expression Both liver and lung tissue had large numbers of differentially expressed genes. The degree of change for most of them was small relative to the controls, as evidenced by the decline in significant genes with the addition of a 1.5-fold magnitude of change threshold (Fig. 1A). Of 11,342 genes with statistically significant changes in lung at any concentration, only 884 had an absolute value fold-change larger than 1.5. The fold-change of all genes significant by concentration is depicted in Fig. 1B, showing the mean with both 25th and 75th percentiles with genes outside this range plotted as individual points. In lung, the average change in expression tended to decrease at the two higher
151
exposures (3000 and 4000 ppm) where a large number of genes outside the 25th and 75th percentiles had |FC| b 1.5. Of the 7964 genes with statistically significant changes in expression in liver, 1369 had an absolute magnitude of change N1.5-fold for at least one concentration. Liver had a large increase in differentially expressed genes as concentration increased from 100 ppm to 500 ppm, but the numbers of genes did not increase proportionately with concentration above 500 ppm. 3.3. Assessing pathway enrichment To compare expression among the differentially expressed genes common to lung and liver, the 5267 genes significant by concentration at an FDR b 0.05 in both tissues were used to produce the cluster heatmap (Fig. 1C). This analysis produced 4 large clusters. Clusters 1 and 4 had either very little or no significant ontology enrichment. Cluster 3 had 1505 genes that were largely discordantly expressed – up in liver, down in lung. This grouping had a number of enriched ontology categories (Fig. 2). There were 12 genes in the cholesterol metabolism category – Cyp51, Ebp, Fdft1, Hsd17b7, Lss, Mvk, Pmvk, Dhcr24, Fdps, Mvd, Hmgs1 and Idi1 – representing both steps from HMGCoA through farnesylphosphate and then from farnesylphosphate on to sterol synthesis. Among the genes in the categories of organelle biogenesis were 25 mitochondrial ribosomal proteins. Of the 38 genes in the categories of respiratory electron transport chain, ATP synthesis and heat production, there were 5 genes from the ubiquinol-cytochrome C reductase complex family, 20 from the NADH-ubiquinone oxidoreductase complex and cytochrome c. Clearly, DCM exposure caused broad changes in expression of genes from mitochondrial respiration and ubiquinol metabolism with increases in these activities in liver and decreases in lung. Additionally, many of these genes in lung tissue cluster 3 showed maximal down-regulation of expression beginning at the very lowest concentration (100 ppm), trending back to background expression levels at the two highest concentrations. This decreasing trend was not seen in liver where the concentration-response was different: overall expression levels were often modestly up-regulated at 100 pm, increased at 500 ppm and tended to remain up-regulated through 3000 ppm. Clearly, there was no simple, monotonic dose-response relationship for the gene changes in either tissue. Using the |FC| N 1.5 criterion, there were 224 genes in common between lung and liver. These 224 are displayed in a Wards clustered heatmap (Fig. 3A). Most of these (the 150 genes in the larger lower cluster) are predominantly down-regulated in liver and up-regulated in lung. Separating these 224 genes into two groups (the 150 and the remaining 74), we performed enrichment analysis with both lists using the Reactome ontology (Fig. 3B). Two ontology categories were significantly enriched with the full set of 224 genes - circadian clock and mouse biological processes. The eight genes in the circadian clock category had some of the largest changes with treatment: Nrd1 had maximum fold-changes of 2.65 at 3000 ppm in liver and 3.67 in lung at 4000 ppm; Per2 had fold-changes of 1.63 at 4000 ppm in liver and 3.15 in lung at 4000 ppm. Clock was down-regulated in both tissues, with a fold-change of − 1.61 in liver and − 1.51 in lung at 4000 ppm. Aryl hydrocarbon receptor nuclear translocator-like gene (Arntl) was down-regulated in both tissues with fold-changes of − 3.67 in liver and −5.45 in lung at 4000 ppm. Among all the genes that were statistically significant in both tissues, Arntl had the largest level of down-regulation and Nr1d1 was the third most up-regulated gene overall; Nr1d2, another nuclear receptor family gene, showed a slightly higher foldchange, but this gene is not included in the circadian clock genes in the Reactome ontology. Tissue enrichment bubble maps were generated at each concentration for lung and liver (Supplemental File S3). Overall the enrichment in lung was sparser than in liver. At the three lower concentrations cell division and sister chromatid cohesion were enriched. At
152
M.E. Andersen et al. / Toxicology and Applied Pharmacology 332 (2017) 149–158
Fig. 1. Gene expression changes following 90-day exposures to DCM in female B6C3F1 mice. (A) There were many more genes changed using purely statistical-criterion (FDR b 0.05) than based on an absolute value fold-change of 1.5. The table shows the number of differential expressed genes, as well as the total number of significant array probes in parenthesis (statistical tests were performed on the entire array probe set, included unannotated and promiscuous probes). The Venn diagrams show 5000 common genes between the two tissues genes that passed the FDR criterion and 224 that passed both the FDR and FC criteria. (B) The box and whiskers plots show the mean and 25th and 75th percentile with values outside the range shown as individual points. (C) The heatmap provides a hierarchical clustering of the 5267 genes that were common between the two tissues and whose changes were statistically significant relative to control samples.
2000 ppm, these pathways were joined by pathways of lipid metabolism, while at 3000 and 4000 ppm the categories affected were limited to circadian clock and control of gene expression by circadian clock. In liver, there were no enriched categories at 100 ppm; at 500 ppm, there was enrichment of cell division and sister chromatin cohesion; at 2000 ppm enrichment was primarily in cholesterol biosynthesis. Circadian clock processes were enriched at both 3000 and 4000 ppm with marked enrichment of various pathways of cellular metabolism at 4000 ppm. Using the genes differentially expressed at 2000, 3000, and 4000 ppm in liver (Fig. 4A), there was enrichment of several metabolic processes, cell division, circadian clock, and regulation of cholesterol biosynthesis. The category of functionalization included proteins catalyzing oxidation reactions - 13 cytochrome P450 family enzymes, 1 aldehyde dehydrogenase, 2 flavin-containing monooxygenases and a polyamine oxidase. Significant enrichment in lung tissue was largely limited to the lowest three concentrations of 100, 500 and 2000 ppm (Supplemental File S3). At 2000, 3000 and 4000 ppm, enrichment of circadian clock (Fig. 4B) was evident. Lung also showed enrichment for metabolism of lipids and lipoproteins though not specifically for cholesterol pathways, as were seen in liver. The category for synthesis of
epoxy (EET) and dihydroxyeicosatrienoic acids (DHET) consisted of RNA for 5 CypP450 enzymes – Cyp2c29, 2c50, 1a2, 2c54 and 2j5. The concentration-responses for the genes in the cholesterol and circadian pathways were plotted as a heat map (Fig. 4C). Clustering showed a group of down-regulated circadian genes common to both lung and liver (Arntl, Npas2, Cry1, Clock, Nr3c1, Rora, Ncor1, Nampt and Ppargca1), and a group of up-regulated circadian genes common to both tissues (Cry2, Wee1, Bhlhe40, Per2, Nr1d1 and Nr2d2). The cholesterol pathway genes were primarily in the center grouping with less consistent responses across concentrations in the two tissues. 3.4. Dose-response for genes with diurnal variability There are shifting patterns of gene expression in various mouse tissues across time of day (Zhang et al., 2014) and the normal circadian time associated with peak expression of these genes differed between lung and liver. The published analysis showed the time of peak expression and provided lists of specific genes with circadian rhythms in each tissue. We conducted an evaluation of the numbers of these phase shifted genes that also had concentration-dependent changes in response to DCM. Of the 40 phase shifted genes identified in liver, 30
M.E. Andersen et al. / Toxicology and Applied Pharmacology 332 (2017) 149–158
153
Fig. 2. Reactome ontology enrichment of genes discordantly affected between the two tissues. Using the group of 2952 genes in clusters 2 and 3 (Fig. 1C), enrichment was visualized in relation to the numbers of genes in a category (the size of the circle) and whether there was enrichment for cluster 2 (red) or cluster 3 (green).
had concentration-dependent responses with DCM; of the 29 phase shifted genes in lung, 20 had concentration-dependent changes in our studies with DCM. These genes and their concentration-related changes were expressed as heat maps (Supplemental File S4) and show several genes identified in the circadian clock pathways in our studies – e.g., Arntl, Per2, Nr1d1 and Wee1. 3.5. Gene expression patterns for tissue transcription factors Many of the genes in the category of circadian clock code for transcription factors (TFs). As part of the analysis of the changes in gene expression, we specifically evaluated changes in TF expression using a list of mouse genome transcription factors identified from Ensembl's BioMart metadata matching tools (www.ensembl.org). Fig. 5 depicts a heatmap of the union of all TF genes that had a |FC| N 1.5 at any concentration in either tissue. Several clusters within the heatmap show genes with concentration responses similar to the concentration response for tumors – with increasing | FC | changes in expression from 2000 to 4000 ppm. Two of the groupings have similar directionality in the lung and liver. These include a group of three down-regulated genes – Npas2, Arntl and Nfil3 – at the top of the heat map and a group of five (5) up-regulated genes near the center – Dbp, Nrd1, Nrd2, Tef and Bhlhe40. Although not classed as TFs, two Per genes, Per2 and Per3 in lung and Per3 in liver, also show similar patterns with sharp upregulation above 2000 ppm. In lung, Hlf and Hes6, at the top of the central cluster, also increased at the two higher concentrations. The lung TF genes showing marked down-regulation at higher exposure concentrations are primarily zinc finger proteins – some of which are up-regulated at the three lower concentrations then down-regulated at 4000 ppm. There are also TF genes altered at the higher exposures that are present in liver but not in lung -
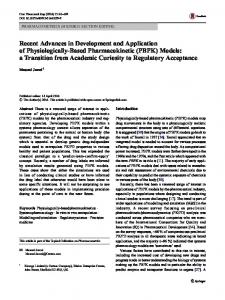
a suite of up-regulated TFs, just above the up-regulated cluster common to both tissues and a grouping of down-regulated TFs just below the first three genes at the top. Liver specific up-regulated TF genes include Klf10, Junb, Mafb, Foxo3, and Bcl6. A larger number of TF genes in liver were down-regulated at 3000 and 4000 ppm, including Pias1, Rreb1, Cux1, Ppard, Id3, Sail1, Irf5, Stat5a and Stat5b. The heatmap shows that the changes in the core group of TF genes at 3000 and 4000 ppm in lung is accompanied by a shift in up-regulated TF genes at 100, 500 and 2000 ppm to background expression. There was no similar pattern in liver. In addition, to depicting TF changes with the heatmap, a listing was compiled of the 15 most highly up-regulated and most highly down-regulated TF genes in each tissue and at each DCM concentration (Supplemental File S6). These tables demonstrate the different patterns of TF expression across concentration. 3.6. Dose metrics from PBPK modeling We simulated the contributions of P450-oxidation in lung and liver and the expected time course of blood HbCO for both a scenario with well-mixed tissue compartments and one with deep compartments equivalent to the fat content of each tissue (Fig. 6). Due to direct equilibration of lung tissues in the alveoli and terminal bronchi with the air, tissue equilibration in this lung region takes place at lower air concentration than inhaled concentrations required to achieve equivalent equilibration in liver (Sarangapani et al., 2002). The consequence of this behavior with a moderately soluble vapor such as DCM is a leftward shift of the concentration-response curve for the expected rate of metabolism in the lung, with higher relative rates of metabolism at lower exposure concentrations (Fig. 6A & B). The duration of elevated blood HbCO (Fig. 6C & D) is altered by including deep compartments. In the presence of deep tissue compartments (Fig. 6D), the post-exposure
154
M.E. Andersen et al. / Toxicology and Applied Pharmacology 332 (2017) 149–158
Fig. 3. Examining the genes affected in both tissues with FDR b 0.05 and |FC| N 1.5. (A) The heatmap clusters the 224 genes with FDR b 0.05 and |FC| N 1.5) that were altered in both tissues (Fig. 1A). There were two clusters – one with generally similar directional changes across that tissues and another cluster (with 150 genes) with discordant changes (down in lung and up in liver). (B) Reactome ontology enrichment for these genes showed little enrichment of metabolic processes, but significant changes in circadian clock and circadian rhythm signals for genes from both groups. There were 8 core genes changed that contributed to the circadian clock enrichment (listed in Table).
release from these deep stores is slower, leading to prolonged blood HbCO time courses at the higher exposure concentrations. When simulating multi-day exposures (results not shown), there were no significant differences in HbCO time-courses for subsequent exposure days compared to the first exposure day as expected from the return of HbCO to baseline within the 24-h simulations (Fig. 6D). 4. Discussion 4.1. Assessing MOAs from transcriptomic signatures We have now conducted a variety of studies in mice and rats with exposure durations from 1 to 90 days to evaluate gene expression in known target tissues for carcinogenicity. The compounds tested previously included formaldehyde in rat nasal epithelium ((Andersen et al., 2008, 2010), chloroprene in rat and mouse lung (Thomas et al., 2013), naphthalene in rat nasal olfactory and respiratory epithelium(Clewell et al., 2014) and inorganic arsenic in mouse and human bladder epithelium (Clewell et al., 2011; Yager et al., 2013). Ontology enrichment analyses with these compounds returned results consistent with their presumed MOAs: cytotoxicity and high dose DNA-damage repair for formaldehyde; glutathione depletion, cytotoxicity and DNA-damage repair for chloroprene and naphthalene; and disruption of oxidative stress/inflammatory signaling together with inhibition of DNA repair for inorganic arsenic. We recently conducted an evaluation of the lung gene expression changes in mice caused by vanadium pentoxide (V2O5) exposure –
another compound causing mouse lung tumors (Black et al., 2015) – using similar bioinformatics approaches and tools to visualize these patterns of enrichment as was done for this paper. Based on its strong oxidant properties, we expected to see activation of pathways for oxidative stress, altered GSH processing, and cell cycle changes due to cytotoxicity. Instead, the gene expression results were more consistent with changes in cell signaling processes related to altered phosphorylation associated with accumulating vanadate in the mouse lung, a possible alternative MOA not previously considered. DCM was included as a tumor-positive compound in the earlier study (Thomas et al., 2009). The histopathology results in our 90-day exposure study (Supplemental File S1) were consistent with the NTP 90-day studies that spanned a broader concentration range – 0, 525, 1050, 2100, 4200 and 8400 ppm. In that study (US_NTP, 1986), body weight gains by exposed mice were comparable to those of chamber controls at all concentrations; four males in the 8400-ppm group and two females each in the 8200-ppm and chamber control groups died before the end of the studies. The 8400-ppm and 4200-ppm concentrations produced minimal to mild-histopathological lung changes in rats and hydropic changes in the livers of mice; neither of these effects was observed in the air control mice. Thus, the in-life and necropsy results were similar between the current study and the NTP 90-day study. 4.2. Identifying consistent gene expression changes caused by DCM Based on previous work inferring that chloromethylglutathione was likely a genotoxic metabolite involved in DCM toxicity/carcinogenicity
M.E. Andersen et al. / Toxicology and Applied Pharmacology 332 (2017) 149–158
155
Fig. 4. Evaluating tissue gene expression changes in lung and liver at concentrations causing tumors in the 2-year exposure studies at NTP. (A) Reactome ontology enrichment for all genes with |FC| N 1.5 in liver. The circles indicate the categories with significant enrichment and the size of the circles indicates the number of genes in the category. Colors refer to the exposure concentrations. Grey indicates enrichment at all 3 concentrations, and light blue for both 3000 and 4000 ppm. Some metabolic categories are in dark blue representing responses only at 4000 ppm. (B) In the lung the Reactome enrichment showed consistent enrichment for circadian clock at the two higher concentrations (in light blue). (C) Heatmap showing clustering for the genes included in the circadian clock and cholesterol pathway across the 5 exposure concentrations. The top cluster (in red) and very bottom cluster with 6 genes (in blue) are the circadian clock genes.
in mice, and its expected concentration-response, we expected little genomic response until the oxidation reaction was saturated, predicted to occur above 500 ppm DCM. The gene expression results differed markedly from these expectations both in terms of the concentration-response and the biology inferred from the gene expression patterns. The Reactome ontology enrichment for these 90-day exposures showed no signals in liver or lung for oxidative stress, Nrf-2 pathways, DNAdamage/repair or GSH synthesis/oxidative stress. In lung, categories of cell division, cohesion loading into chromatin and establishment of sister chromatid cohesion were enriched at 100, 500 and 2000 ppm. In liver, similar pathways were enriched at 500 and 3000 ppm. Overall, the transcriptomic responses are more aligned with cell proliferation at the lower concentrations rather than cytotoxicity and repair. There were also small to moderate changes in expression of large numbers of genes, discordant responses between lung and liver in groups of genes related to cellular metabolism, and common changes in circadian clock-related genes at the higher, carcinogenic concentration in both tissues. As shown in Supplemental File S5, we also examined the changes in genes known to have circadian rhythms in mouse lung and liver (Zhang et al., 2014). Not all of these were altered by DCM exposures. Nonetheless, key components of the core circadian clock circuitry (Ko and Takahashi, 2006) were uniformly affected at the higher exposure
concentrations. Changes in concentrations of these components of the circadian clock are linked to diurnal regulation of metabolism in a tissue and cell-specific manner (Kohsaka and Bass, 2007). This linkage of circadian circuitry and metabolism has been extensively studied (Ueda et al., 2005) Sequential delayed feedback repression within the circadian cycle is organized by three cis-elements – E/E′ boxes, D-box and RRE motifs – that activate and repress each other through coordinated downstream mediators (Minami et al., 2013). Activators of the E/E′ box arm of the circuit include Npas2, Arntl (also called Bmal1) and Clock. All of these are among the most down-regulated genes in our study at the higher exposure concentrations. Nr1d1 (Reverbα) is involved in repression of RRE function and becomes strongly up-regulated at the higher DCM exposures. Various D-box proteins then link circadian changes to metabolic control in cells and act in concert with PPAR receptors (Kohsaka and Bass, 2007). The up-regulation of gene for three Dbox proteins, Dbp, Hlf and Tef, with down-regulation of Nfil3 (an inhibitor of D-box function) indicate strong, persistent linkages to cellular/ tissue processes that control metabolic processes within both lung and liver. This coordinated control of circadian-related metabolic control starts to become apparent in lung at 2000 ppm with movement of Dbp into the most up-regulated and Nfil3 into the most down-regulated TFs. These TF genes are even more affected in both lung and liver by 3000 ppm DCM. The dose-response for the appearance of these markers
156
M.E. Andersen et al. / Toxicology and Applied Pharmacology 332 (2017) 149–158
Fig. 5. Alterations of TF genes in C57Bl/6 mice exposed to DCM. This heat map shows the concentration response for changes in TF genes. Genes with |FC| N 1.5 at any concentration were clustered to show concentration related changes. Several clusters showed strong correlation between changes in circadian cycle processes at concentrations that caused lung and liver tumors in mouse bioassays. The file with expression values of the TF genes across concentration is in Supplemental File S5 (with gene symbol order and text color correspond to the heatmap's dendogram colors).
for metabolic control through circadian cycling coincides with the dose response for the appearance of tumors, where there are modest increases in incidence of lung and liver tumors at 2000 ppm and more significant increases between 2000 and 4000 ppm (US_NTP, 1986; Aiso et
al., 2014). The tissue dose response is clearest in the female mouse where background rates were lower than in males. In the more recent study (Aiso et al., 2014) combined bronchiolar adenoma and carcinoma incidences in females were 5/50 (control), 5/50 (1000 ppm), 12/49
Fig. 6. Dose measures calculated from a multi-compartment PBPK model for DCM describing tissues with single well-mixed compartments or with separate deep compartment equivalent to the fat content of the tissues. The upper panels show the expected rate of metabolism in the lung and liver at the end of the 6-hour exposure as a proportion of the maximum velocity for various exposure concentrations. The lower panels show the expected percent blood HbCO during and after the 6-hour exposure. Panels A and C are from the modified PBPK model with well-mixed tissue compartments; Panels B and D are from the model with deep compartments in the tissues.
M.E. Andersen et al. / Toxicology and Applied Pharmacology 332 (2017) 149–158
(2000 ppm) and 30/50** (4000 ppm). For combined hepatocellular adenoma and carcinoma, they were 2/50 (control), 8/50** (1000 ppm), 9/ 49** (2000 ppm) and 30/50** (4000 ppm). The double asterisk denotes statistical significance at the p b 0.05 level. The changes in gene expression in the two tissues indicates a more pervasive alteration in liver than in lung at the higher exposure concentrations, especially relative to enriched pathways associated with metabolic processes (Supplemental File S3). Among the TF genes affected by DCM in the liver were key regulators of metabolism, including two that were down-regulated, Ppard and Ar (Supplemental File S5), and one that was up-regulated, Pparg (Supplemental File S6). Ppard is an inhibitor of ligand-induced transcription activity of PPAR alpha and PPAR gamma. The down regulation of PPARd and up-regualtion of Pparg may drive the enrichment of many metabolic pathways in liver at high concentrations. The liver also had a larger number of TF genes altered with dose at the higher exposures than did the lung. In assessing the relationship of altered gene expression and the MOA for DCM, and other compounds such as V2O5, our experience was that the use of Reactome ontologies links better to underlying biology than other ontologies, such as MetaCore, and the coupling of Reactome pathway enrichment to visualization with bubble maps allows ready evaluation of the genes in each category. Based on our results with DCM and V2O5, there may be significant value in examining the gene expression patterns of the other compounds in the earlier 90-day study (Thomas et al., 2009) assessing both Reactome enrichment and altered expression of TF genes in these 90-day studies. 4.3. Linking gene expression changes with measures of tissue dose at lower concentrations The heatmap for the 5267 common genes affected in the two tissues showed differential sensitivity in lung and liver. The concentration-response behavior in the lung showed more robust responses in the number of genes affected at 100 ppm and nearly maximum responses at 500 ppm, compared to responses at higher concentrations which appear to plateau (Fig. 1). The liver responses were still increasing beyond 100 and 500 ppm concentrations. This differential concentration-response behavior between lung and liver likely arises due to expected differences in concentration-response for internal dose measures for moderately tissue-soluble compounds delivered by inhalation. For example, a PBPK analysis for inhaled styrene (Sarangapani et al., 2002) indicated that concentration-response relationships for metabolite toxicity of metabolites formed within tissues would shift to the left in the lung compared to the liver for inhaled vapors when the same enzymes were involved in oxidative metabolism in both tissues. This differential dose response arises because tissues in the alveolar/ terminal bronchial section of the lung equilibrate directly with air, while the equilibration in liver involves both the blood: air and tissue: blood equilibration. While there may be contributions to DCM oxidation from multiple cytochromes in lung – i.e., both Cyp 2e1 and Cyp2f2 closed chamber studies with DCM in mice (Andersen et al., 1994) indicated that high affinity oxidation was completely saturated by 500 ppm in the intact mouse. Thus, these large-scale changes in gene expression at the lower concentrations between lung and liver are most likely consequences of differential dosimetry – with relatively higher lung exposures to DCM compared to liver at the lower exposures. Fig. 5 (Panels A and B) illustrate this behavior. 4.4. CO signaling and tissue hypoxia The concentration-responses for gene expression from this study, with the more robust responses at the lowest exposure concentration, indicated that metabolites formed by DCM oxidation, i.e., CO or chloride, are likely involved in driving the majority of these genomic responses. Chloride is present in blood at relatively high concentrations (100 mM) under all conditions with relatively small contributions
157
expected from DCM metabolism. While we did not directly measure HbCO in our study, HbCO levels at concentrations where DCM metabolism is saturated exceeded 10% HbCO in rats (Andersen et al., 1991), and were even higher in mice – 16–18% HbCO at 500 or 1000 ppm DCM (Kim and Carlson, 1986). Importantly, DCM oxidation leads to CO production and elevated HbCO leads to reduced oxygen delivery due to the loss of available hemoglobin carrying capacity. CO itself is an important signaling molecule (Kim et al., 2006). Many biological functions of heme oxygenase (HO), such as countering oxidative stress, vasodilation, and anti-inflammatory activity, have been attributed to its enzymatic byproduct, CO. There is also evidence that HO-derived CO acts as an oxygen sensor and circadian modulator of heme biosynthesis. Both Nr1d1 and Nr1d2 are heme proteins that bind NO and CO (Pardee et al., 2009). The binding of NO and possibly CO to heme by Nr1 family proteins appears to relax the inhibition of Bmal1 production by Nr1d2 (Ko and Takahashi, 2006). In addition to the roles of CO as a second messenger in cell responses, the evidence from our genomics study indicates that decreased tissue oxygenation, altered control of genes involved with mitochondrial function/oxidative phosphorylation and attendant alterations in circadian processes are the more likely biological drivers of the genomic and carcinogenic responses to high levels of DCM. This hypothesis would account for the initial concentration-response throughout the three lower exposure concentrations with broad effects on cellular metabolic processes, including mitochondrial biosynthesis and oxidative phosphorylation. It does bear emphasis that the relevant dose measure from DCM oxidation is likely not blood HbCO, but rather the extent to which production and retention of CO within target tissues themselves alters oxygen utilization. To date, there have been no attempts to develop pharmacodynamic descriptions of CO effects within tissues or its potential effect on oxygen utilization after its production within tissues. The PBPK model includes direct movement of CO from tissues to the blood compartment after production without accounting for persistence of CO binding to heme proteins within the tissues. 4.5. DCM dose measures for the higher exposure concentrations If the responses to DCM including alterations in lung and liver tumor incidence were associated with altered cellular metabolism and nuclear receptor function from reduced oxygenation, why does the concentration response for tumors increase going from 2000 to 4000 ppm – concentrations well above those causing saturation of CO formation? Above saturation, DCM can be stored in deep tissue depots during exposure with subsequent slow elimination from fat deep tissue compartments that would extend the time course of DCM exposures. The presence of deep tissue stores of DCM would maintain blood HbCO (and reduced tissue oxygenation) into the post-exposure period producing clear differences for the three higher exposure concentrations (Fig. 6; Panel D). Assessment of the extent to which post-exposure release from deep compartments plays a role in regulating the HbCO time course requires careful serial measurements of blood HbCO in individual mice in the post-exposure period. 4.6. Summary The appearance of tumors in mouse lung and liver following DCM exposures appears to be related to core changes in circadian processes in the two tissues and then linkage of circadian rhythms to metabolism in a tissue specific manner. There common effects on circadian clocks in both tissues are in genes that code for regulatory proteins – Npas2, Anrtl, Nfil3, Dbp, Nr1d1, Nr1d2, Tef, Per3 and Bhlhe40. Our conclusion, identifying decreased tissue oxygenation from elevated HbCO and altered linkage of reduced oxygenation to both circadian cycle proteins and tissue metabolism as the likely MOA for tissue responses to DCM, remains tentative. Testing these ideas will require examination of
158
M.E. Andersen et al. / Toxicology and Applied Pharmacology 332 (2017) 149–158
gene expression responses to CO exposures of various durations. Such experiments would assess if the transcriptional responses to DCM relate more to CO/HbCO rather than intrinsic responses to DCM or its metabolites. Short-term transcriptomic studies with DCM, exposures lasting a few days or a few weeks, would be useful to see if responses at short exposure durations are similar with those seen at 90 days. Despite the obvious value of further studies to provide a clearer picture of gene expression changes following DCM or CO exposures, our results strongly indicate the previous conclusions regarding a genotoxic MOA for DCM through chlormethylglutathione as a mouse carcinogen in either lung or liver deserve very serious reconsideration. Gene expression profiling of short-term target tissue responses for mouse liver and lung carcinogens offers promise in identifying molecular initiating events (MIEs) and MOAs in order to move away from default approaches assuming that the appearance of tumors indicate the presence of DNA-damaging properties of the test compounds. Supplementary data to this article can be found online at http://dx. doi.org/10.1016/j.taap.2017.04.002. Transparency document The Transparency document associated to this article can be found, in the online version. Acknowledgements Our analysis of the genomics data set and the PBPK modeling in this study were supported by the Halogenated Solvents Industry Alliance, Inc. (HSIA) and the European Chlorinated Solvents Association (ECSA). The 90-day transcriptomic study was supported by the American Chemistry Council Long-Range Research Initiative (ACC-LRI) as part of an earlier program at CIIT-Centers for Health Research to assess genomic signatures for a group of mouse lung carcinogens. The funding for development of bioinformatic tools to evaluate patterns of gene expression and TF networks was provided by current support from the American Chemistry Council Long-Range Research Initiative (ACC-LRI) as part of a program at ScitoVation LLC to develop broad new computational tools to assess and better visualize modes of action of compounds in vivo and in vitro. References Ahmed, A.E., Anders, M.W., 1978. Metabolism of dihalomethanes to formaldehyde and inorganic halide—II. Studies on the mechanism of the reaction. Biochem. Pharmacol. 27, 2021–2025. Aiso, S., Take, M., Kasai, T., Senoh, H., Umeda, Y., Matsumoto, M., Fukushima, S., 2014. Inhalation carcinogenicity of dichloromethane in rats and mice. Inhal. Toxicol. 26, 435–451. Andersen, M.E., Clewell III, H.J., Gargas, M.L., Smith, F.A., Reitz, R.H., 1987. Physiologically based pharmacokinetics and the risk assessment process for methylene chloride. Toxicol. Appl. Pharmacol. 87, 185–205. Andersen, M.E., Clewell III, H.J., Gargas, M.L., MacNaughton, M.G., Reitz, R.H., Nolan, R.J., McKenna, M.J., 1991. Physiologically based pharmacokinetic modeling with dichloromethane, its metabolite, carbon monoxide, and blood carboxyhemoglobin in rats and humans. Toxicol. Appl. Pharmacol. 108, 14–27. Andersen, M.E., Clewell III, H.J., Mahle, D.A., Gearhart, J.M., 1994. Gas uptake studies of deuterium isotope effects on dichloromethane metabolism in female B6C3F1 mice in vivo. Toxicol. Appl. Pharmacol. 128, 158–165. Andersen, M.E., Clewell III, H.J., Bermudez, E., Willson, G.A., Thomas, R.S., 2008. Genomic signatures and dose-dependent transitions in nasal epithelial responses to inhaled formaldehyde in the rat. Toxicol. Sci. 105, 368–383. Andersen, M.E., Clewell III, H.J., Bermudez, E., Dodd, D.E., Willson, G.A., Campbell, J.L., Thomas, R.S., 2010. Formaldehyde: integrating dosimetry, cytotoxicity, and genomics to understand dose-dependent transitions for an endogenous compound. Toxicol. Sci. 118, 716–731. Angelo, M.J., Bischoff, K.B., Pritchard, A.B., Presser, M.A., 1984. A physiological model for the pharmacokinetics of methylene chloride in B6C3F1 mice following i.v. administrations. J. Pharmacokinet. Biopharm. 12, 413–436. Angelo, M.J., Pritchard, A.B., Hawkins, D.R., Waller, A.R., Roberts, A., 1986. The pharmacokinetics of dichloromethane. I. Disposition in B6C3F1 mice following intravenous and oral administration. Food Chem. Toxicol. 24, 965–974. Benjamini, Y., Hochberg, Y., 1995. Controlling the false discovery rate: a practical and powerful approach to multiple testing. J. R. Stat. Soc. Ser. B Methodol. 57, 289–300.
Black, M.B., Dodd, D.E., McMullen, P.D., Pendse, S., MacGregor, J.A., Gollapudi, B.B., Andersen, M.E., 2015. Using gene expression profiling to evaluate cellular responses in mouse lungs exposed to V2O5 and a group of other mouse lung tumorigens and non-tumorigens. Regul. Toxicol. Pharmacol. 73, 339–347. Clewell, H.J., Thomas, R.S., Kenyon, E.M., Hughes, M.F., Adair, B.M., Gentry, P.R., Yager, J.W., 2011. Concentration- and time-dependent genomic changes in the mouse urinary bladder following exposure to arsenate in drinking water for up to 12 weeks. Toxicol. Sci. 123, 421–432. Clewell, H.J., Efremenko, A., Campbell, J.L., Dodd, D.E., Thomas, R.S., 2014. Transcriptional responses in the rat nasal epithelium following subchronic inhalation of naphthalene vapor. Toxicol. Appl. Pharmacol. 280, 78–85. Coburn, R.F., Forster, R.E., Kane, P.B., 1965. Considerations of the physiological variables that determine the blood carboxyhemoglobin concentration in man. J. Clin. Invest. 44, 1899–1910. Gargas, M.L., Andersen, M.E., 1982. Metabolism of inhaled brominated hydrocarbons: validation of gas uptake results by determination of a stable metabolite. Toxicol. Appl. Pharmacol. 66, 55–68. Gargas, M.L., Andersen, M.E., Clewell 3rd, H.J., 1986a. A physiologically based simulation approach for determining metabolic constants from gas uptake data. Toxicol. Appl. Pharmacol. 86, 341–352. Gargas, M.L., Clewell 3rd, H.J., Andersen, M.E., 1986b. Metabolism of inhaled dihalomethanes in vivo: differentiation of kinetic constants for two independent pathways. Toxicol. Appl. Pharmacol. 82, 211–223. Gautier, L., Cope, L., Bolstad, B.M., Irizarry, R.A., 2004. affy—analysis of Affymetrix GeneChip data at the probe level. Bioinformatics 20, 307–315. Green, T., 1983. The metabolic activation of dichloromethane and chlorofluoromethane in a bacterial mutation assay using Salmonella typhimurium. Mutat. Res. 118, 277–288. Irizarry, R.A., Hobbs, B., Collin, F., Beazer-Barclay, Y.D., Antonellis, K.J., Scherf, U., Speed, T.P., 2003. Exploration, normalization, and summaries of high density oligonucleotide array probe level data. Biostatistics 4, 249–264. Kim, Y.C., Carlson, G.P., 1986. The effect of an unusual workshift on chemical toxicity. I. Studies on the exposure of rats and mice to dichloromethane. Fundam. Appl. Toxicol. 6, 162–171. Kim, H.P., Ryter, S.W., Choi, A.M., 2006. CO as a cellular signaling molecule. Annu. Rev. Pharmacol. Toxicol. 46, 411–449. Ko, C.H., Takahashi, J.S., 2006. Molecular components of the mammalian circadian clock. Hum. Mol. Genet. 15, R271–R277 (Spec No 2). Kohsaka, A., Bass, J., 2007. A sense of time: how molecular clocks organize metabolism. Trends Endocrinol. Metab. 18, 4–11. Kubic, V.L., Anders, M.W., 1978. Metabolism of dihalomethanes to carbon monoxide—III. Studies on the mechanism of the reaction. Biochem. Pharmacol. 27, 2349–2355. Longstaff, E., Robinson, M., Bradbrook, C., Styles, J.A., Purchase, I.F., 1984. Genotoxicity and carcinogenicity of fluorocarbons: assessment by short-term in vitro tests and chronic exposure in rats. Toxicol. Appl. Pharmacol. 72, 15–31. McMullen, P.D., Bhattacharya, S., Woods, C.G., Sun, B., Yarborough, K., Ross, S.M., Miller, M.E., McBride, M.T., LeCluyse, E.L., Clewell, R.A., Andersen, M.E., 2014. A map of the PPARalpha transcription regulatory network for primary human hepatocytes. Chem. Biol. Interact. 209, 14–24. Minami, Y., Ode, K.L., Ueda, H.R., 2013. Mammalian circadian clock: the roles of transcriptional repression and delay. Handb. Exp. Pharmacol. 359–377. Pardee, K.I., Xu, X., Reinking, J., Schuetz, A., Dong, A., Liu, S., Zhang, R., Tiefenbach, J., Lajoie, G., Plotnikov, A.N., Botchkarev, A., Krause, H.M., Edwards, A., 2009. The structural basis of gas-responsive transcription by the human nuclear hormone receptor REVERBbeta. PLoS Biol. 7, e43. Pendse, S., 2014. An interactive visualization tool to interpret transcriptomic data. Proceedings of the 6th International Conference on Bioinformatics and Computational Biology (June). Rodkey, F.L., Collison, H.A., 1977. Effect of dihalogenated methanes on the in vivo production of carbon monoxide and methane by rats. Toxicol. Appl. Pharmacol. 40, 39–47. Sarangapani, R., Clewell, H.J., Cruzan, G., Andersen, M.E., 2002. Comparing respiratorytract and hepatic exposure-dose relationships for metabolized inhaled vapors: a pharmacokinetic analysis. Inhal. Toxicol. 14, 835–854. Smyth, G.K., 2005. Limma: linear models for microarray data. In: Gentleman, V.C.R., Dudoit, S., Irizarry, R., Huber, W. (Eds.), Bioinformatics and Computational Biology Solutions using R and Bioconductor. Springer, New York, pp. 397–420. Thomas, R.S., Bao, W., Chu, T.M., Bessarabova, M., Nikolskaya, T., Nikolsky, Y., Andersen, M.E., Wolfinger, R.D., 2009. Use of short-term transcriptional profiles to assess the long-term cancer-related safety of environmental and industrial chemicals. Toxicol. Sci. 112, 311–321. Thomas, R.S., Himmelstein, M.W., Clewell 3rd, H.J., Yang, Y., Healy, E., Black, M.B., Andersen, M.E., 2013. Cross-species transcriptomic analysis of mouse and rat lung exposed to chloroprene. Toxicol. Sci. 131, 629–640. Ueda, H.R., Hayashi, S., Chen, W., Sano, M., Machida, M., Shigeyoshi, Y., Iino, M., Hashimoto, S., 2005. System-level identification of transcriptional circuits underlying mammalian circadian clocks. Nat. Genet. 37, 187–192. US_NTP, 1986. Toxicology and carcinogenicity studies of dichloromethane (methylene chloride - CAS No. 75-09-2) in F344/N rats and B6C3F1 mice (inhalation studies). National Toxicology Program Technical Report Series No. 309. National Toxicology Program, U.S. Department of Health and Human Services, Public Health Service, National Institutes of Health pp. Yager, J.W., Gentry, P.R., Thomas, R.S., Pluta, L., Efremenko, A., Black, M., Arnold, L.L., McKim, J.M., Wilga, P., Gill, G., Choe, K.Y., Clewell, H.J., 2013. Evaluation of gene expression changes in human primary uroepithelial cells following 24-hr exposures to inorganic arsenic and its methylated metabolites. Environ. Mol. Mutagen. 54, 82–98. Zhang, R., Lahens, N.F., Ballance, H.I., Hughes, M.E., Hogenesch, J.B., 2014. A circadian gene expression atlas in mammals: implications for biology and medicine. Proc. Natl. Acad. Sci. U. S. A. 111, 16219–16224.