able, domain adaptation methods can be applied to utilize these recourses in ... bined filtering achieves the best performance among the sug- gested methods.
Combining Translation and Language Model Scoring for Domain-Specific Data Filtering Saab Mansour, Joern Wuebker and Hermann Ney Human Language Technology and Pattern Recognition Computer Science Department RWTH Aachen University Aachen, Germany @cs.rwth-aachen.de
Abstract The increasing popularity of statistical machine translation (SMT) systems is introducing new domains of translation that need to be tackled. As many resources are already available, domain adaptation methods can be applied to utilize these recourses in the most beneficial way for the new domain. We explore adaptation via filtering, using the crossentropy scores to discard irrelevant sentences. We focus on filtering for two important components of an SMT system, namely the language model (LM) and the translation model (TM). Previous work has already applied LM cross-entropy based scoring for filtering. We argue that LM cross-entropy might be appropriate for LM filtering, but not as much for TM filtering. We develop a novel filtering approach based on a combined TM and LM cross-entropy scores. We experiment with two large-scale translation tasks, the Arabicto-English and English-to-French IWSLT 2011 TED Talks MT tasks. For LM filtering, we achieve strong perplexity improvements which carry over to the translation quality with improvements up to +0.4% BLEU. For TM filtering, the combined method achieves small but consistent improvements over the standalone methods. As a side effect of adaptation via filtering, the fully fledged SMT system vocabulary size and phrase table size are reduced by a factor of at least 2 while up to +0.6% BLEU improvement is observed.
1. Introduction Over the past few years, large amounts of corpora for statistical machine translation (SMT) training were collected. These corpora span a variety of languages and topics. When one comes to tackle a new task, a natural question that arises is how to utilize the old resources in the most beneficial way for the task at hand. A good example for such scenario is the IWSLT 2011 TED task. This task focuses on the lectures domain, a topic with little domain-specific training data available. The organizers provide a small in-domain corpus as well as a large amount of out-of-domain data. This scenario opens a window for experimenting with adaptation methods of the out-of-domain data to the lectures domain.
One possible method to perform adaptation is filtering out unrelated sentences to the topic, thus keeping the most relevant sentences to the task at hand. The process of adaptation via filtering has several advantages: (i) the resulting vocabulary and phrase table are more focused on the topic, thus leading to less lexical ambiguity, (ii) better model estimation might be achieved as the amount of irrelevant training data decreases (iii) and the size of the resulting training corpus is smaller , thus opening the possibility to train more complex models and building smaller and faster systems. State-of-the-art SMT systems comprise many components, including a reordering model, language model (LM), translation model (TM), etc. In this work, we focus on filtering for LM and TM training. We perform filtering by assigning scores to each sample (sentence) in the training corpora, and discarding unrelated samples by setting a threshold. To rank the samples in the corpora we are interested to filter, we utilize the cross-entropy scores of the LM and/or a TM. The LM cross-entropy is estimated using the well-studied ngram-based LM probabilities, whereas the TM cross-entropy is estimated using the simple, yet effective IBM model 1 [1] probabilities. To filter sentences for LM training, we experiment with LM cross-entropy based ranking. As already shown in previous work, we report perplexity improvements of the filtered LM over the full counterpart. In addition, we show that these perplexity improvements carry over to the translation quality with significant improvements. Next, we focus on filtering for TM training. Unlike previous work, we argue that LM cross-entropy might be appropriate for LM filtering, but not as much for TM filtering. This is motivated by the fact that the LM-based score can not capture poorly aligned or even incorrectly translated sentences as it does not model connections between the source and the target sentences. We develop a novel filtering approach based on combined TM and LM cross-entropy scores, related, to some extent, to the log-linear combination score of an SMT system decoder. In our experiments, we compare LM-based and TM-based filtering alongside the combined method for TM adaptation. Our results show that the com-
bined filtering achieves the best performance among the suggested methods. In the Arabic-to-English experiments, the combined method filtered system performs significantly better than the in-domain baseline and is comparable to the full data system. As a side effect of adaptation via filtering, compared to using all data, the SMT system target vocabulary size is reduced by a factor of 7 while the phrase table size is reduced by a factor of 12 with no loss in translation quality. On the English-to-French task, using only the in-domain data already performs better than using both in-domain and outof-domain data. By performing data filtering, we are able to improve the in-domain baseline. Again, both target vocabulary and phrase table size is reduced considerably in comparison with the system trained on the full data. This paper is structured as follows. We review some related work in Section 2 and introduce the data selection methods in Section 3. The experimental setup is described in Section 4, results are discussed in Section 5 and we conclude in Section 6.
trast to the results in [7], where, if generalized to TM filtering, one would expect the latter to outperform the former. Note that [10] use the term general-domain corpus instead of out-of-domain corpus. This might be appropriate for their setup as the general-domain corpus was collected from many sources on the web. It performed significantly better than the in-domain baseline and they were able to improve the indomain system by adding a portion of the general-domain data, but not vice versa. In this work, we will use the terminology in-domain and out-of-domain, as the domain of technical and cultural TED lectures (in-domain) is different from the UN parliamentary speeches and the news corpus (out-of-domain). Our results show a significantly better indomain based systems than the out-of-domain counterpart. Our work differs from [10] in that we first apply monolingual data selection and continue experiments with the resulting LM. We also extend their technique by combining LM with TM scores to perform selection.
3. Cross-entropy based adaptation 2. Related work A broad range of methods and techniques have been suggested in the past for domain adaptation for SMT. The techniques include, among others: (i) semi-supervised training where one translates in-domain monolingual data and utilizes the automatic translations for retraining the LM and/or the TM ([2],[3]), (ii) different methods of interpolating indomain and out-of-domain models ([4], [5]) (iii) and sample weighting on the sentence or even the phrase level for LM training ([6],[7]) and TM training ([8],[9],[10]). Note that filtering is a special case of the sample weighting method where a threshold is assigned to discard unwanted samples. The most closely related work to ours from the ones mentioned above are [7] and [10]. They apply adaptation by using an LM-based cross-entropy filtering for LM training in [7] and TM training in [10]. [7] compared filtering using in-domain LM cross-entropy with filtering using cross-entropy difference of the in-domain and out-of-domain LMs. They found out that the crossentropy difference based filtering correlates better to the similarity between a sentence and the in-domain data, and produces the best LM perplexity between the two methods. Their work focused on improving the LM perplexity and no translation experiments were included. We add to [7] by showing that LM perplexity improvement via adaptation carries over to the translation quality. [10] adapted the cross-entropy difference method to the bilingual case, where the scores of the source and target LMs are interpolated linearly with similar weights. They apply their method for bilingual sentence filtering for TM generation. They show that the interpolated filtering achieves better translation results than a source-side cross-entropy difference based filtering. However, in their experiments an in-domain source-side cross-entropy only filtering performs better than the one using cross-entropy difference. This stands in con-
In this work, we use sample filtering for the purpose of adaptation. A common framework to perform sample filtering is to score each sample according to some model, and then assigning a threshold on the score which filters out unwanted samples. If the score we generate is related to the probability that the sample was drawn from the same distribution as the in-domain data, we are selecting the samples most relevant to our domain. In this way we can achieve adaptation of the out-of-domain data. Previous work used the LM cross-entropy score for LM and TM filtering. We argue that the LM cross-entropy score might be appropriate for LM filtering, but not as much for TM filtering. An LM does not capture the connections between the source and target words, and scores the sentences independently. Therefore, it can not identify poorly aligned sentences nor it is able to discriminate between word translation choices for specific-domain usage. Using a TM score, like the IBM model 1 (M1), we can estimate the likelihood that the sentences are translations of each other. Combining M1 scores in a cross-entropy difference scoring framework may also identify sentences related to the in-domain data from an out-of-domain corpus. In the following, we recall the LM based filtering and introduce the new M1 based filtering. We end the Section by introducing the combined LM and M1 filtering method. 3.1. LM cross-entropy LM cross-entropy score can be used for both monolingual data filtering for LM training as done in [7], or bilingual filtering for TM training as done in [10]. Given some in-domain corpus I and an out-of-domain (perhaps general) corpus O, we first generate a random subˆ ⊆ O of approximately the same size as I, and train the set O LMs LMI and LMOˆ using the corresponding training data.
Then, we score each sentence o ∈ O according to: HLMI (o) − HLMOˆ (o)
(1)
where H is the length-normalized LM cross-entropy, and is defined by: |x| X 1 HLM (x) = − log pLM (xi |xi−1 ) |x| i=1
trg
Ar
(2)
for a 2-gram LM case. |x| denotes the number of tokens in a sentence x. [10] adapted the LM scores for bilingual data filtering for the purpose of TM training. In this case, we have source and target in-domain corpora Isrc and Itrg , and correspondingly, ˆ src ⊆ general corpora Osrc and Otrg , with random subsets O ˆ trg ⊆ Otrg . Then, we score each sentence pair Osrc and O (s, t) by: HLMIsrc (s)−HLMOˆ src (s)+HLMItrg (t)−HLMOˆ
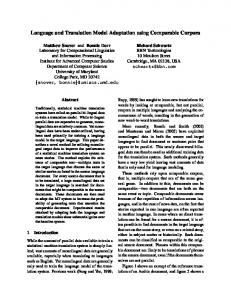
Table 1: Bilingual corpora statistics: OOV/X denotes the number of OOV words in relation to corpus X (the percentage is given in parentheses). OOD denotes the out-of-domain corpus, UN for Arabic-English and giga-fren for EnglishFrench. ALL denotes the concatenation of TED and OOD.
(t) (3)
Note that any sentence t0 with similar cross-entropy as t can exchange t and have a similar score according to this method. Therefore, poorly aligned data can not be detected by such a method. 3.2. M1 cross-entropy M1 is an effective model in state-of-the-art SMT systems and is used in a variety of applications. Among others, it is used in GIZA++ [12] as the first model in a pipeline of increasing complexity word alignment models, or as an effective rescoring model [11]. In this work, we use M1 scores as a filtering method to achieve adaptation to some domain specific data. We apply the same method as in [10], which is described in equation (3), but exchange the LM cross-entropy with the M1 cross-entropy score. The resulting formula � �� to score a sentence pair (s, t) = s1 , ..., s|s| , t1 , ..., t|t| according to M1 is: HM 1I (t|s) − HM 1Oˆ (t|s) + HM 1I (s|t) − HM 1Oˆ (s|t) (4)
Sentences Words Vocabulary Sentences Words Vocabulary OOV/TED OOV/ALL Sentences Words Vocabulary OOV/TED OOV/ALL
En
(5)
Fr
107K 2.1M 2.2M 44K 56K 21M 521M 620M 1.6M 1.6M 934 20K 3209 318 (1.1%) 58 (0.3%)
20K 3717 -
1664 32K 34K 3711 4678 329 (1.0%) 52 (0.2%) -
3.3. Combined LM and M1 cross-entropies As an addition to the M1 filtering method proposed in this paper, we suggest a combined method of LM and M1 scores. We choose linear interpolation of the M1 and cross-entropy scores as the combined method. Such a combination is similar to an SMT system decoder score, where one combines several model scores including an LM and a TM. The score of the combined method is defined by: α · (3) + (1 − α) · (4)
where |s| |t| X X 1 1 HM 1 (t|s) = − log pM 1 (ti |sj ) |t| |s| j=1 i=1
Sentences Words Vocabulary
En TED 90K 1.6M 1.7M 56K 34K OOD 7.9M 228M 226M 449K 411K dev 934 19K 20K 4293 3130 408 (2.2%) 184 (1.0%) test 1664 31K 32K 5415 3587 495 (1.6%) 228 (0.8%) -
(6)
The value of α can be optimized on a held out development set.
4. Experimental setup The cross-entropy of the inverse M1 model HM 1 (s|t) is calculated by switching s and t in equation (5). The definition of the score has several advantages: (i) we use both standard and inverse direction M1, thus leading to a stronger score, (ii) we use cross-entropy difference which, as was noted in [7], correlates better to the likelihood that a sample relates to some domain specific data (iii) and M1 captures relations between source and target words, thus leading to a more natural filtering method for TM training data.
4.1. Training corpora To evaluate the introduced methods experimentally, we use the IWSLT 2011 Arabic-to-English. We confirm our findings by some final experiments on the English-to-French MT track. The IWSLT 2011 evaluation campaign focuses on the translation of TED talks, a collection of lectures on a variety of topics ranging from science to culture. It is important to stress that IWSLT 2011 is different from previous years’
170
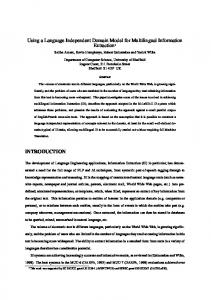
Table 2: Monolingual corpora statistics: the number of words is given in millions [M].
English news-shuffle English giga-fren French news-shuffle French giga-fren
160 150 140 perplexity
TED monolingual giga-fren news-shuffle europarl news-commentary
Words [M] English French 2.1 2.3 576 605 783 599 49 58 3.8 3.3
130 120 110 100 90 80 1/64
campaigns by the genre shifting from the traveling domain (BTEC task) to lectures (TALK task). Further, the amount of training data provided for the TALK task is considerably larger than for the BTEC task. For Arabic-to-English, the bilingual data consists of roughly 100K sentences of indomain data and 8M sentences of out-of-domain data. This makes the task more similar to real-life MT system conditions, and the discrepancy between the training and the test domain opens a window for a variety of adaptation methods. The bilingual and monolingual data for the Arabic-toEnglish and English-to-French MT tracks are summarized in Table 1 and Table 2 correspondingly. As out-of-domain data we use MultiUN (UN) for Arabic-to-English and the WMT11 Giga data (giga-fren) for English-to-French. For English-to-French a simple tokenization scheme was applied to both languages in the preprocessing step. For Arabicto-English, the English data was tokenized and lowercased while the Arabic data was tokenized and segmented using MADA v3.1 [13] with the scheme set to ATB (this scheme splits all clitics except the definite article and normalizes the Arabic letters alef and yaa). In all three languages numbers and URLs were replaced by a category symbol. For the bilingual corpora, sentences longer than 100 tokens, sentence pairs with a mismatch in categories and sentences 6 times or more longer than their translation were removed. From Table 1, we note that the out-of-domain data considerably reduces the number of out-of-vocabulary (OOV) words. This comes with the price of increasing the size of the training data by a factor of more than 100. By using filtering, we hope to reduce the amount of the out-of-domain data and build a filtered system which is comparable to or better than the full system. In a scenario similar to ours, where there is a small amount of in-domain data and large amount of out-of-domain data, we hope to achieve domain adaptation by discarding erroneous and unrelated phrase pairs, thus leading to less ambiguity and better phrase table quality. 4.2. Translation system The baseline system was built using a state-of-the art phrasebased SMT system similar to Moses [14]. We use the standard set of models with phrase translation probabilities for source-to-target and target-to-source directions, smoothing
1/32
1/16
1/8 size
1/4
1/2
1
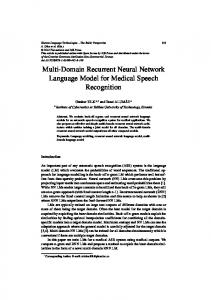
Figure 1: size (fraction of full data) against the resulting LM perplexity on dev for both news-shuffle and giga-fren target corpora.
with lexical weights, a word and phrase penalty, distancebased reordering and an n-gram target language model. The SMT system was tuned on the dev development set with minimum error rate training [15] using the BLEU [16] error rate measure as the optimization criterion. We test the performance of our system on the test set using the BLEU and translation edit rate (TER) [17] measures. We use TER as an additional measure to verify the consistency of our improvements and avoid over-tuning. All results are based on true-case evaluation. In addition to the raw automatic results, we perform significance testing over the test set. For both BLEU and TER, we perform bootstrap resampling with bounds estimation as described in [18]. We use the 90% and 95% (denoted by † and ‡ correspondingly in the tables) confidence thresholds to draw significance conclusions.
5. Results 5.1. Language model adaptation results In this Section, we summarize the experiments with LM cross-entropy filtering for LM training. As a baseline we use an LM trained on the TED data only. The mixture was optimized on the dev set. For the small corpora in Table 2, namely europarl and news-commentary, we generated separate unfiltered LMs, whereas for the large copora, gigafren.en and news-shuffle, we apply filtering. In Figure 1, we plot the filtered corpus size against the perplexity of the resulting LM on the dev set. The size axis is 1 x of the size drawn in log-scale, and includes 1x, 12 x, ..., 64 of the corpus. For the English giga-fren corpus, an optimum 1 is observed at 32 of the size of the corpus. The perplexity for the dev set is reduced from 160.7 for the full corpus to 104.4 at the optimum. For the English news-shuffle corpus, an optimum is observed at 18 of the corpus size, with the perplexity reduced from 111.5 to 84.3. Note that the dev perplexity of the baseline TED LM is 98.2. Thus, interestingly,
Table 3: LM filtering results: The translation systems are built using the TED data only and differ by the LM. ppl is the perplexity of the corresponding LM over the dev data. full LM includes all corpora, filter is similar to full but with filtered news-shuffle and giga-fren. LM
ppl
TED +full +filter
98.2 79.4 72.9
TED +full +filter
76.7 63.9 61.6
dev bleu [%] ter [%] Arabic-English 25.23 56.10 26.56 54.87 27.44 54.09 English-French 24.51 59.87 25.97 58.42 26.13 58.22
test bleu [%] ter[%] 23.40 24.81‡ 25.23‡
58.65 57.73† 57.27‡
27.46 29.59‡ 29.64‡
53.73 52.02‡ 51.89‡
the filtered out-of-domain corpus (news-shuffle in our case) yields a lower LM perplexity than the in-domain corpus. For 1 French, the minima are at 16 on giga-fren and at 81 on newsshuffle. Here, the perplexities are reduced from 129.6 to 95.7 on giga-fren and from 133.3 to 107.4 on news-shuffle. In Table 3, we compare the baseline LM (TED) to unfiltered (full) and filtered mixture LMs. The mixture was again optimized on the dev set. The full LM was built using a mixture of all monolingual corpora mentioned in Table 2 in addition to the TED LM baseline data and the target language side of the out-of-domain corpora. The filter LM is built similarly to the full LM, but using the best perplexity filtered version of news-shuffle and giga-fren (the top 18 1 sentences of news-shuffle and the top 32 of giga-fren for En1 1 glish and the top 8 sentences of news-shuffle and the top 16 of the giga-fren for French). The TM was trained using TED data only. The results show that filtering helps improving the perplexity of the in-domain LM and even that of the unfiltered LM. Comparing the results of the full LM to the filtered counterpart, we observe that perplexity improves from 79.4 to 72.9 for English and BLEU improves from 26.56 to 27.44 on dev and from 24.81 up-to 25.23 on the test set for Arabic-English. For English-French there are only small improvements in perplexity and the resulting translation quality, but, big reduction in the size of the LM is achieved. 5.2. Translation model adaptation results To compare the suggested TM adaptation methods on the Arabic-English task, we set up an SMT baseline system which uses the bilingual TED data for TM training and the best filtered LM from the previous Section. Next, we sort the UN data according to cross-entropy difference of the LM or 1 1 M1 scores, and take 32 , 16 and 18 of the best scoring sentences, which roughly corresponds to 2x,4x and 8x the size of the bilingual TED corpus.
Table 5: Arabic-English combined M1 and LM filtering results: TED+X is a system using TED plus X best sentences filtered from the UN data. system TED +200K +400K +800K TED+UN
dev bleu [%] ter [%] 27.44 54.09 28.42 52.96 28.57 52.81 28.52 52.93 28.60 52.85
test bleu [%] 25.23 25.83 26.07† 26.15† 26.09†
ter[%] 57.27 56.39 56.44 56.59 56.62
The results of the bilingual data filtering for TM training are summarized in Table 4. In this table, we include the dev and test translation scores, alongside the phrase table and English vocabulary sizes, for different portions of additional UN data. For comparison purposes, we add to the table a TED only TM system, a TED+UN (full) system and a UN only system. We note that the in-domain (TED only) system outperforms the out-of-domain system (UN only). Additionally, the full (TED+UN) system outperforms both standalone systems. Moving to the filtered systems, on test, the usage of additional data helps, but the filtering methods generate comparable results. On dev, the picture is slightly different, and LM-based filtering is achieving better results than the M1 counterpart. This might be explained by the number of phrases generated by each method, where LM-based filtering generates about twice as much phrases as M1 filtering, allowing the system to over-fit on the dev set. Another important point to notice is the vocabulary size of the different systems. The LM filtered systems has more than twice the vocabulary size of the M1 systems. For example, for the TED+800K-UN case, the LM-based filtering system has an English vocabulary size of 146K, 2.9 times larger than the 50K vocabulary size of the M1 filtered system. A straightforward step, as suggested in Section 3.3, would be combining both filtering methods, enabling us to produce smaller systems with better results. To optimize the scaling factor α in equation (4), we perform three experiments, setting α to 0.2,0.5,0.8, where the best result on dev was achieved for α = 0.8 (the systems with the other two α values were 0.3% BLEU worse on both dev and test sets). This is the value of α that we use in the rest of our experiments. In Table 5, we summarize the results of the combined filtering. We also include the result of the full (unfiltered) system for comparison purposes. We note that for the test set the results are comparable or better than the individual filtering methods. We also note that with the 400K system, the improvements are statistically significant over the baseline, and comparable to the full size system. For the later system, the English vocabulary size was 61K, and the phrase table size was 32M, reducing the full system vocabulary size by a
Table 4: Arabic-English filtering results: all systems include the TED data, in addition to the number of best sentences filtered from the UN data. The number of phrases relates to the full phrase table. UN sentences
Phrases
0.0M (TED only) 7.9M (UN only) 8.0M (TED+UN)
6M 381M 387M
200K 400K 800K
22M 38M 72M
200K 400K 800K
12M 22M 44M
English dev Vocabulary bleu [%] ter [%] Without filtering 34K 27.44 54.09 411K 25.35 57.17 418K 28.60 52.85 LM-based filtering 74K 28.41 53.04 103K 28.71 52.58 146K 28.67 52.90 M1-based filtering 35K 27.89 53.48 39K 28.08 53.36 50K 28.21 53.07
Table 6: Comparison of the three bilingual data filtering methods on the English-French data. For each method, 800K sentences are selected from the giga-fren data. system TED giga-enfr TED+giga-fren LM filtering M1 filtering Combined
dev bleu [%] ter [%] 25.97 58.42 25.50 58.93 25.94 58.44 26.45 57.83 26.54 57.67 26.70 57.48
test bleu [%] 29.59 28.00 28.55 29.97 30.19 30.27
ter[%] 52.02 53.44 53.33 51.62 51.34 51.23
factor of 7 and the phrase table size by a factor of 12. To confirm our results, we conduct some final experiments on the English-to-French task. Our baseline system is trained on TED data only. For the three different data selection methods, we select 800k sentences from the giga-fren data, which are added to the TED data for TM training. Another system is built on the full TED and giga-fren corpus. The results are given in Table 6. Different from the Arabicto-English task, adding the full out-of-domain corpus to the training data hurts performance rather than improving it. Selecting data with any of the three method yields improvements of at least 0.4 BLEU on both dev and test. Here, using M1 cross-entropy for filtering yields slightly better results than using the LM cross-entropy. The combination of the two gives another small improvement, reaching 0.7 BLEU over the baseline on both dev and test. The resulting phrase tables contain 921K phrases for the TED data only, 3.9M for the combined selection method and 10.3M for the full TED+giga-fren data. The corresponding target vocabulary
test bleu [%] ter[%] 25.23 21.36 26.09
57.27 62.53 56.62
25.67 25.74 25.94
56.68 56.69 56.97
25.46 25.79 25.71
56.92 56.43 56.68
sizes are 29.2K, 59.7K and 215K, respectively. These numbers refer to the phrase tables filtered on dev and test. 5.3. Manual analysis In terms of automatic evaluation measures, the experimental results show the advantages of LM-filtering for LM modeling and combined LM and M1 filtering for TM modeling. In this section, we concentrate on analyzing and comparing the differences between M1 and LM based filtering for the purpose of TM training. We analyze some additional statistics of the generated models and take a closer look at their preferred lexical choices. As already seen in Table 4, the phrase tables resulting from the LM-based filtering are consistently larger than the corresponding M1 filtered tables. This is due to the M1 filtering preferring both shorter sentences and more dense alignments compared with LM-based filtering. For the Arabic-toEnglish 400K M1-based selection, the average source sentence length is 19 words, for the LM-based counterpart it is 24. The corresponding alignment densities (the number of the generated alignment links out of the number of all possible alignment links) are 3.71% for M1 selection and 2.94% for LM selection. For the English-to-French task, we made similar observations. A summary of these characteristic numbers is given in Table 7. Conceptually, M1 and LM scores are very different. While M1 is scoring word pairs of source and target words, the LM is scoring the source and target sentences independently. The advantage of M1-based filtering is that it can identify weakly aligned sentences and give preference to word translations which are domain-specific - two phenomena that can not be captured by the LM-based counterpart. In Table 8, we give an example for each phenomenon. In the first example, a weakly aligned source-target sentence
Table 7: Comparison of average sentence length in number of words and alignment density for 400K M1-based and LMbased filtering. For English-to-French, the number of phrases refers to the phrase table which was filtered for the dev and test sets.
avg. source length avg. target length alignment density # phrases
Arabic-English M1 LM 19 24 19 24 3.71% 2.94% 22M 38M
English-French M1 LM 16 19 18 21 4.42% 3.50% 1.6M 3.5M
pair from the OOD training corpus is ranked high by the LM method, therefore being augmented to the training data. The M1 method captures the weak word-alignment and penalizes the sentence pair such that it is filtered out from the training data. Out of the first (best) 100 LM ranked sentence pairs, 15 were weakly aligned, causing the addition of noise to the phrase table (the best 100 M1 counterpart were correctly aligned). We leave further analysis of the effect of M1 filtering on detecting weakly aligned data to future work. In the second example, the Arabic word ø ñJ �K is usually trans
lated in formal speech to ‘intended’, whereas in informal speech one would usually use ‘going’. Due to the in-domain bilingual filtering performed by M1, the pair ( ø ñJ �K,going) is
scored much higher than ( ø ñJ �K,intended), whereas the oppo
site occurs for the LM-filtered corpus. This allows the M1trained SMT system to make a better, more domain-specific choice of words for the hypothesis it generates.
6. Conclusions In this work, we experimented with cross-entropy based filtering for domain-adaptation. We focused on filtering for two important components in an SMT system, namely the TM and the LM. For LM filtering, we used an LM cross-entropy difference based scoring, where we achieved strong perplexity improvements, confirming results from previous work. In addition, we showed that perplexity improvements carry over to the translation quality, where improvements of up to 0.4% BLEU were observed over a system using the full LM on the Arabic-to-English task. Next, we focused on filtering for TM training. We suggested a new M1 cross-entropy difference based filtering, and compared it to an existing LM-based filtering. We showed comparable translation quality of the M1-based filtering against the LM counterpart, while reducing the vocabulary size by a factor of 3 and the phrase table size by a factor of 2 when using the M1-based filtering. Finally, we interpolated the LM and M1 scores creating a combined scoring method for filtering. The combined method achieved the best results among the three filtering methods, consistently out-
Table 8: Examples showing the advantages of M1-based filtering against LM-based filtering. In the first example (literal translation of the source is given in brackets), M1 ranks low weakly aligned sentences. In the second example, M1filtered corpus generates higher probability for in-domain translations, making a better choice of words for the hypothesis. Source
QêºË@ PAJ�JË@ [the electrical current] ú GAK .
Target LM-rank M1-rank
the standard electricity in bali is 220v . 9th 6380784th
Source
Ѫ¢�� à@ ø ñJ �K Ạ�K ÕË ÉÊ� Y Aë É®£
ÈA®£B@
Ref.
She wasn’t going to vaccinate her kid against polio . It wasn’t intended to feed their children against polio . It wasn’t going to feed their children against polio .
LM-filter M1-filter
performing the two standalone methods for both the Arabicto-English and the English-to-French translation task. For Arabic-to-English, the combined system (TED+400K-UN) is better than the in-domain only system, with +0.9% BLEU significant improvement. The system is comparable to the one using all data, with the vocabulary size reduced by a factor of 7 and the phrase table size reduced by a factor of 12. The results for the English-to-French task are slightly different, where the full system was worse than the in-domain only system. The combined filtering method improved by +0.7% BLEU over the in-domain only system, and by +1.7% over the full one. The vocabulary size is reduced by a factor of 4 and the phrase table size by a factor of 2.5 when compared to the full system. In future work, we plan to compare filtering against sentence weighting, where one needs a mapping of the scores to appropriate weights. We also plan to investigate adaptation for more components of an SMT system, comparing the usage of model-specific scores against other scores or a combination of these. Due to the vocabulary size reduction and comparable translation quality that can be achieved by the suggested filtering, one can utilize more complex modeling techniques using the filtered corpora. For example, discriminative training for SMT purposes is known to suffer from the large vocabulary size which causes infeasible running times and memory consumption. Using filtering, such complex modeling can become applicable with the hope of gaining improvements over the traditional modeling techniques.
7. References [1] P. F. Brown, S. A. Della Pietra, V. J. Della Pietra, and R. L. Mercer, “The mathematics of statistical machine translation: parameter estimation,” Computational Linguistics, vol. 19, no. 2, June 1993, pp. 263–311. [2] N. Ueffing, G. Haffari, and A. Sarkar, “Transductive learning for statistical machine translation,” in ACL. Prague, Czech Republic, June 2007, pp. 25–32. [3] H. Schwenk, “Investigations on large-scale lightlysupervised training for statistical machine translation,” in IWSLT, 2008, pp. 182–189. [4] Y. Lu, J. Huang, and Q. Liu, “Improving statistical machine translation performance by training data selection and optimization,” in EMNLP. Prague, Czech Republic, June 2007, pp. 343–350. [5] P. Koehn and J. Schroeder, “Experiments in domain adaptation for statistical machine translation,” in Proceedings of the Second Workshop on Statistical Machine Translation. Prague, Czech Republic: Association for Computational Linguistics, June 2007, pp. 224–227. [6] J. Gao, J. Goodman, M. Li, and K.-F. Lee, “Toward a unified approach to statistical language modeling for Chinese,” ACM Transactions on Asian Language Information Processing, vol. 1, pp. 3–33, March 2002. [7] R. C. Moore and W. Lewis, “Intelligent selection of language model training data,” in ACL: short papers. Uppsala, Sweden, July 2010, pp. 220–224. [8] S. Matsoukas, A.-V. I. Rosti, and B. Zhang, “Discriminative corpus weight estimation for machine translation,” in EMNLP. Singapore, August 2009, pp. 708–717. [9] G. Foster, C. Goutte, and R. Kuhn, “Discriminative instance weighting for domain adaptation in statistical machine translation,” in EMNLP. Cambridge, MA,, October 2010, pp. 451–459. [10] A. Axelrod, X. He, and J. Gao, “Domain adaptation via pseudo in-domain data selection,” in EMNLP. Edinburgh, Scotland, UK, July 2011, pp. 355–362. [11] F. J. Och, D. Gildea, S. Khudanpur, A. Sarkar, K. Yamada, A. Fraser, S. Kumar, L. Shen, D. Smith, K. Eng, V. Jain, Z. Jin, and D. Radev, “A Smorgasbord of Features for Statistical Machine Translation,” in HLTNAACL, Boston, MA, May 2004, pp. 161–168. [12] F. J. Och and H. Ney, “A Systematic Comparison of Various Statistical Alignment Models,” Computational Linguistics, vol. 29, no. 1, pp. 19–51, Mar. 2003.
[13] R. Roth, O. Rambow, N. Habash, M. Diab, and C. Rudin, “Arabic morphological tagging, diacritization, and lemmatization using lexeme models and feature ranking,” in ACL-HLT: short papers. Columbus, Ohio, June 2008, pp. 117–120. [14] P. Koehn, H. Hoang, A. Birch, C. Callison-Burch, M. Federico, N. Bertoldi, B. Cowan, W. Shen, C. Moran, R. Zens, C. Dyer, O. Bojar, A. Constantine, and E. Herbst, “Moses: Open Source Toolkit for Statistical Machine Translation,” in ACL: Companion Volume Proceedings of the Demo and Poster Sessions, Prague, Czech Republic, June 2007, pp. 177–180. [15] F. J. Och, “Minimum Error Rate Training in Statistical Machine Translation,” in ACL, Sapporo, Japan, July 2003, pp. 160–167. [16] K. Papineni, S. Roukos, T. Ward, and W.-J. Zhu, “Bleu: a Method for Automatic Evaluation of Machine Translation,” in ACL, Philadelphia, Pennsylvania, USA, July 2002, pp. 311–318. [17] M. Snover, B. Dorr, R. Schwartz, L. Micciulla, and J. Makhoul, “A Study of Translation Edit Rate with Targeted Human Annotation,” in Proceedings of the 7th Conference of the Association for Machine Translation in the Americas, Cambridge, Massachusetts, USA, August 2006, pp. 223–231. [18] P. Koehn, “Statistical Significance Tests for Machine Translation Evaluation,” in EMNLP, Barcelona, Spain, July 2004, pp. 388–395.