Oct 29, 2004 - tonomous nature of the current Internet routing protocol, the Border Gateway Protocol (BGP), makes routing suscep- tible to attacks and errors.
Combining Visual and Automated Data Mining for Near-Real-Time Anomaly Detection and Analysis in BGP Soon Tee Teoh, Ke Zhang, Shih-Ming Tseng, Kwan-Liu Ma, S. Felix Wu Department of Computer Science University of California, Davis Davis, CA 95616 {teoh,zhangk1,
smtseng, ma, wu}@cs.ucdavis.edu
ABSTRACT The security of Internet routing is a major concern because attacks and errors can result in data packets not reaching their intended destination and/or falling into the wrong hands. A key step in improving routing security is to analyze and understand it. In the past, we and other researchers have presented various visual-based, statistical-based, and signature-based methods of analyzing Internet routing data. In this paper, we describe an integration of visual and automated data mining methods for discovering and investigating anomalies in Internet routing. We show how these different components are combined in such a way as to complement each other, creating a very effective and useful analysis tool. In addition to performing analysis on archived data, our system is able to collect, process and visualize data in near-real-time.
Categories and Subject Descriptors H.5.2 [Information Interfaces and Presentation]: User Interfaces—Graphical User Interfaces (GUI); I.3.6 [Computer Graphics]: Methodology and Techniques—Interaction Techniques; D.4.6 [Opertating Systems]: Security and Protection
General Terms Human Factors
Keywords information visualization, network visualization, internet routing
1.
INTRODUCTION
Routing is an important part of the Internet infrastructure. It is the mechanism by which a packet gets from its
Permission to make digital or hard copies of all or part of this work for personal or classroom use is granted without fee provided that copies are not made or distributed for profit or commercial advantage and that copies bear this notice and the full citation on the first page. To copy otherwise, to republish, to post on servers or to redistribute to lists, requires prior specific permission and/or a fee. VizSEC/DMSEC’04, October 29, 2004, Washington, DC, USA. Copyright 2004 ACM 1-58113-974-8/04/0010 ...$5.00.
source to its destination correctly. The distributed and autonomous nature of the current Internet routing protocol, the Border Gateway Protocol (BGP), makes routing susceptible to attacks and errors. An important step in improving the security of Internet routing is to analyze its run-time behavior under BGP, to understand its operational dynamics, as well as to discover potential security problems. In the past, we and other researchers have presented various visualbased, statistical-based, and signature-based methods of analyzing Internet routing data. While these methods have produced significant results, we believe that an adequate coupling of visual data mining, statistical data mining and signature detection can perform even better. Our methodology is based on the naturally complementary relationship between visualization and automated computation. On one hand, computers are good at processing a large amount of data, and optimizing the search for welldefined patterns. On the other hand, automated methods often have problems finding the right threshold values. This is where interactive visualization can allow the user to examine the data, and use domain knowledge and judgement to adjust and fine-tune the statistical parameters in order to perform more accurate anomaly detection. The human visual perception system is able to recognize features in visual displays and recall related images to identify anomalies [1]. We use this ability to complement and verify the statistically detected anomalies. In this paper, we describe the system we have built to combine visual and automated data mining for near-real-time anomaly detection and analysis in BGP. We show examples of the way visual and statistical methods work together to detect and characterize anomalies more efficiently and accurately than the individual components can do on their own. Furthermore, visualization also helps in conducting deeper analysis into the root cause of the problem once the anomalies have been statistically determined. Previously, we have been able to visualize and analyze a large amount of archived data [2, 3]. This is important because we want to discover and understand long-term routing behavior. However, near-real-time data mining is also extremely important and useful because errors and attacks need to be detected quickly, so that corrective action can be taken promptly to lessen the damage. We therefore describe the new capabilities we implemented in our system to perform near-real-time data collection, processing and analysis.
2.
THE BORDER GATEWAY PROTOCOL
The Internet can be considered as a network of Autonomous Systems (ASes). These autonomous systems (ASes) entirely manage any traffic within themselves. To communicate between ASes, routers on the edge of an AS use the border gateway protocol (BGP) [4]. In BGP, each AS is assigned a unique identifier and owns a set of IP prefixes. An IP prefix consists of an IP address and a mask. This mask identifies which subset of IP addresses corresponds to hosts in the AS. For example, the IP prefix 128.120.0.0/16 means that every machine in the AS shares the same initial 16 bits 128.120. Using BGP, routers communicate network reachability information in order to properly transmit packets. These BGP routes consist of a list of the ASes through which data can be routed to reach the destination. The BGP route “128.120.0.0/16: (7, 23, 92),” for example, means that packets for the IP prefix 128.120.0.0/16 need to sequentially pass through AS 7 and AS 23 before reaching the AS representing their destination (AS 92). Because of the distributed nature of BGP and the lack of verification of the validity of the announcements, Internet routing is susceptible to errors and attacks. Some router can easily be misconfigured to announce a prefix its AS does not own, and also an attacker can also insert invalid announcements to cause disruption in routing.
3. 3.1
RELATED WORK BGP Routing
BGP routing behavior has received a lot of examination in the research literature. Labovitz et al. [5] showed that unstable and pathological routing behaviors dominated the Internet around 1996. Later, they presented potential explanations for these anomalies [6]. Other BGP routing problems, such as slow convergence [7], and persistent MED oscillation [8, 9], have also been well examined. Rexford et al. defined the metric “BGP event” to measure BGP routing instability and concluded that routes to the popular destinations were generally stable [10]. In order to generate realistic BGP traffic for testing, Maennel et al. extensively studied BGP traffic and characterized the statistical properties of BGP traffic [11].
3.2
Visualization
Previous use of visualization for computer security applications includes Erbacher et al.’s [12] work using glyphs to visual intrusion detection data, Yurcik et al.’s [13] tool for visualizing network traffic, Girardin’s [14] packet-based visualization, Muniandy’s [15] system representing users, machines and other objects as nodes in a network topology graph, and Tudumi [16], a visualization system designed to monitor and audit computer logs to help detect anomalous user activities. Our paper describes the tight integration between visualization and automated methods for anomaly detection. An example of a past integration of visualization and automated methods for a different data mining task is Ankerst et al.’s work [17] on classification. We have also done previous work in visualizing anomalous Origin AS changes in BGP [18]. Of particular relevance to this paper is our routing dynamics visualization system [19], as it is the foundation on which our current system is built.
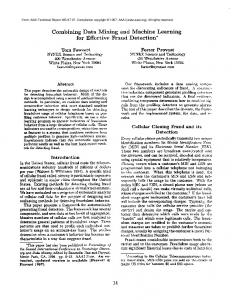
This interactive visualization system allows users to browse through BGP update messages with a slider bar. The update messages are color-coded and drawn according to their timestamp, allowing users to see various patterns. Modules are also provided for visualizing anomalous events matching user-defined signatures, and for visualizing the network topology. Figure 1 shows a screenshot of the visual display.
3.3
Anomaly Detection in BGP
Anomaly detection is widely used in computer security. The basic work-flow of anomaly detection is the following. First, a detection system is fed into the normal model of a subject and is trained to learn the characteristics of the normal behaviors of the subject. Second, the detector examines the testing behaviors and flags an anomaly if the testing behaviors significantly differ from the normal behaviors. Kruegel et al. [20] derived a model of the autonomous system connectivity from BGP routing table and whois database. Route advertisements are checked to make sure that they are consistent with the network topology; otherwise, they are flagged as anomalous route updates. In our previous work [21], we applied statistical-based anomaly detection and signature-based detection to examine BGP updates. We compared these two methods and highlight the difficulties in BGP anomaly detection. As our current system integrates these methods, they are described in more detail in Section 4.
4.
SYSTEM MODULES
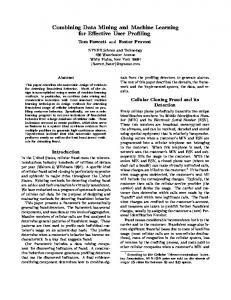
There are four components in our system(Figure 2): (A) Near-real-time Data Collection, (B) Anomaly Detection Engine, (C) Data Server and Communication, and (D) Interactive Visualization Client. In the following sections, we will describe each component in detail.
4.1
Real-time Data Collection
The main function of Real-time Data Collection module is to record raw BGP data for further analysis. There are three different ways to collect these raw BGP data. (i) BGP table dump, (ii) BGP updates, and (iii) Routing table directly from a router. We are able to download (i) and (ii) which are both in MRT format from RouteViews [3] , RIPE [2] and UC Davis. We are able to get (iii) in ASCII format by executing the “show ip bgp” command on a router. In order to get the real-time data, we need a higher recording rate. Typically, those data provided by RouteViews, RIPE and UC Davis are recorded at a frequency of 15 minutes which is not generally considered to be real-time. Hence, we collect our data in a different way. First, we download raw data of (i) and (ii) from RouteViews, RIPE and UC Davis. These downloaded data contain the update messages from several different peers. We need to pre-process the data to keep only the updates from the peers that we are interested in examining. Then, we use a BGP replayer which is originally written by Sharad Agarwal to regenerate all of the BGP traffic in DETERLAB [22]. DETERLAB is a testbed which provides a simulation environment with up to 72 nodes. Not only we are able to replay the real BGP traffic into DETERLAB, but also we are able to inject some malicious traffic and see the impact immediately. Finally, we set up some zebra routers in DETERLAB to
Figure 1: Our previous tool for visualizing BGP update messages. Our current tool extends it to incorporate visualization of statistical measures and signatures, and to enable near-real-time monitoring.
Figure 2: System Overview
serve as observation points. These observation point routers are in charge of dumping and recording raw BGP data every Ti seconds. We are able to set those routers to have a higher recording rate to increase the accuracy. Assuming there is one event E happened at time T and the recording interval is Ti seconds. We will have E recorded in the next dump file at time T + x (where 0