Commercialisation of Smallholder Agriculture in Selected Tef-growing Areas of Ethiopia*
Samuel Gebreselassie† and Kay Sharp‡
March 2008
†
Research Fellow, Agriculture and Rural Development Division, Ethiopian Economic Policy Research ‡ Institute (EEPRI), Addis Ababa (
[email protected]); Research Fellow, Rural Policy and Governance Group, Overseas Development Institute, London (
[email protected])
Acknowledgements The authors would like to thank Jennifer Leavy, Steve Wiggins, Colin Poulton and Eva Ludi for comments on various versions of this paper. We are also indebted to the data collectors and data entry clerks, and above all to the farmers of the study areas who generously participated in the surveys.
CONTENTS 1. 1.1. 1.2. 1.3.
Introduction ............................................................................................... 1 Commercialisation(s) in Ethiopia ................................................................. 1 Tef in the Ethiopian economy ....................................................................... 2 Scope of the paper ......................................................................................... 4
2.1. 2.2.
Objectives and methodology .................................................................... 4 Objectives of the study .................................................................................. 4 Sampling and methods .................................................................................. 5
3.1. 3.2 3.3. 3.4
Findings ...................................................................................................... 6 The scale of agricultural commercialisation ................................................. 6 Outcomes of commercialisation .................................................................... 8 Determinants of market participation............................................................ 9 Determinants of output in tef areas.............................................................. 19
4.1. 4.2.
Conclusions .............................................................................................. 22 Summary of survey findings ....................................................................... 22 Policy issues and further research needs ..................................................... 24
2.
3.
4.
References. .................................................................................................................. 25 Annex 1: Conversion factors for household size and labour-force ....................... 27
TABLES AND FIGURES Table 1: Commodity choice - characteristics of coffee and tef .......................................... 2 Table 2: Survey respondents by gender of household head ................................................ 5 Table 3: Welfare outcomes among farmers at different levels of commercialisation ........ 8 Table 4: Characteristics of market participants and non-participants ............................... 11 Table 5: The degree of market participation of sampled households ............................... 14 Table 6: Determinants of the degree of participation in output market ............................ 17 Table 7: Determinants of output in selected tef growing areas ........................................ 21 Figure 1: Proportion of output sold..................................................................................... 6 Figure 2: The relationship between crop value produced and sold .................................... 8 Figure 3. Scatter plot of value sold against value produced ............................................ 12 Box 1: Trade-production relationship among sampled households .................................... 7
1.
Introduction
1.1.
Commercialisation(s) in Ethiopia
The poverty-reduction strategy adopted by Ethiopia seeks to achieve growth through the commercialisation of smallholder agriculture. The Plan for Accelerated and Sustainable Development to End Poverty (PASDEP), Ethiopia‟s strategic framework for 2005/06 – 2009/10, relies on a massive push to accelerate growth. This is to be achieved by efforts in two directions: commercialisation of agriculture, based on supporting the intensification of marketable farm products (both for domestic and export markets, and by both small and large farmers); and promoting much more rapid non-farm private sector growth (MoFED, 2005). This study aims to contribute to this plan by identifying factors that can deepen and expand the scope of market participation of smallholders. Commercialisation of agriculture is also a core research theme of the Future Agricultures Consortium. Future Agricultures‟ thematic work on agricultural commercialisation has observed that, in various countries, different modes of commercialisation co-exist and interact with each other (Leavy and Poulton 2007:17): hence the plural term, commercialisations. In Ethiopia, we suggest that the following existing categories of farmer could benefit from enhanced commercialisation (or “market-oriented agricultural growth”). These four categories represent four potentially complementary “pathways” for commercialisation policy. 1. Smallholder family farms (Type A) Farmers in remote, drought-prone or low-potential areas, generally regarded as “subsistence-oriented” but in fact interacting with markets both as buyers and as sellers. The policy challenge posed by these farmers is to improve their terms of engagement with markets, as well as raising productivity and diversifying livelihoods. (Type B) Small farmers who are already market-oriented, producing crops partly or wholly for sale alongside crops for their own consumption. Such farmers tend to be in locations with favourable growing and marketing conditions, and tend to focus on specific high-value commodities. 2. Small investor-farmers Individuals or small groups of partners, often educated and urban-based; sometimes agricultural professionals with a background in government or development agencies or former state farms; often investing in farming as a secondary activity. These farmers are referred to in World Bank terminology as “emerging commercial farmers”, suggesting an expected linear trajectory towards larger-scale agri-business. However, we suggest that they are in fact a separate category. In Ethiopia they have started to re-emerge only in the last few years, when access to land for such investments has been made possible. 3. Large-scale “agri-business” These are generally capital-intensive enterprises (though they also generate employment), and may be either private or state-owned. Examples are the large
1
export-oriented horticulture and floriculture ventures that have multiplied in Ethiopia in recent years. The empirical research reported in this paper focuses on the “Type B” smallholders, that is farming households who are established growers of highly marketable crops, in areas already well-linked to markets. Two commodities were selected for the study: coffee and tef. Both are important to the national economy, and both are grown and marketed by millions of smallholders. As summarised in Table 1, the two commodities have both similar and contrasting characteristics. Both are labour-intensive crops with seasonal labour-demand peaks, met partly by migrant workers. Both are produced primarily by smallholders (although there are also a few large enterprises growing coffee). Both commodities command export as well as domestic markets, although tef has been primarily a domestic product in the past while coffee is a major national export. Most obviously, tef is both a food and a cash crop, and is therefore fungible either for farm consumption or sale. Coffee, by contrast, is a non-food crop grown primarily for the market. Table 1: Commodity choice - characteristics of coffee and tef Coffee
Tef
Non-food
Food (high value)
Primarily export market
Primarily domestic market
High policy attention & intervention *
Limited policy attention & intervention* (until recent years)
Large and small scale production
Small-scale production
Productivity strategy: niche markets (speciality and organic), low chemical inputs
Productivity strategy: intensification through purchased inputs (fertiliser and seeds)
Labour intensive with seasonal labour bottlenecks New institutions: Co-operatives and Unions * i.e. research and development, market support and control, etc.
This paper reports the findings from tef-producing areas. 1.2.
Tef in the Ethiopian economy
Tef (eragrostis tef) is a nutritious small-grained cereal, related to millet, which originates in Ethiopia and is thought to have been domesticated by Ethiopian farmers between 3 and 6 millennia ago. It fetches the highest market price of any food grain in Ethiopia and is the preferred staple cereal for the majority of consumers, both urban and rural. Enjera (a 2
thin, pancake-like bread), the traditional national food and still the daily staple for most of the population, requires tef flour.1 Tef is particularly interesting in the context of smallholder commercialisation and food security, since it has high value as both a cash and a food crop. Many poorer farmers with suitable land grow it almost entirely for sale, using the proceeds to buy cheaper staples; although, as they become more prosperous, they may retain more for their own consumption. It is grown entirely by smallholders, and has been actively marketed for many generations. Until recently its market was almost wholly domestic, within Ethiopia (and formerly Eritrea): however, a promising niche export market is now developing in Europe and America, based on tef‟s increasing reputation as a “super-grain”, being gluten-free and high in protein and calcium as well as micronutrients such as iron and B vitamins. A Dutch website is currently marketing it (under a profit-sharing contract with the Ethiopian authorities) as “the grain that makes you stronger”. It thus has potential to contribute to the PASDEP goal of export diversification, as well as raising food production and farmers‟ incomes. Farmers' preference for growing tef is due to production characteristics as well as consumer demand. The crop has a wide altitude range, and its resistance to diverse biotic and abiotic stresses makes it "low-risk" for cultivation (Hailu et al., 2000). It also stores well, since the very small size of the grain makes it resistant to post-harvest damage by insects. Among Ethiopia‟s 11.3 million small grain farmers, about 46% (5.2 million) grew tef in 2005/06 (CSA, 2006). This makes tef the second most widely-grown annual crop after maize, which was cultivated by 6.8 million farmers. During the same year, tef was grown on over 2.24 million hectares which is a little over one fifth (21%) of the total land planted to grains. The average farmer cultivated tef on 0.43 hectare, on which he or she produced 4.2 quintals 2, implying an average yield of 9.8 quintals per hectare. The national production of tef has increased tremendously over the last twenty years, from 11.8 to 21.8 million quintals (a rise of nearly 85%). However, this encouraging performance must be interpreted in the context of high population growth and poor conditions in the base year. Per capita production grew by only 23% (1.9% per year) over the same period, and has never exceeded 30 kg. 3 It is also a matter of concern that most (64%) of the growth in production is attributable to area expansion, while improved yields contributed only 12%. 4 This indicates the enormous difficulty of achieving broadbased agricultural productivity growth, which is critical to lift the majority out of poverty. Moreover, yield-induced growth in production is essential to allow agriculture to release land for increasingly important but competing activities such as urban and industrial development, and to prevent agriculture from expanding into forest and other unsuitable land (a threat to the long-term sustainability of the farming system). 1
2 3 4
In lean times and in poorer households, tef is often eked out by mixing it with cheaper grains. However, some proportion of tef is essential for the proper fermentation of the enjera batter. 1 quintal (Qt) = 100 kg. Per capita national production of all grains was 183 kilogram in the same year (2005/06). This is despite the availability of tested tef technologies (seed varieties) that could double the existing yield level. The Ethiopian Agricultural Research Institute reported the existence of high yielding varieties even in 2000. There are tef varieties (like DZ-01-974, DZ-01-354 and DZ-Cr-37) which can yield up to 28 quintals under farm conditions and 32 to 46 quintals under experimental conditions. This exceeds the recent best performance (9.7 quintals) by over 3 times (Hailu et al., 2000).
3
In the current policy push for smallholder commercialisation, tef is one of the selected priority crops under the Ministry of Agriculture and Rural Development‟s 2004 master plan for enhanced market-oriented production.5 Government support to producers, in terms of agricultural extension services, has grown substantially in recent years: in 2005/06 a little over one million tef growers (21% of the total) participated in the extension programme and received free technical advice as well as guaranteed access to modern farm inputs such as fertilizers, herbicides and improved seeds. In terms of area, 560,000 hectares (25% of the total area planted with tef) was under the extension programme (CSA, 2006).
1.3.
Scope of the paper
An earlier version of this paper was presented at a parallel session on Commercialisation of Smallholder Agriculture, co-organised by Future Agricultures, at the EEA‟s 2007 Conference on the Ethiopian Economy. It is one of four linked outputs from that session, the other three being: a thematic framework paper discussing the meanings and definitions of commercialisation from conceptual and international perspectives (Leavy and Poulton); a brief overview of the policy context and the different (alternative or complementary) pathways of agricultural commercialisation in Ethiopia (Sharp, Ludi and Samuel); and an empirical paper on smallholder commercialisation in Ethiopia‟s coffee-growing areas, which parallels the present paper (Samuel and Ludi). The paper is structured as follows. Section 2 outlines the methodology and objectives of the study. Section 3 discusses the survey analysis, focusing on household-level commercialisation within the selected study areas. Section 4 concludes with a summary of the key findings and a discussion of their potential policy implications.
2.
Objectives and methodology
2.1.
Objectives of the study
Within the overall purpose of contributing to the understanding of smallholder commercialisation as a means to poverty reduction, the specific objectives of this paper are: (i) to assess the current scale of commercialisation in tef-growing areas, and to detect household and farm characteristics which might explain variation in the level of commercialisation among households; (ii) to investigate the welfare situation of farmers operating at different levels of commercialisation; and
5
The other priority crops in the master plan are wheat, barley, lentil, chickpea, fava and haricot beans, cotton, sesame, coffee and spices. Source: MoARD (FAC key informant interview).
4
(iii)
to identify and analyse the factors that determine the extent of smallholders‟ participation in output markets.
2.2.
Sampling and methods
Four major tef-producing weredas (districts) were purposively selected as the study areas, based on statistical evidence of the dominance of tef in the local farming system. Two of the weredas (Ada‟a Lome and Bacho) were in Oromia Region, and two (Dejen and Enemay) in Amhara Region. Primary data were collected through a household survey and qualitative fieldwork. For the household survey, a stratified two-stage sampling design was employed within each wereda. First, all kebeles (sub-districts) in the selected weredas were listed, and two were randomly selected. Twenty households were then randomly selected from each kebele (giving a target sample size of 160 households in eight communities). Since the study aimed to investigate gender-related disparities in agricultural commercialisation, the sample was stratified by gender of the household head. The actual sample size achieved was 155 households: the distribution by wereda and gender is shown in Table 2 below. Table 2: Survey respondents by gender of household head Wereda
Female
Ada’a Lome Bacho Dejen Enemay Total
Male 10 4 1 5 20
Total
28 38 35 39 40 41 32 37 135 N=155
% FHH 26% 10% 2% 14% 13%
A structured household questionnaire was used to collect quantitative data on production, consumption, and marketing of farm produce, as well as demographics, resource ownership, and off-farm activities. The survey was carried out in 2006, and collected data on the preceding agricultural year (the 1997/98 E.C.6 production cycle, i.e. March 2005 to February 2006). Both descriptive and econometric methods were used to analyse these household data. Descriptive methods including measures of average and a one-way ANOVA (analysis of variance) were employed to disclose the scale of commercialisation of agriculture and to test the existence of any statistically verifiable difference among farmers operating at different levels of commercialisation. Results from the discrete one-way analysis were further examined through multivariate regression models which helped to predict the determinants and outcomes of commercialisation. Following preliminary analysis of the survey data, an exploratory qualitative study was conducted in one of the surveyed tef weredas, Ada‟a Lome, in February 2007 (towards the end of the marketing season for tef). This wereda was chosen from among the study 6
Ethiopian Calendar
5
areas on grounds of logistics and accessibility, in order to maximise the time spent in field research. The methods used were key informant interviews, semi-structured focus group discussions and individual case interviews. Interviewees and focus group members were identified through local contacts, based on purposive criteria including age, gender, farming experience, and engagement in livelihood activities such as trade and wage labour. The overall purpose of the qualitative work was to investigate some questions raised by the survey, and to identify any important issues which had not been captured by the questionnaire (with a view to possible further research).
3.
Findings
3.1.
The scale of agricultural commercialisation
The survey data indicate that the average farm household in the four weredas sold a little over 49% of their total crop output (in value terms). A slight majority (about 58%) consumed more than they marketed, while 38% sold more than they consumed and the remaining 4% consumed and marketed an equal proportion of their output. Farmers operating at full commercial level (i.e. those who sold 100% of their production) constitute 5% of the sample, while another 7% operated at full subsistence level (i.e. consumed 100% of their production). About half of the surveyed farmers marketed less than 42% of what they produced. If we consider a farmer who marketed at least 50% of his or her output as commercially-oriented, then 40% of the sample could be so classified. Figure 1 shows the degree of commercialisation by centile of households. Figure 1: Proportion of output sold Proportion of output sold (%) 100 80 60 40 20 0 10
25
40
50
60
75
90
95
Farm ers (centile)
In general, these data indicate that the level of commercialisation in the study areas is considerably higher than the national average. 7 This is as expected, given the purposive selection of areas renowned for the production of tef (a highly-marketed commodity) and 7
According to Gebremeskel et al. (1998) only 28 percent of the total national grain production (cereals, pulses and oilseeds) was marketed in 1996. A more recent study by the Ethiopian Economic Association in 2004, however, found that grain farmers who participated in the recent extension programme marketed on average about 33% of their output (5.7 quintals), while non-participants marketed 36% (4.7 quintals). These figures indicate the gross amount sold, without adjusting for any quantities of grain that farmers might have purchased towards the end of the cropping season.
6
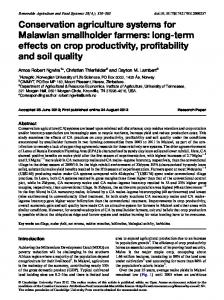
with good access to major markets. Despite this relatively high degree of market participation, the market size (in terms of the volume of transaction per seller) is thin. Fifty-seven percent of sampled households sold farm produce worth 2,000 Birr (about US$ 222)8 or less, while the average farmer sold only 933 Birr‟s worth of produce. Fewer than a quarter (23%) of farmers sold produce worth 3,500 Birr or above. The marketed commodities were mainly tef, chickpeas and wheat. As the grain market is characterised by many small sellers, competition among farmers is likely to be fierce. This problem arises mainly due to low per capita production, as confirmed by a single-equation regression model specifying trade as a function of production (see Box 1). The model indicates a significant and positive association between production and trade (both measured in value terms). The regression coefficient of 0.81 shows that for a unit increase in the value of production, earnings from trade rise by 0.81. The high coefficient of determination (r2=0.63) also shows that about 63% of the variation in trade was explained by the volume of production, keeping other factors constant. Box 1: Trade-production relationship among sampled households
Yi = -79 + 0.81Xi
P = (0.93) (0.00)
t = (0.12)
R2 =0.63
(16.23)*
In general, econometric evidence suggests that the higher the level of production the higher will be the probability of farmers engaging in commercially-oriented agriculture. However, a simple correlation analysis suggests that the more a farmer sold, the lower the proportion of output marketed (r=0.12 or r2=0.1). In other words, as the volume of marketed output increases the volume of output consumed on the farm also increases, but by a higher proportion. This finding, from cross-sectional analysis of households in a given period, is paralleled by observations from the qualitative fieldwork about the pattern of change over time. Farmers in Ada‟a Lome observed that both production and marketing of grain crops have risen over the last decade or so, but that the volume marketed has risen less than the volume produced. For tef in particular, they considered this increase in home consumption of farm produce to be a sign of rising prosperity: “Before, we used to mix chickpeas, wheat, or sorghum for enjera, but now this has almost stopped – people here eat tef. Because of the increased production and better standard of living, people don‟t have to eat these inferior mixtures.” [Interview with Kebele Chairman] This type of relationship between marketed and consumed production is not unusual in a farming system dominated by poor smallholders. The potential tensions and synergies between commercialisation and food security for small farmers are particularly important, and deserve further investigation.
8
US$1 = approx. 9 Birr.
7
Figure 2: The relationship between crop value produced and sold 16000
Birr
12000 8000 4000 0 Value of crop produced (Br.) Value of crop s old (Br.)
10
25
40
50
60
75
200
1800
3300
3975
4530
6810
90
770
1400
1620
2050
3050
90
95
10720 15610 5640
9155
Farm ers (centile)
3.2
Outcomes of commercialisation
Commercialisation of agriculture is not an end for farmers, but an intermediate outcome on the way to welfare goals. In the study, smallholders‟ welfare is represented in terms of consumption of basic food (grains), high-value foods (livestock products) and expenditure on clothes and shoes, durable goods, education and healthcare. Agricultural productivity is also considered as an intermediate outcome which farmers aim to improve through greater engagement in output markets. Table 3: Welfare outcomes among farmers at different levels of commercialisation
Consumption of basic food (Br/person/week) Consumption of high-value food (Br/person/week) Share of purchased food Annual expenditure on clothes and shoes (Br) Annual expenditure on durable goods (Br) Expenditure on education (Br/person/annum) Expenditure on healthcare (Br/person/annum) Land productivity (Br/hectare) Labour productivity (Br/person-day) N
Degree of commercialisation High Low Medium ( F = 0.0000), implying that all instruments are exogenous. But the Sargan or J-test with a computed chi-square (12.33) exceeding the critical chi-square indicates that at least one instrument is correlated with the error term. A systematic procedure identified household labour size as the variable which had a high degree of correlation with the error term. The chi-square was 1.478, which is lower than the critical chi-square either at 1%, 5% or 10%. The model estimation procedure continued with the remaining variables. As the name suggests, in the 2SLS two OLS regressions were run to obtain the parameter estimates. The first stage estimates what is called a „reduced form‟ relationship to obtain the predicted values and the second stage estimates the „structural‟ relationship where the endogenous variable was replaced by the predicted values. By forming predictions for output produced (x) in the second stage through the instruments z we corrected for the correlation between the error term and output produced (x). The actual estimation, however, was not performed in two steps. Modern econometric software (in this case Stata version 9) allows the whole procedure to be estimated in one step. Yi = ai + 1Z 1,t + ….. + T = 1,…..,T
1X 1,t +…..
+ ui
(2)
where Z indicates the six instrumental variables and X the explanatory variables which are as defined in equation 1. Table 6 presents estimates from this (2SLS) regression model. The model was run for all weredas together and then separately for each wereda after testing whether these four weredas actually represent four distinct samples14. Table 6: Determinants of the degree of participation in output market
Size of output produced15 Farm gate price (lagged variable) Household market dependence for food
All Sample Weredas weredas Ada‟a Bacho Dejen Enemai 0.67 0.81 0.57 0.44 0.36 (13.3)*** (13.61)*** (7.60)*** (3.16)*** (2.2)8** 0.01 1.72 0.01 0.14 0.32 (0.04) (0.97) (0.09) (0.07) (0.12) -16.11 -48.71 -8.47 -2.55 -16.39 (2.21)** (3.93)*** (0.59) (0.18) (0.71)
14 A chow test was carried out to see whether or not we do indeed have four different samples, as the significant variables on the location dummies would suggest. An insignificant F-statistic on the hypothesis testing the equality of these coefficients shows that the four areas do indeed represent four different samples. 15 This variable was instrumented by land, ox power, farm expenditure on inputs such as fertilizer, age, sex and literacy of farm household head as discussed above. Labour was a relevant instrumental variable but was not considered as it was found to be correlated with the structural error term.
17
Participation in non-farm activities Income from non-farm sources (per capita income) Specialization in major cash crop (tef) Ada‟a dummy Bacho dummy Dejen dummy Constant N R-square Adj R-squared
-277.39 (0.72) -0.93 (1.87)* 10.25 (1.74)* 486.00 (1.11) 874.31 (2.21)** 177.72 (0.54) 1176.09 (1.40) 112 0.81 0.79
-70.99 (0.07)
119.73 (0.15)
-1.85 (3.12)*** 26.43 (2.38)**
37.14 (1.62) 23.91 (0.179)*
0.39 (0.13) 2.55 (0.18)
1291.42 (1.50) 0.11 (0.06) 17.04 (0.95)
3478.01 (2.13)** 29 0.93 0.91
512.27 (0.22) 27 0.85 0.81
457.20 (0.23) 33 0.56 0.43
1343.21 0.51 25 0.62 0.48
Model results As reported in Table 6, the explanatory variables affect the degree of market participation of sampled households differently. The regression for all weredas indicates that the size of farm production and farmers‟ specialization in tef (the major cash crop) had a positive and significant impact on the degree of market participation, measured in terms of the amount of income from marketing. On the other hand, the effect of household food selfsufficiency was negative. This implies that households with a high dependence on markets for their food access also participate more in output markets. In other words, their participation in commodity markets is high both as sellers and buyers. The quantity of farm production has a positive effect on the quantity supplied to market, conforming to prior expectation. The impact of non-farm activities is mixed. While the coefficient for farmers‟ participation in non-farm activities was statistically insignificant, the coefficient for income from these activities was negative and significant. These results imply that participation in non-farm activities alone is not sufficient to have any impact on a farmer‟s market participation (as a seller). However, as farmers earn more from non-farm sources, they are likely to sell less of their farm output. In other words, the likelihood of on-farm consumption of own products increases as farmers obtain more cash from non-farm sources. This finding supports the first of the competing hypotheses outlined above. The invalidity, in this case, of the alternative hypothesis (that non-farm incomes enable farmers to sell more of their crops because they can buy food on the market) may indicate problems or risks in food markets: farmers may not be confident of buying food easily when they need it. Except for Ada‟a wereda, regression estimates indicate only weak explanatory power of
18
most of the aforementioned variables. The exceptions are the size of farm production (which was consistently significant and positive in each regression model run for all sample weredas), and farmers‟ specialization in tef (which was positive and significant in Bacho Wereda). The exceptionality of Ada‟a is likely to be associated with its easy access to major markets and non-farm employment (due to its closeness to major industrial locations).
3.4 Determinants of output in tef areas As the quantity or value of output produced was found to be very important in determining both market entry and the degree of market participation across all sampled weredas, it is important to investigate separately the factors affecting the volume of farm output. To estimate the determinants of farm output, the Cobb-Douglas (C-D) production function was employed. The C-D function is a multivariate nonlinear relationship between outputs (production) and inputs used in the production process. The C-D model enables us to transform the original non-linear relationship between output and inputs into a linear form that can be estimated within the framework of the classical linear regression model. The C-D production function, in its stochastic form, may be expressed as Yi = β1Xi βiZiαieµi
(1)
Where Y is farm output expressed in terms of the value; Xi is a vector of physical inputs including land, labour and ox (draught) power; Zi is a vector of other factors that affect a farmer‟s work (such as age, sex, engagement in the land rental market, and off-farm activities); and u, e and βi are the stochastic disturbance term, the base of natural logarithm and the parameters to be estimated, respectively. Equation 1 is non-linear, but if we log-transform this model, we obtain16 lnYi = ln β1 + βi lnXi + αi lnZi + µi = β0 + βi lnXi + αi lnZi + µi where β0 = β1
(2)
Thus, equation 1 is non-linear in the variables Y, X and Z, but linear in the log of these variables. Thus, the model is linear in the parameters βi and αi, and is, therefore, a linear regression model. The properties of the C-D function are quite well known: βi and αi are partial elasticity of output with respect to physical and non-physical inputs such as age and sex. The sum of the parameters βi and αi gives information about the response of output to a proportionate change in the inputs. 16
This model building is adopted from Gujarati (2003).
19
The independent or exogenous variables that are expected to affect the level of production are broadly classified into four groups: 1. Conventional or physical inputs, including land, labour and draught (ox) power for ploughing. Non-conventional inputs, classified into: 2. Factors affecting the quality or effectiveness of the physical inputs, mainly farm labour. These include literacy, age and sex of the household head who is assumed to act as manager of the farm 17. While sex and farmers‟ literacy were measured as dummy variables, the age of the farm manager (household head) is a continuous variable. 3. The use of modern farm inputs such as fertilizers, improved seeds and pesticides (measured by cash expenditure on the purchase and transport of these inputs). 4. Area dummies – included to capture the effects of living in a given wereda when compared to the other three weredas. The results of the regression model are reported in Table 7. The first column presents the estimate of the simple CD production function in which only physical inputs are included. Land and oxen, which could also be used as proxies for capital stock, are found to be important in explaining the variation in the level of production among sampled households. The coefficient for land is statistically significant at 1%, while the coefficient for oxen ownership is relatively high but significant only at the 5% level. Cash expenditure on inputs such as fertilizer, pesticides, and peak-season hired labour also significantly affects the total value of farm output. All three location dummies were significant, albeit with some differences in the level of significance. This implies a marginal difference in the effect of living in a specific wereda compared to the other three weredas. Farmers living in Ada‟a district, which is nationally famous for the quality of its tef and has the best access to major urban markets including Addis Abeba, gained the most significant location-related benefit. Among the personal characteristics of the farm manager (usually the head of the household), age and sex were insignificant in explaining the observed variation in the level of farm output. However, the coefficient for literacy of the household head is positive and significant, which implies a high probability of better production among farm households with an educated head (compared to households with illiterate heads). Participation in the credit market (defined as having received a loan of 100 Birr or more) also appears to play a significant role in enhancing the level of farm production.
17
These are not the only factors to affect the quality or efficiency of labour. Others important but not considered for lack of data are farmers’ access to information, health centres or electric power etc. Similarly, differences in the quality of farm land were not considered.
20
Table 7: Determinants of output in selected tef growing areas
Physical inputs and location dummies (column 1)
Constant ln (land) ln (labour) ln (oxen) logcvpfi18 Ada‟a dummy Dejen dummy Enemay dummy logage Sex (dummy) Head education (dummy) Participation in credit market (dummy)
Coefficient t-statistics 4.182 3.42*** 0.525 1.89* 0.356 1.65* 0.004 0.05 0.202 1.70* 0.976 3.08*** 0.722 2.22** 0.654 2.23**
Column 1 plus the nature of farm manager, and participation in credit market (column 2) Coefficient t-statistics 3.526 1.91 0.526 1.86* 0.294 1.35* 0.011 0.12 0.164 1.35 1.105 3.33*** 0.709 2.17** 0.635 2.15** 0.204 0.50 0.221 0.67 0.374 1.63* 0.479 2.08**
F( 7, 124) = 4.72 Prob > F = 0.0001 R-squared = 0.5203 Adj R-squared = 0.4725
F( 10, 120) = Prob > F = R-squared = Adj R-squared =
3.66 0.0003 0.5514 0.4962
*, **, *** indicate significance level at 10%, 5% and 1% respectively.
As indicated earlier, our intention in modelling the production function is principally not to identify the factors affecting farm production, but to uncover additional factors having an indirect effect on farmers‟ marketing decisions. The assumption is that any variable affecting farm output will also affect farmers‟ participation in output markets, as our analysis shows that the former significantly explains the latter. There is strong evidence for the positive effect of improved access to factors of production (agricultural land, peak season labour and draught power) as well as working capital for the purchase of inputs on farmers‟ marketing decisions. Similarly, the positive effect of participation in financial markets suggests the importance of credit in helping to boost production, and, consequently, smallholders‟ participation in output markets.
18
Cvpfi represents cash expenditure for the purchase modern farm inputs (fertilizers, improved seeds and pesticides).
21
4.
Conclusions
4.1.
Summary of survey findings
The degree of agricultural commercialisation The level of commercialisation in the study areas is far higher than the national average. The average farmer sold almost half (49.7%) of his or her crop production in value terms, compared to a national average in 2004 of about 33% (EEA 2006). The degree of commercialisation, however, differs widely across sampled households, which implies a correspondingly wide variation in the potential and constraints for further commercialisation. Therefore, any agricultural commercialisation strategy should be customized for different groups of farmers. Production, consumption and trade Despite the relatively high degree of market orientation in the study areas, the size of market (per seller) is very thin. The volume of trade is constrained by low per capita production. Over 63% of the variation in trade among sampled households is explained by variation in production, keeping other factors constant. Although the amount that farmers supply to the market increases as the volume of production increases, the relationship is far from one-to-one. A simple correlation analysis suggests that the more a farmer sells, the lower the proportion of output marketed (r=0.12 or r2=0.1). In other words, as the volume of marketed output increases the volume of output consumed on the farm also increases but by a higher proportion, so that the degree of commercialisation (measured in terms of the proportion of output sold) actually falls. Commercialisation and farmers’ welfare Commercialisation of agriculture is not an end in itself for farmers, but an intermediate outcome on the way to welfare goals. A two-way analysis was carried out to shed some light on the welfare effects of commercialisation. Some of the findings are: The most commercialised farmers (here defined as those who sold 65% or more of their production) consumed one and a half times as much staple food per capita as the least commercialised (those who sold less than 30%). This difference is statistically significant. Households in the higher commercialisation category also spent more on education and healthcare. Households in the least commercialised category spent on average only 32 Birr per annum on education, while the most commercialised spent more than twice this (about 84 Birr/person/year). This difference is statistically significant at 10%. Agricultural productivity also varies with the level of participation in output markets (although this is not statistically significant). Land productivity increases with the index of commercialisation. Labour productivity is also lowest among the least
22
commercialised category of farmers, but the trend lacks consistency as the index of commercialisation rises. These initial results suggest that commercialisation of smallholder agriculture should be encouraged not only as a means to boost exports and to stimulate or monetize local economies, but also as a way to help smallholders achieve welfare goals. Determinants of market participation About 7% of sampled farmers were not participating in the output markets as sellers. Although it is difficult to run a regression model on such a small sample size, results from a two-way analysis reveal significant differences between market participant and non-participant farmers: Household heads who participated in output markets were found to be younger - 11 years younger, on average – than their non-participant counterparts. This difference is statistically significant. The likelihood of market participation is high among smallholders specializing in the major cash crop, tef. The size of farmland owned and cultivated is very important to farmers‟ participation in output markets. In general, those who did not sell owned small farms (1.1 ha on average, about one-third the size of market participants‟ landholdings). Moreover, non-participant households cultivated only a small proportion of their land: 62% of them rented out a significant part of it (about 85% on average). By contrast, marketparticipant households not only owned more land but also rented in about 22% of their average cultivated area of about 3.8 hectares. All these differences between the two groups are statistically significant. Determinants of the degree of household market participation Regression estimates show that: Both the total value of farm production and the proportion of land allocated to tef (the major cash crop) had a positive and significant impact on a household‟s degree of market participation, measured in terms of gross income from crop sales. The effect of household self-sufficiency in food (measured as the percentage of consumption that is self-produced) was negative. This implies that households who depend more on the market for their food access also participate more in output markets. In other words, their participation in food markets is high both as sellers and buyers. The impact of non-farm activities on market participation is mixed. While the coefficient for farmers‟ participation in non-farm activities was statistically insignificant, the coefficient for income from these activities was negative and significant. These results imply that participation in non-farm activities alone is not sufficient to impact on a farmer‟s market participation (as a seller). However, the level of income from non-farm sources does impact on market participation. The likelihood of lower crop sales and higher on-farm consumption increases as 23
farmers obtain more cash from non-farm sources. This finding disproves (in this case) the alternative hypothesis that non-farm income encourages farmers to sell more of their crops and rely on market purchases for their food access.
4.2.
Policy issues and further research needs
The findings of this study broadly support the PASDEP‟s dual strategy of increasing agricultural commercialisation while promoting non-farm economic growth. Higher levels of household commercialisation appear to be associated with better standards of welfare (including food consumption), confirming that smallholders can benefit directly from greater engagement with markets. At the same time, a minority of farmers even in these relatively commercialised areas are leading marginal and largely subsistenceoriented farming livelihoods, supplementing their production income through renting out land. Combined with the finding that higher non-farm incomes are associated with lower agricultural commercialisation, this underlines the importance of developing sources of non-farm employment alongside intensification of agriculture, in order to provide favourable conditions of exit from farming for some less productive farmers and landless youth. The suggested direction of change is towards a more diversified rural economy, aiming for higher returns from agriculture alongside a wider range of local income and livelihood options. Land size and means of accessing land emerge, not surprisingly, as critical factors in household-level commercialisation. The survey findings show that there is a very active land rental market in the tef-producing areas, and the qualitative discussions in Ada‟a highlighted both an absolute shortage of land and a rapid rise in rental prices. An open and well-regulated rental market is essential to ensure both adequate land access for commercialising farmers and a secure income for those (mostly poorer) landowners who are renting out their fields. Further research into the factors that lead some farmers to stay in agriculture while not engaging with output markets would be useful. For example, given the finding that nonmarket participants are older, is this a lifecycle effect (meaning that the current generation of young farmers may also withdraw from marketing when they are older), or a generational shift? Would these farmers want to move out of agriculture if better options were available? Investigating such questions could assist policy makers in designing strategies to improve currently precarious farming livelihoods, while facilitating a smooth exit from farming for those who wish to take it. It should of course be borne in mind that the study areas are not, and were not intended to be, “typical” or representative of the very varied Ethiopian smallholder sector. The findings presented here will not necessarily hold true in other areas or other farming systems, where conditions and opportunities may be very different. Continuing research into commercialisation(s) in Ethiopia should take careful account of relevant geographical factors, and of the various potential commercialisation pathways for different categories of farmer.
24
References Befekadu Degefe and Berhanu Nega (eds) (2000). Annual Report on the Ethiopian Economy. Vol I. 1999/2000. The Ethiopian Economic Association. Addis Ababa, Ethiopia. Byerlee, Derek, Xinshen Diao and Chris Jackson (2005). Agriculture, Rural Development and Pro-poor growth. Country Experiences in the post-reform era. Agriculture and Rural Development Discussion Paper 21. The World Bank. CSA (2006a). Agricultural Sample Survey 2005/2006: Report on Area and Production of Crops. Vol. I, Statistical Bulletin 361. Central Statistical Agency, Addis Ababa, Ethiopia. CSA (2006b). Agricultural Sample Survey 2005/2006, Vol.II, Statistical Bulletin 361. Central Statistical Agency Addis Ababa, Ethiopia. EEA (2002). Second Annual Report on the Ethiopian Economy. The Ethiopian Economic Association. Addis Ababa, Ethiopia. EEA (2004): Report on the Ethiopian Economy. Vol. III, 2003/04, Addis Abeba, Ethiopia. EEA (2005). Report on the Ethiopian Economy. Vol. IV, 2004/05, Addis Abeba, Ethiopia. EEA (2006). Evaluation of the Ethiopian Agricultural Extension with Particular Emphasis on the Participatory Demonstration and Training Extension System (PADETES), Addis Abeba, Ethiopia. Eleni Gabre-Madhin and Tadesse Mezgebou (2006). Prices and Volatility in the Ethiopian Grain Market. Paper submitted for ESSP Policy Conference 2006. Ethiopia Strategy Support ProgramProgramme. International Food Policy Research Institute and Ethiopian Development Research Institute. Addis Ababa, Ethiopia. FDRE (2006). Plan for Accelerated and Sustained Development to End Poverty (PASDEP). Federal Democratic Republic of Ethiopia, Ministry of Finance and Economic Development, Addis Ababa. Gebremeskel Dessalegn, T.S. Jayne and J.D. Shaffer (1998). Market Structure, Conduct and Performance: Constraints on Performance of Ethiopian Grain Markets. Working Paper 8, Grain Market Research Project, Ministry of Economic Development and Cooperation, Januray 1998, Addis Abeba. Govereh, J. and T.S. Jayne (1999). The Effects of Cash Crop Production on Food Crop Productivity in Zimbabwe: Synergies or Trade-offs? Policy Synthesis Number 40. Michigan State University http://aec.msu.edu/fs2/polsyn/No40.htm Gujarati, Damodar N. (2003). Basic Econometrics. Fourth Edition. Tata McGraw-Hill Publishing Company Limited, New Delhi, India The McGraw-Hill Companies, Inc. Hailu Tefera and Seifu Ketema (2000). Production and Importance of Tef in Ethiopian Agriculture. In: Hailu Tefera, Getachew Belay and Mark Sorrells (eds) (2000). Narrowing the Rift: Tef Research and Development. Proceedings of the International Workshop on Tef Genetics and Improvement, Debrezeit, Ethiopia. 16-19 October 2000. Ethiopian Agricultural Research Organization, Addis Ababa, Ethiopia.
25
Hailu Tefera, Getachew Belay and Mark Sorrells (eds) (2000). Narrowing the Rift: Tef Research and Development. Proceedings of the International Workshop on Tef Genetics and Improvement, Debrezeit, Ethiopia. 16-19 October 2000. Ethiopian Agricultural Research Organization, Addis Ababa, Ethiopia. Kenea Yadeta, Gezahegn Ayele and Workneh Negatu (2000). Farming Systems Research on Tef: Smallholders‟ Production Practices. In: Hailu Tefera, Getachew Belay and Mark Sorrells (eds) (2000). Narrowing the Rift: Tef Research and Development. Proceedings of the International Workshop on Tef Genetics and Improvement, Debrezeit, Ethiopia. 16-19 October 2000. Ethiopian Agricultural Research Organization, Addis Ababa, Ethiopia. Leavy, J. and C. Poulton (2007). Commercialisations in Agriculture: a Typology. Paper presented at the Fifth International Conference on the Ethiopian Economy, EEA, June 2007, Addis Ababa. www.future-agricultures.org Lerman, Zvi (2004). Policies and institutions for commercializationcommercialisation of subsistence farm s in transition countries. Department of Agricultural Economics and Management, Faculty of Agriculture, The Hebrew University, Rehovot 76100, Israel. Oczkowski, Eddie (2003). Two-Stage Least Squares (2SLS) and Structural Equation Models (SEM). http://csusap.csu.edu.au./~eoczkows/home.htm Samuel Gebreselassie and E. Ludi (2007), Agricultural Commercialisation in Coffeegrowing Areas of Ethiopia. Paper presented at the Fifth International Conference on the Ethiopian Economy, EEA, June 2007, Addis Ababa. www.future-agricultures.org Seifu Ketema (1989). Production trends, germplasm resources, breeding and varietals improvement of small millets, with special emphasis on tef in Ethiopia. Pp 167-172. In: Seetharam A., Riley K.W. and Harinarayna G (Eds.) Small Millets in Global Agriculture. IDRC, Oxford & IBH Co., India. Storck, H., Bezabih E., Berhanu, A., Andrzej, B. and Shimelis W/ Hawariat (1991). Farming Systems and Farm Management Practices of Smallholders in the Hararghe Highlands. Farming Systems and Resource Economics in the Tropics. Vol. 11. Wissenschaftsverlag Vauk Kiel, Germany. von Braun, Joachim (1994). Production, Employment, and Income Effects of CommercializationCommercialisation of Agriculture. In: Joachim von Braun and Eileen Kennedy (eds) (1994). Agricultural CommercializationCommercialisation, Economic Development and Nutrition. The Johns Hopkins University Press, London. von Braun, Joachim and Eileen Kennedy (eds) (1994). Agricultural CommercializationCommercialisation, Economic Development and Nutrition. The Johns Hopkins University Press, London. von Braun, Joachim, Howarth Bouis and Eileen Kennedy (1994). Conceptual Framework. In: Joachim von Braun and Eileen Kennedy (eds) (1994). Agricultural CommercializationCommercialisation, Economic Development and Nutrition. The Johns Hopkins University Press, London.
26
Annex 1: Conversion factors for household size and labour-force 1. Adult equivalents (household size) To compute household size in Adult-Equivalent (AE) based on consumption needs the following standard conversion factors were used. A male adult is assumed to require 3,000 kcal/day. Age group (years) < 10 10 – 13 14 – 16 17 – 50 > 50
Male 0.6 0.9 1 1 1
Female 0.6 0.8 0.75 0.75 0.75
Source: Institut pan-Africain pour le Developpement (1981) as quoted in Storck et al. (1991).
2. Man equivalents (labour-force) To compute household labour force in Man-Equivalent (ME) the following standard conversion factors were used. Age group (years) < 10 10 – 13 14 – 16 17 – 50 >50
Male 0.0 0.2 0.5 1 0.7
Female 0.0 0.2 0.4 0.8 0.5
Source: These conversion factors were developed comparing between Here (1986), Johnson (1982), Ruthenberg (1983) and Nair (1985) as quoted in Storck et al. (1991).
Future Agricultures Consortium www.future-agricultures.org
27