Evidence from a recent study on virtual team performance (Singer, Grant, ... Florida which allowed for FTF contact before and after a series of virtual environment.
COMMUNICATION MODALITY AND AFTER ACTION REVIEW PERFORMANCE IN A DISTRIBUTED IMMERSIVE VIRTUAL ENVIRONMENT
by JASON P. KRING B.S. University of Colorado, 1994 M.S. Emporia State University, 1997
A dissertation submitted in partial fulfillment of the requirements for the degree of Doctor of Philosophy in the Department of Psychology in the College of Arts & Sciences at the University of Central Florida Orlando, Florida Spring Term 2004
Major Professor: Eduardo Salas
ABSTRACT
Technological innovations in data transfer and communication have given rise to the virtual team where geographically separate individuals interact via one or more technologies to combine efforts on a collective activity. In military, business, and spaceflight settings, virtual teams are increasingly used in training and operational activities; however there are important differences between these virtual collaborations and more traditional face-to-face (FTF) interactions. One concern is the absence of FTF contact may alter team communication and cooperation and subsequently affect overall team performance. The present research examined this issue with a specific focus on how communication modality influences team learning and performance gains. Evidence from a recent study on virtual team performance (Singer, Grant, Commarford, Kring, & Zavod, 2001) indicated local teams, with both members in same physical location in Orlando, Florida which allowed for FTF contact before and after a series of virtual environment (VE) missions, performed significantly better than distributed teams, with team members in separate physical locations in Orlando and Toronto, Canada and no FTF contact. For the first mission, local and distributed teams exhibited no significant difference in performance as measured by the number of rooms properly cleared in the building search exercises. In contrast, for the second mission, occurring after each team had completed the opportunity to discuss mission performance and make plans for future missions, local teams performed significantly better than distributed teams; a pattern that continued for the remaining six missions. Given that the primary difference between local and distributed teams was how they communicated outside of the VE during after action reviews (AARs), and that the localii
distributed difference was first detected on the second mission, after teams had completed one, 10-min discussion of mission performance, a tenable conclusion is that certain team characteristics and skills necessary for performance were communication-dependent and negatively affected by the absence of FTF communication. Although Singer et al. (2001) collected multiple dependent variables related to performance and communication activities, these measures were not designed to detect communication-dependent team factors and therefore incapable of supporting such an explanation. Therefore, the present research replicated Singer et al. (2001) and incorporated additional measures in order to determine if specific communication-dependent factors could explain the inferior performance of distributed teams. Three factors critical to team communication, particularly during the AAR process, are the similarity of team members’ shared mental models (SMMs), team cohesion (task and interpersonal), and team trust (cognitive and emotional). Because evidence suggests FTF communication has a positive effect on processes related to each of these factors, the current study tested whether distributed teams exhibit less similar mental models and degraded cohesion and trust in comparison to local teams, which can affect performance. Furthermore, to test the prediction that distributed teams possess degraded communication and would benefit from improved communication skills, brief team communication training (TCT) was administered to half of the teams in each location condition. Thirty two, 2-person teams comprised of undergraduate students were equally distributed into four experimental conditions (n = 8) based on the independent variables of location (local vs. distributed) and training (TCT vs. no-TCT). Teams completed five missions using the same VE system and mission tasks as in Singer et al. (2001), however in the present study distributed team members were in separate rooms in the same building, not separate geographic locations. In iii
addition to performance data, participants completed a series of questionnaires to assess SMMs, cohesion, and trust. It was hypothesized that local teams would again exhibit better performance than distributed teams and that the local team advantage could partly be explained by a greater similarity in mental models and higher levels of cohesion and trust. Moreover, TCT teams in both locations were expected to exhibit improved performance over their non-trained counterparts. Results indicated that overall performance, measured as the number of rooms properly searched each mission, improved for all teams over the five missions. For the main effect of location, the overall total number of good rooms for all missions was significantly higher for local teams than distributed teams. Furthermore, the mission-by-mission analysis revealed local teams performed significantly better than distributed teams on missions 3 and 4, but exhibited no significant differences for missions 1, 2 and 5. For the most part, these results concur with Singer et al., although they detected a significant local-team advantage after the second mission that continued for the remaining missions. Results, however, did not support a beneficial effect of TCT on overall performance or for the mission-by-mission analysis as TCT teams were not significantly different from their no-TCT counterparts. Analyses of the three team factors revealed the largest location and communication training differences for levels of cognitive trust, with local teams reporting higher levels than distributed teams early after the second VE mission, and TCT teams reporting higher levels than no-TCT teams after the second and fifth VE missions. In contrast, the main effects of location and communication training were only significant for one SMM measure—agreement between team members on the strengths of the team’s leader during the AAR sessions. Local teams and TCT teams reported higher levels of agreement after the first VE mission than their distributed iv
and no-TCT counterparts. Furthermore, on the first administration of the questionnaire, TCT teams reported higher levels of agreement than non-TCT teams on the main goals of the VE missions. Overall, teams in all conditions exhibited moderate to substantial levels of agreement for procedural and personnel responsibility factors, but poor levels of agreement for mental models related to interpersonal interactions. Finally, no significant differences were detected for teams in each experimental condition on levels of task or interpersonal cohesion which suggests cohesion may not mature enough over the course of several hours to be observable. In summary, the first goal of the present study was to replicate Singer et al.’s (2001) findings which showed two-person teams conducting VE missions performed better after the first mission if allowed face-to-face (FTF) contact during discussions of the team’s performance. Local and distributed teams in the current study did show a similar pattern of performance, completing a greater total of rooms properly, although when evaluating mission-by-mission performance, this difference was only significant for missions 3 and 4. Even though distributed team members experienced the same experimental conditions as in Singer et al. (no pre-mission contact, no FTF contact during missions or AARs) and were told their partner was at “distant location,” familiarity with a teammate’s dialect and other environmental cues may have differentially affected perceptions of physical and psychological distance, or social presence, which ultimately altered the distributed team relationship from before. The second goal was to determine if brief TCT could reduce or eliminate the distributed team disadvantage witnessed in Singer et al. (2001). Results did not support this prediction and revealed no significant differences between TCT and no-TCT teams with regard to number of rooms searched over the five missions. Although purposefully limited to 1 hr, the brevity of the TCT procedure (1 hr), and its broad focus, may have considerably reduced any potential benefits v
of learning how to communicate more effectively with a teammate. In addition, the additional training beyond the already challenging requirements of learning the VE mission tasks may have increased the cognitive load of participants during the mission phase, leading to a detriment in performance due to divided attention. Despite several notable differences from Singer et al. (2001), the present study supports that distributed teams operating in a common virtual setting experience performance deficits when compared to their physically co-located counterparts. Although this difference was not attributed to agreement on SMMs or levels of cohesion, local teams did posses higher levels of cognitive trust early on in the experimental session which may partly explain their superior performance. However additional research that manipulates cognitive trust as an independent variable is needed before implying a cause-and-effect relationship. Ultimately, this study’s most significant contribution is identifying a new set of questions to understand virtual team performance. In addition to a deeper examination of cognitive trust, future research should address how features of the distributed team experience affect perceptions of the physical and psychological distance, or social presence, between team members. It is also critical to understand how broadening the communication channel for distributed teams, such as the inclusion of video images or access to biographical information about one’s distant teammate, facilitates performance in a variety of virtual team contexts.
vi
For Cheryl, who nurtured my dreams and taught me to fly,
and in memory of Vane and Arnita Tabler, who showed me what hard work can achieve.
vii
ACKNOWLEDGEMENTS
This achievement would not have been possible without the support, guidance, and commitment of many special people. Michael J. Singer at the U.S. Army Research Institute (ARI) has been my mentor and friend for the past five years. His input to this project, including the theory, design, and data analysis, and boundless support and encouragement when the end seemed nowhere in sight, were invaluable. Special gratitude is also owed to Stephen L. Goldberg, who graciously allowed me to pursue this dissertation at ARI, and Robert S. Ruskin, who gave me the opportunity to work as a fellow in the Consortium Research Fellows Program at ARI, and now my first post-doctoral position. I could not have asked for a more insightful and supportive committee. I was fortunate to have Eduardo Salas serve as my academic advisor at UCF and committee Chair and thank him for all of his advice and assistance. Clint Bowers and Mustapha Mouloua provided many helpful comments that significantly improved the quality and implementation of this project. The patience and cooperation of this committee, including members Michael Singer and Stephen Goldberg, is much appreciated. Conducting this research was a long and arduous process. I am indebted to Roger Hamilton, who provided keen observations and refinements to the experimental design and helped collect data, and to Glenn Martin and Jason Daly at the Institute for Simulation and Training, who kept the computer systems running and were instrumental in the initial design of the virtual environment. My colleagues at ARI also provided expertise and encouragement including John Barnett, Karen Coll, Paula Durlach, Bruce Knerr, Donald Lampton, Larry Meliza, Bob Witmer, and fellow Consortium students Bryan Clark, Laticia Bowens, John Neumann, viii
Christian Jerome, and John Holmquist. Past Consortium student Patrick Commarford also provided valuable assistance in the initial planning of this project. Early in my academic career at Emporia State University, I had the good fortune of working with the gold standard for academic advisors; Stephen F. Davis. He saved me from a profession in clinical psychology and taught me the joys of using science to understand human behavior. He opened my mind, and opened the doors, that made this final step in my degree pursuits possible. My family, however, is most responsible for my success and each has my deepest gratitude. First and foremost, if there ever was somebody who made me believe in me, it was my mother, Cheryl. Words cannot express how much she means to me. She is my role model and best of all, my friend. Jack Mannion continues to inspire and guide me in my academic, professional, and personal life. Thanks, Captain. I never would have made it through the last seven years without the love and friendship of my wife, Eleni, and our son, Rexy. You were always there for me and carried more than your share of our burdens. A man could not ask for a more loving family and warm place to call home. I thank my father, Bob, for introducing me to music and laughter. He is always on my mind. My sister, Samantha, continues to influence my life in more ways than she probably knows and had me figured out long ago. My wife’s family, Bill, Frances, Stavria, Thanasi, Elias, and Anna, never wavered in their love and support of my goals and were always there for me. My best friend of over 20 years, Jason, experienced this research first hand and did not really get the highest score. Finally, my only regret is my grandmother and grandfather could not be here to share in my accomplishment. I hope they are proud.
ix
TABLE OF CONTENTS
ABSTRACT.................................................................................................................................... ii ACKNOWLEDGEMENTS......................................................................................................... viii LIST OF TABLES........................................................................................................................ xii LIST OF FIGURES ..................................................................................................................... xiv CHAPTER 1: INTRODUCTION ....................................................................................................1 Virtual Teams.............................................................................................................................. 3 Team Performance in a DIVE: Results of Singer et al. .............................................................. 7 Study Goals: Replication, Explanation, and Training Intervention.......................................... 12 Team Learning Process and After Action Reviews.................................................................. 13 Communication and Team Performance .................................................................................. 44 Team Communication Training................................................................................................ 67 Hypotheses Summary ............................................................................................................... 71 CHAPTER 2: MATERIALS AND METHODS ...........................................................................73 Research Design........................................................................................................................ 73 Participants................................................................................................................................ 74 Materials ................................................................................................................................... 74 Apparatus .................................................................................................................................. 81 Procedure .................................................................................................................................. 86 CHAPTER 3: RESULTS...............................................................................................................93 Team Performance .................................................................................................................... 94 Team Factors........................................................................................................................... 114
x
Additional Measures ............................................................................................................... 136 CHAPTER 4: DISCUSSION.......................................................................................................148 Performance ............................................................................................................................ 153 Team Factors........................................................................................................................... 159 Team Communication Training.............................................................................................. 163 Conclusions............................................................................................................................. 165 APPENDIX A: BIOGRAPHICAL QUESTIONNAIRE.............................................................167 APPENDIX B: SHARED MENTAL MODEL QUESTIONNAIRE (SMMQ) ..........................170 APPENDIX C: GROUP ENVIRONMENT QUESTIONNAIRE-VIRTUAL ENVIRONMENT (GEQ-VE) ....................................................................................................................................175 APPENDIX D: TEAM TRUST QUESTIONNAIRE (TTQ) ......................................................183 APPENDIX E: SIMULATOR SICKNESS QUESTIONNAIRE (SSQ).....................................186 APPENDIX F: END QUESTIONNAIRE ...................................................................................188 APPENDIX G: PRESENCE QUESTIONNAIRE.......................................................................190 APPENDIX H: IMMERSIVE TENDENCIES QUESTIONNAIRE (ITQ) ................................196 APPENDIX I: MISSION AWARENESS RATING SCALE (MARS).......................................202 APPENDIX J: TEAM COMMUNICATION TRAINING SCRIPTS.........................................205 APPENDIX K: TCT CIRCUIT TASK DESCRIPTIONS...........................................................211 APPENDIX L: TEAM COMMUNICATION TRAINING QUIZ ..............................................219 APPENDIX M: IRB HUMAN SUBJECTS PERMISSION LETTER........................................222 LIST OF REFERENCES.............................................................................................................224
xi
LIST OF TABLES
Table 1: Different Types of Virtual Teams and Examples ............................................................. 6 Table 2: Contrast of Performance Critiques and AARs................................................................ 17 Table 3: Team Competencies from Cannon-Bowers et al. (1995). .............................................. 24 Table 4: Dimensions of Team Communication Training ............................................................. 70 Table 5: Experimental Conditions ................................................................................................ 73 Table 6: Means and Standard Deviations for Number of Good Rooms per Mission and Overall by Location and Training...................................................................................................... 96 Table 7: Means and Standard Deviations for Mean Door Entry Time in Seconds per Mission and Overall by Location and Training....................................................................................... 101 Table 8: Means and Standard Deviations for Mean Canister Disarming Time in Seconds per Mission and Overall by Location and Training .................................................................. 104 Table 9: Means and Standard Deviations for Mean Hallway Search Time in Seconds per Mission and Overall by Location and Training ................................................................................ 107 Table 10: Means and Standard Deviations for Mean Room Search Time in Seconds per Mission and Overall by Location and Training ................................................................................ 110 Table 11: Levels of Agreement for Cohen’s Kappa (κ) from Landis and Koch (1977)............. 116 Table 12: Mean Agreement on Mission Purpose for First and Second Administrations by Location and Training......................................................................................................... 118 Table 13: Mean Agreement on Room Search, Door Entry, and Canister Disarming Procedures for First and Second Administrations by Location and Training ....................................... 119
xii
Table 14: Mean Agreement on Personnel Responsibilities for First and Second Administrations by Location and Training.................................................................................................... 121 Table 15: Mean Agreement on Interpersonal Communication for First and Second Administrations by Location and Training ......................................................................... 123 Table 16: Mean Agreement on Interpersonal Strength for First and Second Administrations by Location and Training......................................................................................................... 125 Table 17: Means and Standard Deviations for GEQ-VE Subscales by Location and Training for First and Last Administrations............................................................................................ 127 Table 18: Means and Standard Deviations for TTQ Subscales by Location and Training for First and Second Administrations ............................................................................................... 130 Table 19: Correlations Between Mean GEQ-VE and TTQ Scores over all Conditions on the First Administration .................................................................................................................... 134 Table 20: Correlations Between Mean GEQ-VE and TTQ Scores over all Conditions on the Second Administration........................................................................................................ 135 Table 21: Correlations Between Mean Second Administration GEQ-VE and First Administration TTQ Scores over all Conditions ......................................................................................... 136 Table 22: Mean Responses on Partner Distance Estimation, Performance Differences, and Meeting One’s Partner for Distributed Team Leaders and Equipment Specialists by Training Condition.............................................................................................................. 147
xiii
LIST OF FIGURES
Figure 1: Mean Number of Good Rooms by Location over Missions from Singer et al. (2001)... 9 Figure 2: Team Learning Cycle (Adapted from Tannenbaum et al., 1998). ................................ 15 Figure 3: Interrelationships between Communication, AAR Dimensions, and Team Performance ............................................................................................................................................... 19 Figure 4: Teamwork Model (from Dickinson & McIntyre, 1997) ............................................... 22 Figure 5: Types of Shared Mental Models Evaluated in Current Study....................................... 28 Figure 6: Components of Cohesion .............................................................................................. 35 Figure 7: Communication Bandwidth and Sensory System Involvement .................................... 47 Figure 8: Revised Interrelationships between Communication, AAR Dimensions, and Team Performance .......................................................................................................................... 63 Figure 9: Solo Participant in the Fully Immersive Team Training (FITT) System Developed by ARI and IST.......................................................................................................................... 83 Figure 10: A Local Team in the Fully Immersive Team Training (FITT) System Developed by ARI and IST.......................................................................................................................... 84 Figure 11: Example Environmental Layout for a VE Mission ..................................................... 85 Figure 12: Mean Number of Good Rooms by Location and Training over Missions and Overall ............................................................................................................................................... 98 Figure 13: Mean Number of Good Rooms by Location over Missions and Overall.................... 99 Figure 14: Mean Door Entry Time in Seconds by Location and Training over Missions.......... 102 Figure 15: Mean Canister Disarming Time in Seconds by Location.......................................... 105 Figure 16: Mean Hallway Search Time in Seconds by Location and Training over Missions .. 109 xiv
Figure 17: Mean Room Search Time in Seconds by Location and Training over Missions ...... 112 Figure 18: Mean Room Search Time in Seconds by Location over Missions............................ 113 Figure 19: Mean GEQ-VE Subscale Scores by Location and Training for First and Last Administrations................................................................................................................... 128 Figure 20: Mean Cognitive and Emotional Trust Scores by Location and Training for First and Last Administrations........................................................................................................... 130 Figure 21: Mean Nausea Subscale Scores Pre- and Post-mission by Location over Missions .. 139 Figure 22: Mean Oculomotor Subscale Scores Pre- and Post-mission by Location over Missions ............................................................................................................................................. 140 Figure 23: Mean Disorientation Subscale Scores Pre- and Post-mission by Training over Missions .............................................................................................................................. 141 Figure 24: Mean Disorientation Subscale Scores Pre- and Post-mission by Location over Missions .............................................................................................................................. 142 Figure 25: Mean Total Severity Scores Pre- and Post-mission by Location over Missions....... 143
xv
CHAPTER 1: INTRODUCTION
Technology has forever altered how we communicate. Words once expressed in ink on paper now take the form of 0s and 1s in electronic mail. We meet potential mates not in coffee shops or local watering holes, but Internet chat rooms and on-line dating services. We learn about world events in minutes via satellite television, not having to wonder what we might read in the local paper the next morning. Even the weekly phone call to Mom is augmented with videophones and digital photo sharing. In short, technology has made the world a much smaller place. Technology is also changing the face of how we work and learn. Today, it is no longer necessary for members of a team, or a student and teacher, to be in the same physical location. Today, a group of geographically distant individuals can come together in the same virtual setting through technology. These “virtual teams” accomplish many of the same goals as their traditional face-to-face counterparts yet have the advantage of being able to form almost immediately (Carletta, Anderson, & McEwan, 2000; Duarte & Snyder, 1999; Haywood, 1998; Jarvenpaa & Leidner, 1999). For this and many other advantages, organizations are increasingly turning to virtual teams to remain competitive in a progressively more complex and global marketplace. The many advantages of virtual teams have driven their use in the military, business, and government. In addition to reduced travel costs, virtual teams exhibit increased flexibility and productivity, increased employee satisfaction and retention, improved response to emergencies, and a reduced need for office space (particularly in the case of telecommuters) (Haywood, 1998). In military command and control situations, for instance, computer-based collaboration (i.e., 1
planning via an electronic whiteboard) allows multiple individuals to coordinate actions more effectively than paper-based approaches (Miller, Price, Entin, Rubineau, & Elliot, 2001). Virtual team technologies also facilitate international business ventures by helping companies in the U.S. place employees in foreign lands to form new relationships with overseas partners. Duarte and Snyder (1999) have noted that “The business justification for virtual teams is strong. They increase speed and agility and leverage expertise and vertical integration between organizations to make resources readily available.” (p. 9). Interestingly, the growth in virtual team use continues despite several significant drawbacks. Potential problems include faulty technology (nobody works when systems like Internet servers malfunction), and conflicting time zones for multinational teams. Another concern in today’s global infrastructure is cultural differences in communication styles and norms (Kring, 2001). Team members unfamiliar with a certain technology may use that technology differently than veteran users. Rocco, Finholt, Hofer, and Herbsleb (2001) described how voice mail users in the United Kingdom, who were familiar with the technology, did not understand why their German counterparts responded to messages only once or twice a week. The German communication style was initially attributed to arrogance and neglect, until the British workers realized that the Germans had no experience with voice mail in the workplace. Perhaps the most critical limitation of virtual teams is how technology-mediated communication alters team processes, and ultimately performance. With the growing number of virtual teams, it is possible that many team members never meet in person prior to, during, or after the performance of a collective task. The absence of face-to-face (FTF) communication has already been shown to affect multiple team dimensions including mutual attraction (Weisband & Atwater, 1999) and trust between team members (Bos, Gergle, Olson, & Olson, 2001; Rocco, 2
1998; Zheng, Bos, Olson, & Olson, 2001). A recent study also indicates that geographicallydistributed teams practicing tasks in a distributed, immersive virtual environment (DIVE) perform less well than geographically-local teams with FTF interaction (Singer, Grant, Commarford, Kring, & Zavod, 2000; 2001). The purpose of the present study was to further explore how the training and performance of virtual teams with no FTF interaction compares to teams operating with more traditional FTF communication. In particular, this study investigated the unique case of teams performing in a distributed manner within a DIVE setting with special attention paid to team factors such as cohesion, trust and shared mental models, which may depend on FTF communication. The following sections first define virtual teams and compare and contrast several distinct forms. Next, the findings of Singer et al. (2001), which prompted the present study, are presented. This is followed by an outline of the goals of the study, and an elaboration on the three team factors that are susceptible to communication differences.
Virtual Teams A virtual team is unique from other types of teams, just as teams are different than groups. Groups are defined as a collection of two or more interacting individuals who share common interests or goals, have a stable group structure, and perceive themselves as being in a group (Forsyth, 1999). Group members may rely on each other to produce a common product or result, but can often work independently on individual tasks without the input or expertise of other group members. Teams, on the other hand, are specialized groups in which two or more persons work interdependently toward a common goal for which all team members are mutually accountable (Greenburg & Baron, 1995; Morgan, Glickman, Woodward, Blaiwes, & Salas, 3
1986; Neuman & Wright, 1999; Salas, Dickinson, Converse, & Tannebaum, 1992). Team members must coordinate their knowledge, skills, and abilities with those of other members to accomplish a shared task. The primary distinction between a virtual team and other team types is that one or more of the team members are geographically separated from other members (Haywood, 1998). Virtual teams, also referred to as distributed teams (Dwyer, Fowlkes, Oser, Salas, & Lane, 1997; Haywood, 1998; Weisband & Atwater, 1999), non-collocated teams (Carletta, Anderson, & McEwan, 2000), or teams functioning via computer-supported cooperative work (e.g., Bannon, & Schmidt, 1991; Miller et al., 2001; Olson, Card, Landauer, & Olson, 1993), utilize some form of technology to bridge the physical gap between members in order to communicate and collaborate. A virtual team can therefore be defined as a specialized group in which two or more geographically separate persons work interdependently via a technology bridge toward a common goal for which all team members are mutually accountable. Using this intentionally broad definition, it is arguable that almost any organizational team operating today is “virtual.” In many cases, team members never meet one another personally, for example in the case of vendors, suppliers, or customers, but instead exchange ideas and information with phone calls, email, teleconferences, videoconferences, or messages sent over the Internet. This broad definition also implies there are many different categories of virtual teams. Duarte and Snyder (1999) have argued that seven basic types of virtual teams are regularly used today, summarized in Table 1. Even with dissimilar objectives and team structures, the common characteristic of all virtual teams is they collaborate across distance and time. More recently, a new type of virtual team has emerged in which two or more individuals, located at different physical locations, cooperate on a collective activity while immersed in the same computer4
generated environment (i.e., DIVE). DIVEs are a relatively new phenomenon and quite different from what many contend are “virtual environments.” Immersive VEs heavily engage a user’s sensory systems and block outside stimuli from the physical world (Biocca & Delaney, 1995). A desktop personal computer displaying outdoor scenes through which a user maneuvers via a keyboard and mouse, therefore, is not a true example of an immersive virtual environment. The user does not have the sensory input or psychomotor output connections to afford a sense of being “in” the environment. In an immersive VE, a head-mounted display (HMD) provides a 3dimensionsal (in modern models) representation of the environment. Furthermore, sensors attached to the user, either via electromagnetic trackers or visual indicators that are picked up by computer-linked cameras, translate physical movements in the real world into comparable movements in the VE. A team performing in a DIVE, therefore, is distinct from virtual teams in which geographically separate individuals simply view the same information or visual scene on their respective monitors. Another unique feature about DIVE-based activities is that in many cases, team members see computer-generated representations of each other, called avatars, but never actually meet in person. Teammates communicate verbally via microphones attached to telephone lines or other audio transfer connections, but there is generally no FTF contact. This particular type of virtual team is the focus of the present study.
5
Table 1: Different Types of Virtual Teams and Examples Virtual Team Type Networked Teams
Description Individuals collaborating to achieve a common goal or purpose, with no clear distinction between a network team and the organization as membership is fluid and diffuse.
Examples NASA’s International Space Station (ISS) team, high technology consulting firms.
Parallel Teams
Short-lived team formed to carry out a specific assignment or function that the regular organization is not equipped to perform. Different from networked teams in that the team has a distinct membership that identifies it from the rest of the organization.
Special assignment teams in large corporations tasked with providing quick recommended solutions.
Project or ProductDevelopment Teams
Long-term team formed to develop a specific product. Different from parallel teams in that it exists for a longer time period and can make decisions autonomously, not just recommendations.
NORTEL’s team to develop a common platform for a world telephone.
Work or Production Teams
Team with defined membership and distinguishable from other organizational teams. They conduct regular and ongoing work, typically in one domain such as financing or training.
Survey teams for the Federal Highway Administration who work in remote locations and share data via electronic communication and data transfer technology.
Service Teams
Team tasked with supporting a company’s products. Members are spread around the world and work during daylight hours at each location, communicating virtually.
Network support teams for Internet Service Providers.
Management Teams
Team of managers or executives, spread around the country or world, who work collaboratively on a daily basis.
U.S. Army’s Chief of Staff manages 350 general officers in multiple locations via e-mail and Internet chat rooms.
Action Teams
Team tasked with immediate responses, often to emergency situations.
American Red Cross and contacts with National Weather Service personnel, state and local agencies, and emergency medical services. Note. Adapted from Mastering Virtual Teams, by D. L. Duarte & N. T. Snyder, 1999, San Francisco: Jossey-Bass, pp. 5-8.
6
It is evident that virtual team use will increase in the future if recent trends are any indication. Beyond the obvious growth of the Internet, satellite communications, and computer processing power (which enhances the tools of a virtual team), those in industry are witnessing a major restructuring toward a global marketplace. An area likely to see exceptional growth following the 2001 terrorist attacks in the U.S. is training via DIVEs, particularly in the military and emergency response domains, where geographically separate personnel combine efforts to address a situation, or train together in preparation for future collaborations. Fully immersive medical simulations, for instance, have shown promise for training first responders to crisis situations like biological terrorism (Stansfield, Shawver, Sobel, Prasad, & Tapia, 2001). Similarly, branches of the U.S. military currently use DIVEs in simulated “war games” for collective training exercises. Future U.S. Army plans call for VE systems capable of creating upto-date immersive representations of distant locations in a matter of days, based on data downloaded from Global Positioning System (GPS) satellites. Conceivably, military teams could train within an accurate and near real-time representation of the setting in which they will be deployed. For these and other virtual team endeavors to succeed, more needs to be known about how virtual collaboration affects specific team dimensions, and ultimately productivity and performance.
Team Performance in a DIVE: Results of Singer et al. Findings from a recent study on distributed teams in an immersive VE were the primary motivation for the current experiment. Singer et al. (2001; see also 2000) compared two-person teams on several dependent variables as they completed a series of eight missions in a DIVE. All teams performed collective activities, patterned after anti-terrorist and hazardous materials 7
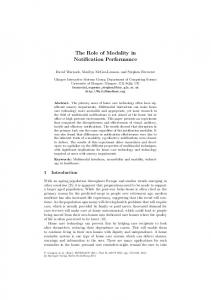
training programs, while searching rooms in a variety of simulated buildings. In each mission, teams encountered opposing forces (OpFor), innocent bystanders, and a number of hazardous gas canisters in armed or neutral states. Successful performance relied on teams neutralizing all OpFors and disarming all armed canisters. During missions, team members could hear each other via headphones, but only saw avatars (virtual representations) of their counterpart. For half of these teams, members were located in the same physical location (local teams) and had opportunities to interact in a FTF manner for a brief period prior to each VE mission, and for a longer period after each mission to conduct after action reviews (AARs) of their performance. Team members in a second condition were physically separate, with one person located in Toronto, Canada, and the other in Orlando, Florida. For these distributed teams, team members never saw one another and communicated only over telephone immediately prior to mission sessions and during the AARs. Results indicated that the distributed teams performed less well than local teams on the number of rooms searched properly during the last seven VE missions, as shown in Figure 1, but were nearly identical to local teams for the first mission. A successful room completion required that team members search the room, neutralize any OpFor, check the state of all canisters and disarm when appropriate, before being called back by the offsite controller. In addition, team members must not have shot any neutral bystanders or accidentally detonated any gas canisters. Reasons for the local-distributed difference, however, were unclear. Teams in the local and distributed conditions did not exhibit significant differences on measures of: a) presence (Singer, Commarford, & Kring, 2001), defined as the subjective experience of being in one place or environment, even when one is physically situated in another (Witmer & Singer, 1994, 1998), b) immersion, or a person’s tendency to become mentally engrossed in an environment, or c) 8
simulator sickness, physical reactions to being in a VE. Furthermore, assessments of the Big Five personality characteristics (Neuroticism, Extraversion, Openness to Experience, Agreeableness, and Conscientiousness) showed no significant differences between local and distributed teams, as would be expected (Kring, Commarford, & Singer, 2001).
9
Local Distributed
8 Good Room Searches
7 6 5 4 3 2 1 0 1st
2nd
3rd
4th
5th
6th
7th
8th
Mission Rehearsals
Figure 1: Mean Number of Good Rooms by Location over Missions from Singer et al. (2001).
Additional analyses examined the patterns of local and distributed team communication during the AAR sessions (Commarford, Kring, & Singer, 2001). Previous research (e.g., Kanki, Lozito, & Foushee, 1989; Bowers, Jentsch, Salas, & Braun, 1998) on communication styles and performance had shown that team communication patterns during aviation-based activities were related to team performance. Bowers et al. (1998), for instance, reported that specific patterns of 9
communication were indicative of better performing teams during simulated flight tasks. They demonstrated that an analysis of two-statement communication sequences, or loops, discriminated between good and poor teams to a much greater degree than simple communication frequency counts. Furthermore, Bowers et al. found that poor teams closed a lower proportion of total communication utterances with responses (as opposed to leaving the loop open, characterized by no response or an irrelevant response from the team member after an utterance) than good teams. Poor teams specifically followed a lower proportion of facts, planning statements, uncertainty statements, and action statements with acknowledgements. These poorer-performing teams also used a higher proportion of non-task related communications, were less likely to follow action statements with other action statements, and were less likely to follow communication from air traffic control with planning statements. Whereas Kanki et al. and Bowers et al. focused on communication during task performance, Singer, Commarford et al. (2001) examined team communication during AARs of task performance using a similar approach to determine if differences existed between local and distributed, and high and low performing, teams. Content categories, based on those used by Bowers et al. (1998), were used to categorize AAR communications. These included the percentage of utterances with responses, the number of planning statements, the proportion of planning utterances, the proportion of non-mission related utterances, and the proportion of mission-related questions. Results showed that AAR team communication patterns did not differ significantly between high and low performing teams, or between local and distributed teams. However, these analyses were performed on audio-only recordings collected during AARs and thus did not address nonverbal elements of communication such as head movements to indicate positive or negative affirmations. It is therefore possible that local and distributed team 10
communications were substantially different, but only in the recognition of nonverbal cues. Distributed teams obviously did not have access to nonverbal information that may have facilitated discussions during the AAR, leading to more effective review and planning, and subsequently better performance during missions. In summary, Singer et al. (2001) found that local teams, who had FTF contact, outperformed distributed teams with no FTF contact, but the source of this difference was not identified. Because the presence or absence of FTF communication during the pre-mission brief—when team members listened to a short description of the forthcoming mission—and the AAR was the primary difference between local and distributed teams, one hypothesis is that communication-dependent interpersonal and team-building factors were either absent or degraded during these phases for distributed teams, leading to poorer performance. Part of this hypothesis is problematic, however, in that performance during the first VE mission was not significantly different for local and distributed teams, suggesting that the discussion prior to the teams’ first mission had little to no affect on mission performance. This is reasonable considering this period was relatively brief (~ 2 min) and the team members had minimal communication as they listened to the experimenter outline the upcoming mission. On the other hand, significant differences were found for missions 2-8; missions for which teams completed AARs. For this reason, a stronger hypothesis is that communication-dependent interpersonal and team-building factors were degraded during the AAR phases for distributed teams, and that this decrement led to poorer performance. The present study was undertaken to test these assumptions, and better explain Singer et al.’s findings.
11
Study Goals: Replication, Explanation, and Training Intervention Three main goals guided the methods and measurements for the present study. The first goal was to gather additional data to support that in a DIVE, local teams with FTF communication during AARs perform better than distributed teams with no FTF communication, as found by Singer et al. (2001). The second goal was to gather data to explain this difference. In other words, how are specific team processes or functions altered by different modes of communication during AARs such that local interactions lead to better team performance than distributed teams with no FTF communication? Because communication affects nearly all team dimensions and competencies (Dickinson & McIntyre, 1997), a large number of factors deserved attention. However, focusing on factors with apparent dependencies on communication, as well as those critical to AARs, it was argued that shared mental models (SMMs) of the task and past performance, the degree of cohesion, and trust between team members, were most likely to be affected by the absence of FTF communication. In brief, SMMs are mental representations of a task or environment maintained by the members of a team. Cohesion refers to the degree to which team members are committed to a task (i.e., task cohesion) and are attracted to one another (i.e., interpersonal cohesion). Trust, on the other hand, refers to attitudes held by team members regarding the emotional closeness with, and reliability and competence of, other team members. This study compared local and distributed teams, in a DIVE setting, on performance and measures of these three factors. Working under the assumption that local teams would perform better than distributed teams, the third goal was to determine if brief team communication training (TCT) could equalize these differences. Put another way, this study tested whether brief communication training could remove decrements faced by distributed teams in a DIVE during post-mission 12
discussions. The motivation was to show how a simple training solution can elevate distributed performance up to, or perhaps beyond, that of local teams. The following sections outline the rationale and hypotheses for each goal. The first section briefly describes the team learning process and general findings with regard to the benefits of feedback and knowledge of results to overall team performance. This section also addresses the communication-dependent cognitive and interpersonal elements of AARs: SMMs, cohesion, and team trust. The next section summarizes theory and research on communication and team processes, specifically how FTF communication differs from non-FTF modes and how these differences affect SMMs, cohesion and trust. The final section describes the TCT strategy in detail and hypotheses about how TCT will affect local and distributed teams.
Team Learning Process and After Action Reviews Team performance relies on how well a team masters specific tasks and skills, and how well team members learn to work together. Accordingly, optimal team performance is achieved by both improving individual and team-level proficiencies, and improving the way team members interact with one another (Tannenbaum, Smith-Jentsch, & Behson, 1998). In both cases, team training can make the difference between an uncoordinated, error-prone team and a successful one. Numerous authors have put forth viable team training methodologies and approaches (e.g., Andrews, Waag, & Bell, 1992; Cannon-Bowers, Tannenbaum, Salas, & Volpe, 1995; Smith-Jentsch, Zeisig, Acton, & McPherson, 1998; Stout, Salas, & Fowlkes, 1997; Swezey & Salas, 1992). Although these and other models differ in regard to specific procedures or focus, a common premise is that team training is most effective when occurring over several phases. For example, Smith-Jentsch et al. (1998) noted that effective teams are generally better at 13
first evaluating their performance and then diagnosing causes of errors, identifying solutions, and planning for future events or tasks. This process leads to what is termed “team self-correction,” referring to the changes team members agree to that will reduce miscommunications and errors and improve performance on subsequent tasks. In other words, teams should progress through what Tannenbaum et al. (1998) term the team learning cycle. As shown in Figure 2, the first stage, Pre-Brief, involves a team-level discussion of the forthcoming task, including a clarification of team member roles, strategies, and expectations of performance. The pre-brief also serves to focus the team’s attention on the task and frame discussion during post-task reviews. The second stage, Perform/Practice, is the actual performance of the task, or in the case of training rehearsals, an opportunity to practice tasks as well as interacting with each other, either in a real-world or simulated setting. Concurrent with or immediately after the perform/practice stage, team members undergo a third stage, Diagnose Performance, in which outside observers, and in some cases team members, monitor and record the team’s performance and identify errors or areas needing improvement. These observations are then shared in the fourth stage, the Post-Action Review, analogous to the AAR. During this review, team members compare individual impressions of the team’s performance and discuss potential ways to improve on subsequent practice sessions. Tannenbaum et al. note this stage is often guided by an outside observer/trainer, but that team leaders can also help direct the post-activity review.
14
First Stage
Pre-Brief Fourth Stage
Second Stage
Post-Action Review
Perform/Practice Third Stage
Diagnose Performance
Figure 2: Team Learning Cycle (Adapted from Tannenbaum et al., 1998).
Teams may progress through the four stages at different speeds, and may be guided internally or externally. Smith-Jentsch et al. (1998), for example, utilize the same cycle in their Team Dimensional Training (TDT) approach for which trainers or instructors guide the team’s activities in each stage. Thus, in the Diagnose Performance stage, it is the instructors who monitor performance and record major errors or points of discussion for the post-activity review. Similarly, instructors are typically responsible for the structure and distribution of feedback in the US Army’s approach to AARs (Meliza, Bessemer, & Hiller, 1994). Of importance in the context of the present study is the role team communication plays in the team learning cycle. As previously noted, teams operating in a DIVE setting with FTF communication during pre-briefs and AARs exhibited better performance than teams with no FTF contact. Given that the primary difference between conditions was the mode of communication in these stages of the learning cycle, a reasonable source of the performance difference was in how FTF communication affected each team’s ability to clarify plans for upcoming performance, and then review observations, plan for the next mission, and work 15
together as a team during the AAR. How then does communication affect the team learning process, and is FTF contact a necessary precursor to successful team training? Even though communication is involved in all four stages in the learning cycle, it is perhaps most important during the AAR stage. The U.Ss Army developed the AAR in the 1970s as an improved way to provide feedback to personnel involved in collective training (Morrison & Meliza, 1999). With new training simulation techniques on the horizon that would provide objective performance data, such as the Tactical Engagement Simulation (TES) and later, the Multiple Integrated Laser Engagement System (MILES), US Army researchers realized the traditional performance critique approach, based on subjective evaluations by exercise leaders, was insufficient. This old method placed soldiers in a passive role during lecture-driven feedback sessions and focused primarily on errors. In contrast, the AAR involved soldiers in an active discussion of the exercise and centered on the sequence of events based on objective data available from the new training simulation approaches. Table 2, from Morrison and Meliza (p. 8), illustrates the differences between the two approaches.
16
Table 2: Contrast of Performance Critiques and AARs
Characteristics of Feedback Sessions
Performance Feedback Method Traditional Performance Critique AAR
Soldier participation
Soldiers are passive members of an audience
Soldiers are active participants in a discussion
Main topic of discussion
Errors committed
Sequence of events
Direction of communication
One-way (from leader to participants)
Two-way
Atmosphere
Defensive
Open to suggestion
Instructional style
Traditional lecture
Guided discovery learning
Source of information: why it happened
Exercise leader and controller
Participants and members of the opposing force (OpFor) and exercise leaders
Source of information: what happened?
Subjective judgment
Objective performance indicators
Note. Adapted from “Foundations of the After Action Review Process,” by J. E. Morrison and L. M. Meliza, 1999, US Army Research Institute Special Report # 42, p. 8.
Today, the AAR process is an integral part of military training (Fober, Dyer, & Salter, 1994) and is the US Army’s preferred method of providing feedback after collective training, both in live field exercises and VE-based training (Meliza et al., 1994). At the core of the AAR process is a focused discussion among team members of their performance in a previous training exercise. According to Morrison and Meliza (1999), this discussion centers on three main questions: 1. “What happened during the collective training exercise?” Team members attempt to clarify the important events during the exercise.
17
2. “Why did it happen?” Team members discuss the causes of the important events, focusing on the sequence of events and potential ways to improve performance. 3. “How can the team improve their performance?” Based on answers for the previous questions, the team discusses solutions to problems and develops plans for future exercises. AARs may employ additional features to facilitate the process, such as audio and video replays of the exercise, but the team discussion remains the indispensable element. Accordingly, the effectiveness of any AAR is dependent on clear and efficient communication between team members. Language barriers, background noise, and other obstacles must be avoided in order to reach the full potential of the AAR process. Herein lays a main objective of the present study; to determine if non-FTF, or voice only, communications negatively affects the AAR, and if brief training interventions can help teams overcome any communication-related deficiencies posed by reduced FTF communication. Simply showing that voice only communication degrades the AAR process, however, is insufficient because this does not explain why. It is important to examine those characteristics and processes of a team, essential to the AAR, that are susceptible to poor communication. Models of team structure, dimensions, and competencies cite a large number of factors that are necessary or facilitate team performance in general, however specific factors are likely to play a more significant role than others in the AAR team interaction.
18
Learning Cycle Prebrief Perform/ Practice
Communication
After Action Review
Team Performance
Diagnose Performance
Shared Mental Models
Team Cohesion
Team Trust
Figure 3: Interrelationships between Communication, AAR Dimensions, and Team Performance
Figure 3 represents the hypothesized relationship between communication, the AAR, and three team dimensions involved in the AAR that are dependent on communication and likely susceptible to local and distributed team differences: SMMs, cohesion, and team trust. Communication, in the above model, has a direct influence on SMMs, cohesion, and trust, which in turn affect the AAR portion of the learning cycle. The rationale for focusing on these three factors is derived from reviewing several prominent models of team performance, as well as specific findings regarding the AAR process. The following sections describe each factor and illustrate their importance to AARs. 19
Shared Mental Models Morrison and Meliza (1999) noted that a primary goal of the AAR is to promote a common understanding among team members of what occurred during task performance, why any errors took place, and ways to improve future performance. This implies that the team must develop an isomorphic perception of previous events in order to plan effectively and subsequently improve performance (M. J. Singer, personal communication, October 15, 2001). A growing body of research does indeed indicate that similarity in team members’ individual knowledge structures of a given task or system facilitates overall team performance (Fiore, Salas, & Cannon-Bowers, 2001; Salas, Dickinson, Converse, & Tannenbaum, 1992, Serfaty, Entin, & Johnston, 1997; Smith & Dowell, 2000). More specifically, a number of researchers (CannonBowers, et al., 1995; Kraiger & Wenzel, 1997; Mathieu, Heffner, Goodwin, Salas, & CannonBowers, 2000; Stout, Cannon-Bowers, Salas, & Milanovich, 1999) have argued that effective teams are those possessing compatible mental representations, or SMMs, that allow for descriptions, explanations, and predictions of team behavior based on common performance expectations (Fiore et al., 2001; Mathieu et al., 2000). A SMM ensures that each team member is working toward the same goal, and aids team coordination because everyone on the team knows what each other are expected to do (Smith & Dowell, 2000). This awareness is critical to the AAR process. Support for the benefit of SMMs to AARs, and performance in general, comes from various models of team performance and empirical findings. For example, Dickinson and McIntyre (1997) reviewed teamwork literature and identified seven core components or dimensions of teamwork, outlined in Figure 4. Their model posits that Communication is the 20
most important, and pervasive, team dimension and is “...a mechanism that links the other components of teamwork.” (p. 21). Additional dimensions include Team Orientation, referring to the attitudes team members hold regarding each other, the team task, and leadership within the team. Team Orientation also includes the self-awareness one has that he or she is a part of the team, as well the degree to which a team is cohesive. Team Leadership, concerns the team’s structure and direction provided not only by designated leaders but other team members. The dimension of Monitoring refers to a team’s awareness and observation of the activities of other team members. A key implication of Monitoring is that team members are competent in their own tasks and have an understanding of the tasks and responsibilities of everyone on the team. Endsley and Jones (2001) note such understanding is crucial to the development of team situational awareness, a key feature of highly functioning teams. Similarly, Klein (2001) includes monitoring as one of four aspects of a successful team coordination process (with Planning, Triggering, and Alignment). This shared knowledge of a teammate’s actions and responsibilities is also crucial to the development of SMMs, a point discussed shortly.
21
Communication
Feedback
Team Orientation
Coordination
Monitoring Backup
Team Leadership
Learning Loop Figure 4: Teamwork Model (from Dickinson & McIntyre, 1997)
Another dimension in the model is Feedback. Dickinson and McIntyre (1997) found that successful teams were able to adapt and learn from their performance by the “giving, seeking, and receiving of feedback among team members.” (p. 22). This dimension has an obvious relation to the goals of the AAR and further supports the importance of post-performance reviews. Backup describes behaviors aimed at helping other team members perform their tasks. Dickinson and McIntyre argue that for backup behaviors to be effective, there must be a high degree of task interchangeability among team members, as well as a willingness to provide and accept assistance. Task interchangeability implies that team members have a thorough enough understanding of each other’s tasks, based on a common mental representation of the tasks, such that one could lend worthwhile assistance. The final dimension, Coordination, concerns the execution of team tasks whereby each member responds as a function of the actions and behaviors of the other team members. Klein (2001) notes that inherent in team coordination is 22
the ability of the team to work toward a common goal by “...carrying out a script/plan they all understand.” (p. 70). Taken together, a common theme underlying many of Dickinson and McIntyre’s (1997) seven dimensions, particularly team orientation, monitoring, feedback, backup, and coordination, is that team members possesses a mutual mental representation, or SMM, of each other’s individual tasks and responsibilities, as well as the team’s overall task or goal. SMMs also figure prominently in the model of team competencies put forth by Cannon-Bowers, Tannenbaum, Salas, and Volpe (1995). Their model involves a comprehensive list of cognitive, behavioral, and attitudinal competencies, summarized in Table 3, that are common in teams. The authors contend that team competencies are a combination of certain kinds of a) knowledge, or principles that underlie effective team performance, b) skills and behaviors necessary for task performance, and c) attitudes of team members. Cannon-Bowers et al. further describe how different types of team competencies can be labeled as specific to a certain team (team-specific/generic competencies), or specific to a certain task (task-specific/generic competencies). According to the model, teamspecific competencies only have meaning in the context of a particular combination of team members. In other words, certain competencies, like shared task models, are unique for only a single team of individuals. Add or remove one member, and the quality and content of the shared task model changes. Team-generic competencies, in contrast, remain relatively constant, regardless of team composition, and are “transportable” to other teams (Cannon-Bowers, et al.). Teamwork skills, including cooperation and assertiveness, are an example. With regard to the other division in competencies relating to the team task, task-specific competencies refer to knowledge, skills, and abilities dependent on the teams’ task, whereas task-generic competencies are applicable and relevant for multiple tasks. 23
Table 3: Team Competencies from Cannon-Bowers et al. (1995). Nature of Team Competency Context-driven
Description of Team Competency Team-specific Task-specific
Team-contingent
Team-specific Task-generic
Task-contingent
Team-generic Task-specific
Knowledge Cue/strategy associations Task-specific teammate characteristics Team-specific role responsibilities Shared task models Team mission, objectives, norms, resources Task sequencing Accurate task models Accurate problem models Team role interaction patterns Understanding teamwork skills Knowledge of boundary spanning role Teammate characteristics Teammate characteristics Team mission, objectives, norms, resources Relationship to larger organization
Task-specific role responsibilities Task sequencing Team role-interaction patterns Procedures for task completion Accurate task models Accurate problem models Boundary-spanning role Cue-strategy associations
24
Skills Task organization Mutual performance monitoring Shared problem-model development Flexibility Compensatory behavior Information exchange Dynamic reallocation of functions Mission analysis Task structuring Task interaction Motivation of others
Abilities Team orientation (morale) Collective efficacy Shared vision
Conflict resolution Motivation of others Information exchange Intrateam feedback Compensatory behavior Assertiveness Planning Flexibility Morale building Cooperation Task structuring Mission analysis Mutual performance monitoring Compensatory behavior Information exchange Intrateam feedback Assertiveness Flexibility Planning Task interaction Situational awareness
Team cohesion Interpersonal relations Mutual trust
Task-specific teamwork attitudes
Collective orientation Morale building Belief in importance Conflict resolution of work Information exchange Task motivation Cooperation Consulting with others Assertiveness Note. Adapted from J. A. Cannon-Bowers, S. I. Tannenbam, E. Salas, & C. E. Volpe (1995). Defining competencies and establishing team training requirements. In R. Guzzo & E. Salas (Eds.), Team effectiveness and decision making in organizations (pp. 333-380). San Francisco: Jossey-Bass. Transportable
Team-generic Task-generic
Teamwork skills
25
The team competency model of Cannon-Bowers et al. (1995) is further organized into four main categories of competencies related to the generality of the task and team. As indicated, KSAs in the context-driven category are specific for both the team and task. Team contingent KSAs are unique to a team composition, but can apply to several different tasks. The third category refers to task-contingent competencies, or those KSAs specific to a task, but are useful for a number of different teams. The fourth category, Transportable, includes those competencies generic for both team and task. A large number of the team competencies in the Cannon-Bowers et al. (1995) model relate to SMMs. These include competencies involving team members’ knowledge of the task, how it is accomplished, and individual responsibilities (e.g., shared task models, task-specific role responsibilities, task sequencing, procedures for task accomplishment, and accurate task models). Taken together, the models of Dickinson and McIntyre (1997) and Cannon-Bowers et al. highlight the importance of SMMs to team processes and performance. Furthermore, their ideas, and the positions of others (e.g., Cannon-Bowers, Salas, & Converse, 1993; Mathieu et al., 2000) suggest that teams possess more than one type of mental model. Cannon-Bowers et al. (1993), for example, outlined four types of mental models in teams related to the 1) technology and equipment used in a task, 2) the task itself, 3) the interactions between team members, and 4) knowledge of team members’ abilities and preferences. Mathieu et al. (2000) collapsed these categories into two primary content domains of mental models related to the task and the team. In the present study, four types of mental models were deemed appropriate in the AAR context, involving components from three main categories of information regarding the team task—purpose, procedures, and personnel—and one category concerning team member interpersonal interactions. The Purpose category refers to perceptions of the primary goals of the 26
task. A team with a solid Purpose SMM has a common idea of their objectives and knows precisely what needs to be accomplished in future missions in order to be successful. The Procedures category contains knowledge about how the task is accomplished. This includes shared awareness of the proper sequences of behaviors, both psychomotor and mental, the relative importance or hierarchy of subtasks, and knowledge of the tools and techniques required to perform the task. For instance, teams conducting a terrorist training exercise should know whether to look first for possible dangers (e.g., terrorists or bomb devices) or to remove hostages. The third category of SMMs concerns the Personnel on the team. This category involves awareness of team members’ role responsibilities, including who performs specific sub-tasks and who has final authority on the team. Collectively, these three types of SMMs have a direct and explicit relationship to the main goal of the AAR, that being to identify what happened previously, why the events happened, and how to improve future performance. To address these issues, teams must possess some similar ideas about the purposes and procedures involved in the task and the responsibilities of each team member. The fourth category, Interpersonal SMMs, encompasses awareness of how the team interacts, and each team member’s individual attributes. In other words, similar to CannnonBowers et al.’s (1993) descriptions of team interaction and team SMMs, Interpersonal SMMs contain knowledge about communication and information flow and each team member’s knowledge of their teammate’s knowledge, skills, attitudes, preferences and tendencies. Unlike the previous three SMM types, Interpersonal SMMs are not necessary to the AAR process, but likely play a facilitative role. If one knows, for example, that his or her teammate has difficulty remembering the procedural events to disarm a gas canister during a VE mission, this individual 27
may chose to spend more time during the AAR running through the correct steps, thereby building a more solid Procedure SMM, and focus less on purpose or personnel issues. In summary, four types of SMMs are relevant in the current study, as illustrated in Figure 5.
Shared Mental Models
Purpose
Procedures
Personnel
Interpersonal
Figure 5: Types of Shared Mental Models Evaluated in Current Study
The benefits of SMMs to performance continue to gain support in the team literature, although a great deal more research is needed. For instance, team coordination in disaster situations depends on a SMM between teams and agencies. Smith and Dowell (2000) analyzed interagency coordination in response to a railway accident and found that coordination deficits were partly related to difficulties in constructing SMMs of the distributed decision-making process between agencies. Teams with greater similarity in their SMMs also appear to work better under stressful conditions. As part of the US Navy’s research on Tactical Decision Making Under Stress (TADMUS), in which five-person teams performed exercises in a simulated shipboard combat information center (CIC), Serfaty, Entin, and Johnston (1988) concluded that under high workload and stress, high-performing teams used different coordination strategies and were better at adapting to situations than low-performing teams. Part of this adaptation process involved the development of shared situational mental models of the task environment, and 28
mutual mental models of the team members’ tasks and abilities. They argued that “teams who develop a high level of congruence between their mental models—both situational and mutual— are able to make use of these models to anticipate the way the situation will evolve as well as the needs of the other team members.” (p. 222). Similar to Serfaty et al. (1988), Mathieu et al. (2000) evaluated SMMs corresponding to the task and the team members. In their study of twoperson teams completing a computer-based, flight combat simulation, SMM’s of the team (e.g., team interactions and member attributes) were significantly related to team performance, but the relationship was mediated by team processes such as coordination, cooperation, and communication. Task SMMs, on the other hand, were not directly correlated with team performance, but did show an indirect effect on performance via their influence on team processes. Mathieu et al.’s (2000) findings highlight an important consideration in the context of the present study; how communication affects SMM development. Common sense dictates that increased communication between team members would lead to greater similarity in SMMs, and several recent studies supports this position. Orasanu (1990) compared communications for low and high-performance flight crews. Results indicated that high-performance crews produced more communications concerning plans and strategies, interpreted by Orasanu as indicative that an SMM was developed when the crews in the high-performing teams shared their plans through communication. Furthermore, additional communication is needed to update SMMs as the team’s situation changes (Orasanu & Fischer, 1992). Additional research by Stout et al. (1999) examined communication during pre-mission planning and the degree of closeness between team members’ mental models of their teammate’s informational requirements for a series of surveillance and defense missions in a helicopter simulation. In their study, two-person teams completed a 45 min planning phase in which team 29
members pooled individually-held information (via experimental manipulation, each team member had information not available to the other team member) and planned how to handle certain contingencies in the mission phase. Teams were then categorized as high or low on planning quality and compared on SMMs, the amount of information team members provided in advance of events without having to be asked, and the number of errors made during the mission. Planning quality was based on how well the team created an open environment, set goals and realized the consequences of errors, exchanged preferences and expectations, clarified roles and information to be passed in the missions, clarified sequences and timing, planned for unexpected events, realized how high workload affects performance, pre-prepared information, and exhibited self-correction. As hypothesized, teams with higher quality planning developed more similar mental models of each other’s information requirements, provided more information in advance, and made fewer errors, than low-quality planning teams. Furthermore, teams who provided more information in advance performed at a higher level than teams with low levels of advance communication. Interestingly, however, more similar mental models of information requirements were not related to higher rates of advanced communication. To summarize, Stout et al. (1999) showed that teams who do a better job of planning for upcoming tasks by sharing information and developing contingency plans exhibit more similar mental models, more efficient communication during task performance, and make fewer errors than teams with poor planning. Accordingly, communication during planning phases, similar to the AAR, appears to be a vital part of SMM development and maintenance, and also team performance. What remains unclear is how different communication modalities (e.g., FTF, voice-only, text-based), affect SMMs, and consequently overall team performance. More specifically, little is known about the relationship between communication and SMMs, specifically during AARs. 30
Stout et al. (1999) examined pre-mission planning, and Mathieu et al. (2000) did not provide AAR-type feedback to their participants, “...in order to maintain experimental control and to test whether experience alone would act to align members’ mental models.” (p. 280). This point is addressed later in the discussion of FTF and voice-only communication modalities.
Cohesion A second factor that is likely to influence the AAR process is the level of team cohesion. A plausible position is that teams whose members are similarly committed to the task of the AAR—identifying previous errors and generating solutions—and to each other on an interpersonal level, would obtain greater benefits from the AAR, and thus enhance future performance, over teams with less commitment to the task and each other. Support for this view, however, is minimal as a majority of cohesion research has focused on performance in general, not how cohesion affects the team learning process specifically. Nevertheless, some insight is obtained from reviewing what is known regarding cohesion and performance, and then drawing parallels to team learning. Despite decades of research, the relationship between cohesion and team performance remains vague (Mathieu et al., 2000; Mudrack, 1989). Early efforts (e.g., Steiner, 1972; Stogdill, 1972) concluded that group productivity and cohesiveness were not clearly related. Later research (e.g., Miesing & Preble, 1985; Mullen & Copper, 1994; Strupp & Hausman, 1953; Zaccaro, Gualtieri, & Minionis, 1995) showed support for a cohesion-performance effect, but others argued that the effect was often moderated by additional variables (e.g., Evans & Dion, 1991; Gully, Devine, & Whitney, 1995; Langfred, 1998; Tziner & Vardi, 1982). The current view is that cohesion does have some influence over team processes and how well a team 31
performs, but that the effect is often small and dependent on other variables. Additional support for the importance of cohesion comes from the fact that often-cited models of teamwork include elements related to and analogous with cohesion. Dickinson and McIntyre (1997), for example, highlight the importance of cohesion in their team orientation, backup, and team coordination dimensions, described previously. Team orientation, for example, referring to attitudes team members have toward each other and the team task, is analogous to the concepts of interpersonal and task cohesion. Likewise, Cannon-Bowers et al. (1995) list team cohesion as one of the teamcontingent competencies necessary for performance. These models, therefore, suggest that cohesion plays a role in team processes and performance, still the specific relationship between cohesion and performance remains elusive. A portion of this difficulty is attributable to the lack of an agreed-upon definition of the concept. Definitions of cohesion fall into one of two categories, unidimensional or multidimensional. Festinger’s (1950) early description was multidimensional; “Cohesiveness of a group is here defined as the resultant of all the forces acting on the members to remain in the group. These forces may depend on the attractiveness or unattractiveness of either the prestige of the group, members in the group, or the activities in which the group engages.” (p. 274). In other words, cohesion was seen to result from three sources: group prestige, interpersonal attraction, or attraction to the group’s tasks. Researchers in the 1950s and 1960s (e.g., Schachter, 1951), citing that Festinger’s three components were highly correlated with one another and therefore not different enough to justify a multidimensional definition, shifted to a unidimensional definition (Mullen & Copper, 1994). Cartwright (1968, as cited in Fleishman & Zaccaro, 1992), for example, defined cohesion simply as the degree to which group members desire to remain in the group. More recently, definitions have shifted back to a multidimensional description (e.g., 32
Brawley, Carron, & Widmeyer, 1987; Carron & Brawley, 2000; Copeland, & Straub, 1995; Mullen and Copper, 1994; Zaccaro, 1991). Langfred (1998) conceptualized cohesion as the degree to which group members feel a part of the group and their desire or motivation to remain in the group. In a military context, Siebold and Kelly (1988) posited that cohesion “...is a unit or group state varying in the extent to which the mechanisms of social control maintain a structured pattern of positive social relationships (bonds) between unit members, individually and collectively, necessary to achieve the unit or group’s purpose.” (p. 1). According to their model, units or groups have three types of bonds: 1) horizontal (relationships between peers), 2) vertical (relationships between leaders and subordinates), and 3) organizational (relationships between unit members and their unit as a whole). Furthermore, each bond type has an affective aspect, referring to feelings or emotions, and an instrumental aspect, referring to the group’s task. Additional multidimensional definitions outline a three-part model of cohesion. Driskell and Salas (1992), argued that “...cohesiveness is most accurately defined as a group property that binds members to the group, and which has three primary bases: mutual attraction, coordinated or interdependent behavior, and shared beliefs.” (p. 119). Mullen and Copper (1994) based their meta-analysis of the cohesion-performance effect on Festinger’s (1950) three-component model of commitment to the task, group attractiveness, and group self-respect or pride. Furthermore, several authors (e.g., Carless & De Paola, 2000; Knouse, Smith, & Smith, 1998; Zacarro & Lowe, 1988; Zaccaro et al., 1995) have begun differentiating between the social or interpersonal aspects of cohesion, and aspects related to the group task. Interpersonal cohesion includes dimensions such as interpersonal attraction, and the intensity and positive nature of relationships (Carless & De Paola, 2000; Zacarro & Lowe, 1988; Zaccaro et al., 1995). Task cohesion, in contrast, refers to the attraction or commitment to the group and task. Task-cohesive groups also 33
“...care about the success of other group members because their own goal attainment is often inextricably bound to the collective achievement. They will exert strong effort on behalf of the group and their fellow members to facilitate group processes.” (Zaccaro et al., 1995, p. 79.). In the context of sports teams, Carron and Brawley (2000; c.f., Brawley, Carron, and Widmeyer, 1987) distinguished between the task and social (i.e., interpersonal) elements of cohesion, as well as individual and group level elements of cohesion. In their model, Group Integration (GI) beliefs reflect individual team member’s perceptions about the similarity, closeness, and bonding within the group and the degree of unification. Individual Attractions to the Group (ATG), on the other hand, refer to the individual’s personal motivations to remain in the group and his or her personal feelings about the group. GI and ATG are further broken into beliefs regarding the task (GI-T, ATG-T) and the social situation (GI-S, ATG-S). Beliefs about the task include perceptions of group unification around the task (GI-T) and one’s personal involvement with the group task, productivity, and goals (ATG-T). Social beliefs, in contrast, concern perceptions of group unification as a social unit (GI-S), and one’s perceived level of acceptance and social interaction with the group (ATG-S). This model, operationally defined in the Group Environment Questionnaire (GEQ) (Brawley, Carron, and Widmeyer, 1987) has shown promise as a way to conceptualize and measure cohesion for competitive sports teams (e.g., Boone, Beitel, & Kuhlman, but there are concerns about the validity of the GEQ outside this context (Carless & De Paola, 2000; Carron & Brawley, 2000). A comparison of the psychometric qualities of the GEQ for work teams led Carless and De Paola (2000) to argue for a three-factor model of cohesion. The model uses a similar distinction between task and interpersonal cohesion, but adds a third component specifically addressing interpersonal attraction. They define group cohesion as the combination of task 34
cohesion, the degree of commitment to the task, social cohesion, the extent to which group members interact socially, and individual attraction, the extent to which group members see the group as attractive and want to be a part of the group. Overall, two main dimensions of cohesion repeatedly emerge from the literature: task cohesion and interpersonal cohesion. For purposes of the present study, cohesion is hereinafter defined as the combination of task cohesion, referring to the degree to which group or team members are committed to the task, and interpersonal cohesion, the degree to which individuals are attracted to each other and have positive relationships (see Figure 6).
Cohesion
Task Cohesion
Interpersonal Cohesion
- task commitment
- interpersonal attraction - positive relationships
Figure 6: Components of Cohesion
Returning to the cohesion-performance effect, with this model as a framework, findings are mixed regarding the role of cohesion in team or group performance. The lack of a common cohesion definition in the literature has hampered efforts to study the cohesion-performance effect and generalize findings from one domain to another (Mudrack, 1989). On this point, Mullen and Copper (1994) argued that “...any effort to provide an integration of research on the 35
cohesiveness-performance effect must carefully scrutinize the construct of group cohesiveness.” (p. 214). For example, nearly 30 years ago, Stogdill (1972) found, in his review of 34 studies, that roughly a third of the studies showed cohesive groups to be more productive, a third reporting cohesive groups were less productive, and the remaining third showing no difference. However, as reported by Mudrack (1989), none of the studies referenced by Stogdill used the same definition for group cohesion, and many made no attempt to even measure cohesiveness. Mudrack also examined more recent cohesion research and found similar weaknesses, with most authors providing no explicit definition of the concept. Furthermore, there is no apparent standard of measurement for cohesion, with techniques ranging from measuring the amount of conversation within a team (Bakeman & Helmreich, 1975) to scales varying in size from two (Narayanan & Nath, 1984) to 31 items (Miesing & Preble, 1985). Mudrack (1989) concluded, “The remarkable inconsistency in the measurement of cohesiveness raises justifiable concerns as to whether research findings can be meaningfully compared across studies.” (p. 775). Caution is therefore warranted when interpreting the results of cohesion-performance research, yet evidence remains to suggest that cohesion plays some role in how a team interacts and performs. In general, there is support for the benefit of cohesion to team or group performance (e.g., Miesing & Preble, 1985; Strupp & Hausman, 1953; Toquam et al. 1997; Van Zelst, 1952; Wellington & Faria, 1996; Zaccaro et al., 1995), but a specific type or component of cohesion is typically responsible for the significant results. Zaccaro and colleagues, for example, have examined group performance and task and interpersonal cohesion in a series of studies. One study (Zaccaro, 1991) evaluated four possible outcomes of group cohesion: 1) group performance processes, task-related interactions such as information exchange, planning, and coordination; 2) role uncertainty, when organizational roles are either unclear; 3) absenteeism, 36
failure to attend group or organizational activities; and 4) individual performance, which in that study was defined as “...the degree to which cadets successfully completed personal duties or responsibilities.” (p. 390). Task and interpersonal cohesion were then correlated with measures of the four outcomes. Results showed that both cohesion types were positively related to group performance processes, but that only task cohesion was related to role uncertainty, absenteeism, and individual performance. This research did not, however, examine how cohesion directly affects group or team performance. In the case of group performance, a majority of authors cite task cohesion as the critical component in the cohesion-performance effect. Task cohesion has been related to better performance for teams making decisions under temporal stress (Zaccaro et al., 1995), and work teams at Australian public sector retail stores (Carless & De Paola, 2000). In addition, Mullen and Cooper (1987) conducted a meta-analysis of over 30 years of literature on the relation between cohesion and performance. Based on a three-dimensional model of cohesion, patterned after Festinger’s (1950) definition, only task commitment exhibited a significant positive relationship with performance in both experimental and correlational research, whereas group attractiveness (i.e., interpersonal cohesion) and pride were not related. Gully et al. (1995) challenged this conclusion on the grounds that too few studies exist on task and interpersonal cohesion, particularly for different types of tasks. More recent research, however, lends support to Mullen and Copper’s (1987) findings that task cohesion is more important to group performance, but only for certain types of tasks. On additive tasks (Steiner, 1972), for which individual efforts are combined to complete an overall group task, Zaccaro and Lowe (1988) found that high task cohesion increased performance, and that interpersonal cohesion had no effect. The authors qualified this finding, 37
however, arguing that high interpersonal cohesion increased both commitment to the task (task cohesion) and levels of non-relevant conversation between group members, and that these two variables effectively cancelled each other out. In other words, the effect of interpersonal cohesion on group performance was mediated by task commitment and group interactions. Greater interpersonal cohesion increased task commitment, and this had a positive effect on group performance, but with more interpersonal cohesion came a greater frequency of group interactions. On the additive tasks, for which successful group performance required members to exert maximum individual effort on the task, while minimizing distracting interactions that interfere with individual tasks, increased group interaction communication was a hindrance. Such is not the case with disjunctive tasks for which group members must work together to produce a collective product. Zaccaro and McCoy (1988) had groups rank 15 items in order of importance to group survival in a simulated survival situation task. Results indicated that high task and high interpersonal cohesion groups outperformed groups either high on one type but low on another, or low on both types. For disjunctive tasks, Zaccaro and McCoy (1988) noted, “High task-based cohesion increases the likelihood that high ability members will contribute to the group problem-solving, whereas high interpersonal cohesion facilitates the procurement, recognition, and acceptance of high quality contributions.” (p. 846). In addition, betterperforming teams competing in a complex business simulation game, a disjunctive-type task, were more cohesive, as represented by higher scores on measures of interpersonal and task cohesion (Miesing & Preble, 1985). The authors maintained that cohesive teams “...are better performers because they are able to satisfy the social needs of the team members while simultaneously demonstrating a shared commitment to the team task.” (p. 336).
38
Despite the apparent support that task cohesion, and to a lesser extent, interpersonal cohesion, positively influence team and group performance, part of the difficulty in defining the cohesion-performance effect is attributed to the influence of moderator variables. Evans & Dion (1991), in their meta-analyses of over 372 groups, showed group cohesion led to increased performance, however the effect was relatively small and appeared to depend on other factors. One example is Tziner and Vardi’s (1982) finding that performance for 3-person tank crews was only correlated with effectiveness and cohesiveness, defined in their study as the degree of social and emotional dependence and attraction in the group (i.e., interpersonal cohesion), when studied in combination with the command style of tank commanders. Highly cohesive teams exhibited better performance only if the command style emphasized an orientation toward the task and the team members. For command styles only emphasizing team member orientation, low cohesiveness was related to better performance. Similarly, Porter and Lilly (1996) compared team cohesion, trust, conflict, and task processes for groups completing a simulated business marketing exercise. Results did not show a direct association between task cohesion and performance, however they argued that task cohesion, along with team trust, are “...important variables to consider, not because of their direct influence on performance (they appear to have little impact when the effects of conflict and task processes are taken into account), but because they influence other important interaction characteristics (conflict, task processes).” (p. 372). Still another perspective is that cohesion is associated with performance, but that high levels of team cohesion may negatively affect a team, as in the case of group-think, or for teams whose norms do not support productivity (Driskell & Salas, 1992; Porter & Lilly, 1996). If the predominate group norm is a slow work pace, cohesiveness might actually reduce performance.
39
Similar to the effect of moderator variables, another complicating factor in studying the cohesion-performance effect is determining which comes first. There remains significant controversy over the causal nature of the relationship. In the sports domain, Landers, Wilkinson, Hatfield, and Barber (1982) commented, “Even when the same measuring instruments are employed for interacting team sports, some studies demonstrate a reciprocal causality between the two variables (i.e., cohesion affects performance outcome and vice versa), whereas other studies find that performance outcome affects cohesion, but cohesion does not influence performance.” (p. 171). Strong support for both positions has led to the development of two competing theoretical models in the sport cohesion literature. On one side, authors contend that improved performance leads to increased cohesion, but not the other way around (Bakeman & Helmreich, 1975, Carron & Ball, 1977). On the other side, studies have shown that both directions are plausible (Williams & Hacker, 1982) with no causal relationship indicated. In summary, despite methodological differences between cohesion-performance studies, the influence of moderator variables, and disagreement over the direction of the relationship, several conclusions are possible. First, both task and interpersonal cohesion may improve performance (Miesing & Preble, 1985) and group processes (Zaccaro, 1991), but task cohesion more consistently predicts performance (e.g., Carless & De Paola, 2000; Mullen & Copper, 1987; Zaccaro & Lowe, 1988; Zaccaro et al., 1995). Second, on additive-type tasks, high interpersonal cohesion can have a negative effect on performance due to more non-task relevant conversations between team members, but high levels of both task and interpersonal cohesion can benefit performance on disjunctive tasks. What these studies do not demonstrate, however, is how team cohesion affects overall team learning, or the different phases in the team learning cycle. Considering the AAR specifically, it appears that both types of cohesion should influence 40
a team’s ability to identify errors and develop plans for future performance. The AAR is considered a disjunctive task because team members work together to debate what happened in previous missions and to develop a common plan for future missions. Accordingly, both task and interpersonal cohesion should factor into how well teams utilize the AAR. It remains to be seen, however, how communication modality alters the development of task and interpersonal cohesion, and subsequently, how communication will affect AAR performance. I return to this point in subsequent sections.
Trust A third factor with the potential to mediate the AAR process is the level of team trust. Definitions of this team factor vary by domain. In the Industrial/Organizational (I/O) psychological literature, trust is commonly referred to as the degree to which someone can be counted on to perform to expectations (Porter, 1997), or a willingness to rely on another in whom one has confidence (Moorman, Deshpande, & Zaltman, 1993). Others (e.g., Butler & Cantrell, 1984) argue trust, like cohesion, is multidimensional construct with at least five components: integrity, competence, consistency, loyalty, and openness. In the general team context, CannonBowers et al. (1995) stated, “Mutual trust can be defined as an attitude held by team members regarding the aura or mood of the team’s internal environment. It connotes an atmosphere where the opinions of team members are allowed to emerge, where members are respected by their coworkers, and where innovative proactive behavior is rewarded.” (p. 356). These definitions have relevance to virtual teams, however an important distinction has been made by McAllister (1995), and later refined by Rocco and her colleagues (Rocco, Finholt, Hofer, & Herbsleb, 2000; Rocco et al., 2001), regarding trust and geographically distributed 41
teams. These authors contend there are two primary trust dimensions in virtual teams: emotional and cognitive trust. Emotional trust refers to “...the development of non-calculative and spontaneous emotional bonds and affect among two or more people, and is demonstrated through confidence and openness in sharing ideas, feelings and concerns.” (Rocco et al., 2000, p. 2). Emotional trust is critical to the development of communal relationships within a team, or relationships typified by sensitivity to the needs of coworkers and the “orientation to support these needs with no demand of reciprocation.” (Rocco et al., 2000, p. 2). Cognitive trust, in contrast, refers to judgments of reliability and competence about coworkers. Reliability judgments are typically based on a congruence between words and actions, such as a teammate who always fulfills obligations or meets deadlines (Rocco et al., 2000), whereas competence stems from instances of predictably professional or skilled behavior. Cognitive trust is an essential part of team performance. Rocco et al. (2001) explain, “In work settings, cognitive trust is important to the extent that it allows people to count on others to provide promised contributions to a project according to agreed upon plans and schedules. Without this confidence, workers must invest additional effort in monitoring co-workers.” (p. 12). This two-dimension definition of trust is ideally suited for the present study. In the Cannon-Bowers et al. (1995) model of team competencies, trust is categorized as a team attitude. Therefore, combining the findings of Cannon-Bowers et al., Porter (1997), and Rocco et al., (2000, 2001), trust is hereinafter defined as an attitude held by team members regarding the emotional closeness with, and reliability and competence of, another team member. Like for SMMs and cohesion, there exist few empirical investigations of how trust affects the team learning process, particularly AAR activities. Extensive research does indicate the 42
importance of trust for team processes and performance, (e.g., Dirks, 2000; Jones & George, 1998; Porter & Lilly, 1996; Spreitzer, Noble, Mishra, & Cooke, 1999), yet a clear trustperformance connection is often obscured by the fact that many team factors collectively impact performance. In other words, trust generally works in concert with other dimensions such as interpersonal and task cohesion. A case in point is the finding of Spreitzer et al. (1999) that higher levels of trust, empowerment, conflict resolution skills, and recognition were all related to team involvement. Team involvement, subsequently, was associated with higher levels of performance, in conjunction with greater role clarity on the team and better access to information. Similarly, Porter and Lilly (1996) concluded that trust has only an indirect relationship with team performance. In their study, trust was positively correlated with group task commitment and task processes, and negatively correlated with group conflict, but was not directly related to performance. In other words, trust influences factors that ultimately affect team performance, but does so in a circuitous manner. A stronger link between trust and team performance has been realized in a number of studies specifically investigating how communication modalities influence trust development in teams (Bos et al., 2001; Rocco et al., 2000; 2001; Zheng et al., 2001). Evidence suggests the absence of FTF communication hinders the development of team trust, and that this has an indirect negative effect on team performance. This conclusion, however, has yet to be tested in an immersive VE with distributed teams. Furthermore, there is little research that has attempted to look at how trust affects team learning, or for team processes and activities during an AAR. Before addressing these issues, and those related to SMMs and cohesion, I briefly outline the overall importance of communication to team performance, the major differences between FTF
43
and voice-only communication, and then describe how communication modality might specifically affect SMMs, cohesion, and trust.
Communication and Team Performance In the team context, communication is the “active exchange” of information between two or more team members, or “an individual team member providing information to others in an appropriate manner” (Dickinson & McIntyre, 1997, p. 21). A great volume of research shows that communication is the most essential dimension of team performance (Bowers, Jentsch, Salas, & Braun, 1998; Cannon-Bowers & Salas, 1997; Dickinson & McIntyre, 1997; Morgan, Salas, & Glickman, 1993; Prinzo, 1998). Recall that in Dickinson and McIntyre’s (1997) team model (Figure 4), communication serves to connect all the other components of teamwork. The importance of communication, as well as the interdependency and collaboration inherent in team work demands that members be able to communicate without obstruction or delay (Achille, Schulze, & Schmidt-Nielsen, 1995). Although some have argued the relationship between communication and teamwork is unclear (e.g., Stout, Salas, & Fowlkes, 1997), the literature offers many illustrations to support that when communication breaks down, poor team performance and the potential for significant errors often results. Support for this relationship comes from research in a variety of domains including medicine (Sexton, Thomas, & Helmreich, 2000), aviation (Kanki & Foushee, 1989; Foushee, 1982; Orasanu, Davison, & Fischer, 1997), and human spaceflight (Cohen, 2000; Kanas, & Caldwell, 2000). Poor communication also contributed to the slow response of law enforcement in the hours following the Columbine High School shooting in 1999. Police, SWAT teams, and emergency medical personnel poorly coordinated their communication and as a result, injured victims, like teacher Dave Sanders, laid 44
for hours without medical assistance, even after both shooters had killed themselves (Columbine Review Commission, 2001). Sanders died before medical personnel could treat him. Poor team communication can occur for many reasons, from poor verbal skills on behalf of team members to excessive amounts of background noise. Researchers have also evaluated how different modes of communication affect team processes, and the implications for performance (e.g., Dubrovsky, Kiesler, & Sethna, 1991; Hammond, Harvey, & Koubek, 2000; O’Malley, Langton, Anderson, Doherty-Sneddon, 1996). Indications thus far suggest communication modality, particularly the degree of visual or FTF contact, affects how a team interacts and their subsequent performance on certain types of tasks. In a DIVE team, where reduced FTF interaction can slow or degrade communication, many team processes may therefore be negatively affected. It is unclear, however, which processes are more susceptible to the absence of FTF communication.
Communication Modality Differences Chapanis and colleagues (Chapanis, 1975; Chapanis, Ochsman, Parrish, & Weeks, 1972; Chapanis & Overbey, 1974; Weeks & Chapanis; 1976) conducted some of the earliest research on communication modality and team performance. Their original motivation was to gain knowledge about human-human communication in order to design successful interactive computer systems. This included understanding how humans naturally communicate with one another, and the extent to which natural communications are affected by different communication devices. In a series of studies on cooperative behavior carried out at Johns Hopkins University, Chapanis and his associates compared four communication channels: voice, handwriting, typewriting, and video, this last channel referring only to visual images and not 45
audiovisual video. These four channels were then tested in various combinations they called “modes” and compared these against a baseline of unrestricted, FTF communication, which they called a “communication-rich mode.” (Chapanis, 1975, p. 36). Results indicated significant differences between the communication channels and modes and team behaviors and performance. I return to these findings later when discussing communication modality and team processes in the AAR. A guiding principle for the Hopkins studies, and other research on communication modality (e.g., Carey & Kacmar, 1997; Hammond et al., 2000) was that voice-only, handwriting, typewriting, or video communication channels are fundamentally different from FTF communication. Before exploring how modality affects teams, I first compare different communication modalities or channels. Williams (1977) summarized three theoretical explanations for how communication channels differ with regard to the bandwidth of the channel, the functions of nonverbal cues, and the immediacy or “social presence” of the channel. First, communication channels may differ because of variations in the communication bandwidth, leading either to frustration, if the information transfer is insufficient, or added efficiency if only task-relevant information is transferred and redundant or irrelevant information (e.g., gossip) is reduced. This theory is based on the idea that the bandwidth of the communication channel between two or more persons decreases, based on the number of senses used, as one moves from FTF to more restricted channel types (see Figure 7). FTF communication, for example, typically involves visual and auditory information, and to a lesser extent tactile and olfactory cues, depending on the proximity of people engaged in a conversation or task. Ciolek (1982) described how humans have a series of 5 concentrically nested spaces or zones within which they can detect the presence of others. His theory, based on naturalistic 46
observations, posits that the 5 circles coincide with the ranges (in yards) of effectiveness of human senses: vision (100), hearing (33), smell (10), touch via the use of tools (33), and direct tactile contact (1). According to this theory, absence of one or more sensory cues in more restricted channels (e.g., audio-only, video-only), can modify communication exchanges in subtle, yet significant ways.
Communication Mode
Sensory System Involvement
Face-to-Face
Visual, Auditory, Tactile, Olfactory
VIDEO/AUDIO
VISUAL, AUDITORY
AUDIO ONLY
AUDITORY
VIDEO ONLY
VISUAL
TEXT-BASED
VISUAL
Figure 7: Communication Bandwidth and Sensory System Involvement
A second way in which communication channels differ is in their capacity for nonverbal communication. Nonverbal communication has received ample attention in the social and psychological literature with relevant findings for how people interact in social and teamwork situations. Weeks and Chapanis (1976) distinguished between two types of nonverbal
47
communication: vocal and nonvocal. Vocal nonverbal communication refers to the paralinguistic cues such as inflection, volume, and pacing that are conveyed in spoken communication. Nonvocal, nonverbal communication, on the other hand, refers to all other behaviors that are dependent on visual communication, including facial expressions and gaze, body language (e.g., gestures, posture, movement), and touching, which Baron and Byrne (1994) label the most intimate nonverbal cue. A third difference between communication modalities takes into account a more global perspective of the communication process in that modalities are presumed to alter how people perceive one another. This theory posits that each modality has a different degree of “social presence” which affects how people treat others (Short, Williams, & Christie, 1976). Williams (1977) described, “The common concept seems to be that while face-to-face we see others as real social beings, with individual personalities, wishes, feelings, and aspirations; over the more distant media, such as the telephone or teletypewriter, we treat others more like semi-mechanical objects, which can be ignored, insulted, exploited, or hurt with relative impunity.” (p. 972). With these theoretical explanations in mind, I now summarize literature on how communication modalities, particularly comparisons between FTF and less communication-rich formats, affect interpersonal processes that are critical to team performance, paying special attention to the development of SMMs, cohesion, and trust. This discussion is organized around Williams’ three categories of how communication channels vary: communication bandwidth, nonverbal cues, and social presence.
48
Modality Effects on Team Processes William’s (1977) assertion that communication bandwidth narrows when moving from FTF communication to other modalities, thereby decreasing the number of available sensory channels, suggests that the loss of certain channels could have a negative effect on team processes. Few studies have directly tested this hypothesis, but early indications support this view. Research on mental workload and communication is one example. Mental workload, the cognitive demands placed on an individual by a task or set of tasks (Sanders & McCormick, 1993), is often a critical component for team processes and performance (Urban, Weaver, Bowers, & Rhodenizer, 1996). To test how communication modality affects mental workload, Hammond et al. (2000) compared two-person teams working on a collaborative task in three different modalities: FTF, video and audio, and audio only. Teams were comprised of one electrical engineering student and one industrial engineering student and their task was to design a product, outline the manufacturing process, and present their ideas as design deliverables. All teams shared workspace through collaborative software, but were located either locally (FTF), or in separate rooms. Mean workload scores decreased from video/audio to audio to FTF, with FTF teams reporting significantly different levels than the two distributed teams. Similar findings were reported for teams working either FTF or through computer-mediated electronic conferences (Carey & Kacmar, 1997). Additional support comes from research showing the importance of sensory channels, only available in FTF communication, for social interactions. Touch, for example, has been shown to increase interpersonal attraction and positive evaluations of others (Crusco & Wetzel, 1984; Hornik, 1991), as well as increase helping behavior (Patterson, Powell, & Lenihan, 1986). I return to tactile cues in the discussion on nonverbal communication. In a similar manner, 49
pleasant and unpleasant olfactory stimuli often serve as important social cues, particularly for mixed gender interactions. Males, who interacted with a females who were either wearing perfume or no perfume, and were dressed informally in jeans and a sweatshirt, or formally in a blouse, skirt, and hose, reported increased attraction toward the females and exhibited positive shifts in perception on several traits when the women wore perfume and were dressed informally (Baron, 1981). Interestingly, the opposite was true for females wearing perfume, but dressed formally. This finding suggests that the dimension of informality-formality has a moderating effect on olfactory cues (Baron, 1981). Unpleasant odors also appear to have a significant affect on interpersonal interactions and perceptions of others (Wrzesniewski, McCauley, & Rozin, 1999). Persons with severe body odor, for example, are evaluated differently than those without, but this difference is often mediated by the sex of the person, and whether or not the individual is aware of his or her odor (Levine & McBurney, 1977). There is evidence, therefore, that as communication channel bandwidth decreases, sensory awareness also decreases, and this can have a negative effect on interpersonal attraction, perceptions of others, and likelihood that people will offer assistance. Such limitations have led some (e.g., Albertson, 1977) to question the acceptance of technology-mediated communication as a psychologically acceptable substitute for FTF communication. Similar findings exist for communication modality differences with regard to the functions of nonverbal cues. In the context of communication, nonverbal cues play an important facilitative role (Palmer, 1995; Weisband & Atwater, 1999). Knowing when to speak during a conversation, for example, or recognizing if a listener is actually paying attention, often depends on visual contact (Heath & Luff, 1991; Scherwitz & Helmreich, 1973). Head nods, body posture, and movement of the lips all serve to indicate who is talking, when they have finished, and 50
provide clues as to the content of the conversation (Duncan, 1972; Duncan & Niederehe, 1974). Research comparing FTF and audio-only communication has revealed that people use visual cues to judge if communication is proceeding smoothly and therefore need to ask for verbal feedback less often than those without FTF contact (Doherty-Sneddon et al., 1997). On this point, Cohen (2000) argued that movements of the face and mouth, termed visemes, help people clarify spoken words when auditory information is masked by noise. Nonverbal communication can also send messages that spoken words do not. Paralinguistic cues, such as a speaker’s tone of voice, are often more influential in conveying a speaker’s attitude than the content of his or her message (Mehrabian & Wiener, 1967), suggesting that some information is lost in text-based communication modes like electronic mail. In addition, gestures, including emblems—body movements that carry specific meanings (e.g., a circle formed with the thumb and index finger to signify everything is “Okay”)—and hand gestures are often used in FTF communication for emphasis or clarification of spoken words. In communication modalities that inhibit or mask gestures, coordinated behaviors between persons become more difficult. In the case of audiovideo modes (e.g., video conferences), Heath and Luff (1991) commented, “Despite having the facility to witness a co-participant’s visual conduct, however, it is interesting to note that many actions which are performed nonverbally do not achieve sequential performative significance in the interaction. In particular, gestures and other forms of body movement including gaze, which are systematically employed in face to face communication by speakers to organize how the ‘recipient’ participates, proves in large part ineffectual.” (p. 101). Although some evidence suggests that the effects of gestures are generally small for aiding the comprehension of spoken messages (e.g., Graham & Argyle, 1975; Krauss, Morrel-Samuels, & Colasante, 1991), and are open to significant gender and cultural variation (Krauss et al., 1991; Kring, 2001), there is 51
greater support for the benefits of nonverbal behaviors in interpersonal communication. In nonFTF interactions, paralinguistic cues, body movement, and gestures that potentially serve to facilitate and smooth communication exchanges are absent, possibly disrupting communication efficiency. Nonverbal communication has also been shown to affect social interactions and the degree to which people are attracted to and will help one another (Zander & Havelin, 1960). Eye contact, or gaze, has a positive effect on degree of liking between persons (Kleinke, 1986) and compliance with legitimate requests for help (e.g., borrowing money to make a phone call versus money for gum, Kleinke, 1980). Examples include Burgoon, Manusov, Mineo, and Hale’s (1985) finding that in a simulated job interview, participants were more likely to hire and rate as credible and attractive interviewees who maintained a normal or high degree of eye gaze during the interview than those who averted gaze. An earlier study by Scherwitz and Helmreich (1973) revealed similar results. These authors compared levels of eye contact, a major component of FTF communication, and participant reports of interpersonal attraction in a series of studies. In three studies, participants interacted with another participant (actually a video-taped confederate) via a videophone. For example, in the first study, the experimenter asked the confederate to verbally report his first impressions of the participant, and then the participant did the same for the confederate. Unknown to the participant, the experimenters had manipulated these evaluations such that participants heard positive, negative, or mixed evaluations of themselves. Furthermore, the amount of eye contact from the videotaped confederate was also manipulated to present either low, medium, or high eye contact. Results of this first study revealed an interaction between eye contact and evaluations. When given a high evaluation, participants liked the confederate most in the low eye contact condition, but the reverse was true in the low evaluation 52
condition where high eye contact resulted more liking. In the mixed evaluation condition, intermediate eye contact produced the best liking scores. Studies two and three by Scherwitz and Helmreich (1973) followed a similar procedure and included additional variables such as personal or impersonal confederate evaluations, varied confederate attractiveness, and participants grouped on levels of social competence. Again, eye contact had a significant, yet complex, affect on reports of attraction. High eye contact, for instance, coupled with personal positive evaluations (comments directed specifically at the participant vs. general comments about persons sharing the participant’s birth order), led to lower reports of attraction than participants receiving impersonal evaluations. Furthermore, in same-sex dyads, high eye contact resulted in less liking, possibly because increased intimacy between same-sex persons goes against norms about interaction distance (Scherwitz & Helmreich, 1973). The same-sex issue raised by Scherwitz and Helmreich (1973) may apply to interpersonal attraction, but research by Valentine (1980) suggests that at least in the case of female-female dyads, eye contact increases helping behavior. In a study based on the bystander effect first tested by Latane and Darley (1968), Valentine showed that women were more likely to lend assistance to a female victim, both when the victim was alone or if a passive observer was present, when the victim made eye contact. Valentine’s (1980) study also highlights that the effects of eye contact on interpersonal interactions, similar to touch, are moderated by several factors, particularly culture and gender. For instance, like Kleinke (1980), Valentine & Ehrlichman (1979) found that gaze increased helping behavior, but that the sex of the involved persons was critical. In their study, male or female confederates with their arm in a sling, approached men and women, dropped some coins, and then either looked or did not look at the 53
bystander. Gaze increased helping behavior only when both the confederate and the bystander were female, but decreased helping if both were male. The effects of eye contact, however, are not always positive and may depend on whether two people already dislike one another. Wellens (1987) noted that people become more nervous, as indicated by increases in heart rate, when asked questions by a disliked male confederate, compared to decreased heart rate when participants liked the confederate. Despite this finding, the majority of research indicates that eye contact, only possible during FTF communication, leads to more positive social interactions and increased likelihood to help another. FTF communication is also the only communication modality in which physical contact or touching can be expressed. As noted earlier, touch has been associated with interpersonal attraction, evaluations of others, and helping behavior. Baron and Byrne (1994) note that touch can suggest aggression, dominance, caring, sexual interest, or affection, depending on factors related to who does the touching (e.g., gender differences: Fromme, Jaynes, Taylor, & Hanold, 1989; Remland, Jones, & Brinkman, 1995), cultural norms for touching (McDaniel & Andersen, 1998; Remland et al., 1995), the nature of the physical contact (e.g., brief or prolonged), and the setting or environment. Touching has shown to induce positive interpersonal interactions if done in an appropriate manner and context. Restaurant servers, for instance, received higher tips, indicative of a positive reaction by customers, when they briefly touched patron’s hand and shoulder (Crusco & Wetzel, 1984). Similarly, shoppers who received a light touch on the arm when entering a bookstore shopped longer and rated the store higher than shoppers not receiving touch (Hornik, 1991). Touch also appears to increase helping behavior in some instances. Patterson, Powell, and Lenihan (1986) found that requests for help (scoring bogus personality inventories) were met with greater compliance when experimenters initiated touch during the 54
request. Although some research (e.g., Bohm & Hendricks, 1997) has failed to show a significant affect of touching on interpersonal behaviors, ample evidence suggest this nonverbal behavior, which is available only in FTF communication, alters interpersonal processes. To summarize, it appears that nonverbal behaviors, which are absent in audio-only and text-based modes of communication, play a role in several processes that teams may use to coordinate actions and perform a task. Nonverbal communication has been shown to facilitate communication exchanges, convey attitudinal elements in conversations, increase interpersonal attraction and helping behavior, and affect evaluations of others. It is worthwhile to note, however, that the effects of nonverbal behaviors are context specific and moderated significantly by gender (Fromme et al., 1989; Krauss et al., 1991) and cultural variation (Kring, 2001; LaFrance & Mayo, 1978). There is less empirical support for the notion that social presence fluctuates across communication modalities, however several findings suggest people act differently toward others depending on proximity, either physically or psychologically. Consider the findings of Milgram (1963; 1965) and his studies on obedience. One of his manipulations was the proximity of the “victim” to the participant to determine if this would have an affect on the level of electric shock administered by the participant. Results did in fact show that maximum shock levels increased the further the victim was from the participant (Milgram, 1965). In attempting to explain this finding, Milgram (1965) noted that in the remote condition, “...the victim’s suffering possess an abstract, remote quality...the victim is put out of mind...the victim is truly an outsider, who stands alone physically and psychologically” (pp. 63-64). Although the type of relationship used by Milgram is rarely seen in team interactions, the degree to which communication technologies and modalities “remove” one team member from 55
another, or have different levels of “social presence” (Short, Williams, & Christie, 1976), may have considerable influence over interpersonal interactions, particularly those involved in team processes. Williams summarized several studies (e.g., Stephenson, Ayling, & Rutter, 1976; Wilson & Williams, 1977) in which audio-only conversations were more depersonalized, argumentative, and narrow in focus than FTF conversations. Additional research suggest more social forms of communication, like FTF, facilitates the development of positive team bonds, thereby benefiting team coordination on various tasks. During simulated strike negotiations, for example, FTF teams were more likely to coordinate on a settlement early in the strike, resulting in higher joint gains, than teams whose members stood side-by-side (Drolet & Morris, 2000). A second experiment showed a similar effect for teams working either FTF or via telephone as they completed a conflict game similar to the Prisoner’s Dilemma game—a situation in which participants are questioned separately and they may either cooperate (neither confess) or compete (one confesses), thereby implicating or not implicating each other (Drolet & Morris, 2000). The consequences of more impersonal communication modalities are not equally severe across all task types. Recall that for additive group tasks, individuals work alone and their efforts are then combined with others to complete an overall group task. In these situations, communication modalities with less social presence would presumably have minimal effects on group or team processes. However, for tasks requiring extensive collaboration between team members, as in disjunctive-type tasks, depersonalized communication can have significant negative implications for team processes, including conformity and group cohesion (Williams, 1977). The preceding sections outlined the importance of communication modality to functions and processes that teams often rely on to perform at optimal levels. In contrast to voice-only or 56
text-based communications, the broad sensory bandwidth, the availability of nonverbal cues, and the relatively high social presence afforded by FTF contact facilitates communication, increases interpersonal attraction and helping behavior, helps transmit speaker’s attitudes, and improves perceptions of others. This discussion does not explicitly dictate, however, that FTF communication is necessary for quality team performance, or that communication modality affects team learning. This point is explored next, with specific attention toward how communication modality influences the AAR process in a team setting and the development of SMMs, team cohesion, and team trust.
Modality and Team Processes in the AAR Differences between FTF and less communication rich modalities affect communication efficiency, interpersonal relationships, and how people perceive one another. But what role does modality play during the team learning process, particularly during post-activity reviews of performance, and subsequently the quality of team performance? To address this issue, I first review general findings on communication modality and performance, and then focus on the team factors presumed to facilitate the AAR process, namely how communication differences impact SMMs, cohesion, and trust. First, there is evidence that visual access to a team member affects how quickly and accurately a team performs certain functions. In some cases, teams using visual modes of communication solve problems more quickly (Carey & Kacmar, 1997; Reid, Malinek, Stott, & Evans, 1996) and make better decisions (Hedlund, Ilgen, & Hollenbeck, 1998) than teams using non-visual communication modes. For example, a study on decision making revealed that teams communicating via FTF channels outperformed teams using a computer-mediated, Group 57
Decision Support System (GDSS) (Barkhi, Jacob, & Pirkul, 1999). Additional research shows that teams interacting with both auditory and visual channels generally have fewer interrupted dialogues (O’Malley, Langton, Anderson, Doherty-Sneddon, 1996), talk less, and require fewer words to complete a task than audio-only teams (Doherty-Sneddon et al., 1997; Krauss, Garlock, Bricker, & McMahon, 1977; O’Malley et al., 1996). There are also indications that the status of team members and levels of expertise exhibit different influences on team processes in FTF meetings versus collaboration via e-mail (Dubrovsky, Kiesler, & Sethna, 1991). The above studies, and those presented earlier, seem to suggest that FTF teams would typically outperform those using voice-only or text-based communication. FTF contact has been related to more efficient decision making and problem solving, reduced mental workload, increased interpersonal attraction and helping behavior, and facilitates team communication. Even if it is accepted that team-related processes are positively affected by FTF contact, a direct connection to performance remains tenuous at best. This is because the relationship between communication modality and team performance often depends on several factors that intervene in the relationship. Two of the most salient factors across studies are task type and team or group size. First, in studies of communication modality and team performance, the type of team task often governs the relationship. Tasks can be organized according to their degree of cooperation and complexity. In his review of FTF and mediated communication, Williams (1977) makes the distinction between cooperative tasks, those requiring team members to work together to reach a recognizable solution, and conflictive tasks, those for which participants debate or argue an issue without a clear solution. For cooperative tasks, the aforementioned research by Chapanis and colleagues (Chapanis, 1975; Chapanis et al.,1972; Chapanis & Overbey, 1974; Krueger & 58
Chapanis, 1980) repeatedly found that voice-based communication (FTF and audio only with no visual contact) led to faster solution times than text-based modes (teletypewriting or handwriting with no visual contact), but found no significant differences between the two voice modes or the two text-based modes. Williams (1975) reported similar findings for the performance of fourperson teams generating ideas in a brainstorming meeting. Comparisons of FTF, audio-video, and audio-only conditions revealed no differences in the number of ideas generated per minute or the quality and originality of the ideas. Williams (1977) clarified, however, that idea generation is often an individual-level task, and therefore not dependent on the quality of interpersonal interaction. He noted, “It seems that generating ideas is a task that does not require interpersonal communication to be efficient, so there is no a priori reason for expecting that face to face would be more or less efficient than would teleconferencing.” (p. 966). Slightly different results have been found for conflictive tasks. Morley and Stephenson (1969, 1970) used a management-union wage negotiation simulation and gave one participant, representing one side, a stronger case to argue. Participants with the stronger case were more successful during audio only communication exchanges (telephone) than FTF, and overall, there were fewer breakdowns in negotiation in the telephone condition. The authors explained that audio-only conditions allowed participants to focus on inter-party aspects of the negotiation, rather than interpersonal issues. Accordingly, negotiations were more objective and therefore successful over the telephone. Research by Short (1974), however, qualifies this finding. If someone argues a case that is more in line with their own beliefs (i.e., presents an argument on an issue with which they agree, rather than given an issue to argue that may or may not coincide with personal beliefs), people are more successful arguing the case in FTF and audio-video communication (closed circuit television) than audio-only. In summary, the conclusion from 59
communication research on cooperative and conflictive tasks is that FTF (or audio-video) and voice-only modes are equally effective for cooperative tasks with a clear solution, but differentially effective when the task involves conflict or debate between team members. This raises an important question in the context of the AAR; how does communication modality affect tasks with both conflictive and cooperative elements? During an AAR, team members often debate the significance of certain errors or actions, a conflictive task, as well as decide on a single plan to improve performance on future tasks, a cooperative task. The literature on similarly mixed tasks does suggest that FTF communication results in more cooperation than audio or video-only modes, although explicit performance differences are unclear. Wichman (1970) used the Prisoner’s Dilemma to compare four modes of communication (audio-visual, visual-only, audio-only, no communication) and found significantly more cooperation in the audio and visual mode, and less cooperation, in descending order, for audio, visual-only, and no communication modes. In addition to the level of task cooperation or conflict, research by Carey and Kacmar (1997) indicates that task complexity mediates the relationship between communication mode and performance. In a 2 X 2 study, 5-person teams in either a FTF or computer-teleconference mode completed simple and complex cooperative tasks. For the simple task, each team member was given 4 or 5 of 23 total steps for changing a tire and the team had to order all steps correctly. The complex task involved an investment decision and again, each team member had different elements (i.e., data exhibits) that the team had to combine to solve the problem. Results for the dependent variables of solution time and solution correctness (calculated as an absolute distance from the correct solution) revealed that FTF teams produced more correct solutions on the complex task than the teleconferencing mode, but no differences were found on the simple task. 60
With regard to solution time, however, the opposite was true. FTF teams were quicker than teleconference teams on the simple task, but were not significantly different on the complex task. These findings raise several methodological and theoretical concerns in the study of communication modality and performance. For one, the choice of dependent variable can dictate whether FTF teams outperform other communication modalities. Furthermore, features of the task, such as complexity and type often result in different findings for modality and performance. The second factor that appears to mediate the communication-modality and performance relationship is team or group size. In general, larger teams tend to possess more resources and attain higher skill levels than smaller teams, but suffer from greater coordination difficulties (Morgan & Lassiter, 1992). Furthermore, a large body of research on social loafing (e.g., Harkins, Latane, & Williams, 1980; Latane, Williams, & Harkins, 1979) indicates that team members work less hard as team size increases because individual efforts are less recognizable. Most of the research on social loafing has involved teams operating in a FTF manner. However, similar results have been found in non-FTF communication settings. In computer-mediated idea generation tasks, in which text-based communication replaces verbal communication, larger teams (e.g., 9-18 members) generate more ideas of greater quality than smaller groups (3 members) (Dennis, Valacich, & Nunamaker, 1990; Valacich, Wheeler, Mennecke, & Wachter, 1995). Findings are less clear, however, when communication modalities are compared to group size. Krueger and Chapanis (1980) compared 2, 3, and 4-member groups as they solved problems either FTF or via televoice and teletype conferences. Results indicated that larger groups used more messages and words and communicated faster than smaller groups, but that group size had no effect on time to solution or the solutions themselves. In addition, FTF and televoice teams used more words and messages and reached solutions faster than teletype teams. 61
In summary, group size, like task type and complexity, differentially affects team performance across different communication modalities. These are important methodological considerations for research in the area, nonetheless, these intervening factors hinder attempts to make general conclusions regarding communication modality and performance. All together, research suggests communication modality does not have a universally direct affect on team performance, and at times, audio-only modes actually seem to improve performance on conflictive tasks because participants are better able to debate an issue objectively. This finding does not bode well for the hypothesis, supported by Singer et al. (2001), that local, FTF teams will outperform distributed, voice-only teams in an immersive VE. However, the present study works from the contention that the affect of communication modality is an indirect one, that is FTF communication enhances team functions and processes, namely SMMs, cohesion, and trust, which collectively act to improve a team’s performance. This relationship, previously illustrated in Figure 3, is presented below (Figure 8) in a revised manner to serve as a framework for the following discussion. Note that for the two communication modalities, darker text and arrows are used to signify FTF communication, hypothesized to be more effective than voice-only communication, which is symbolized in lighter text and arrows.
62
Learning Cycle Pre-brief Perform/ Practice
Face-to-Face Communication Voice-Only Communication
After Action Review
Team Performance
Diagnose Performance
Shared Mental Models • Purpose • Procedures • Personnel • Interpersonal
Team Cohesion • Task • Interpersonal
• •
Team Trust Cognitive Emotional
Figure 8: Revised Interrelationships between Communication, AAR Dimensions, and Team Performance
Shared Mental Models The primary goal of the AAR is to have team members gain a common understanding of what occurred during task performance, why errors took place, and ways to improve future 63
performance through directed team discussions (Morrison & Meliza, 1999). In other words, teams must develop a similar or isomorphic perception of previous events, or SMMs, in order to effectively identify problems and generate solutions. Previous findings regarding the benefit of communication to SMM development (Bolstad & Endsley, 1999; Orasanu, 1990; Orasanu & Fischer, 1992; Orasanu & Salas; 1993 Stout et al. 1999) suggests that for the AAR process to work, there must be sufficient inter-team communication for the team to discuss and then gain SMMs regarding the purpose, procedures, and personnel responsibilities for the task. Team discussion should also lead to less explicit, but equally important, mental models of the team’s interpersonal characteristics. Recall that Stout et al. (1999) found that teams who do a better job of planning for upcoming tasks by sharing information and developing contingency plans exhibit more similar mental models, more efficient communication during task performance, and make fewer errors than teams with poor planning. The absence of FTF communication during AARs is presumed to degrade team planning capabilities, and therefore distributed teams are expected to develop less similar mental models during the course of repeated AARs than local teams. A majority of research on communication modality suggests that voice-only communications are susceptible to problems related to reductions in sensory channel bandwidth, the absence of certain nonverbal cues, and a decreased level of social presence, all of which serve to slow and disrupt communication exchanges. For these reasons, a tenable hypothesis is that distributed teams in the DIVE setting will exhibit less similar purpose, procedure, personnel, and interpersonal mental models than local teams.
64
Cohesion A second team dimension involved in the AAR process is team cohesion, comprised of task and interpersonal elements (see Figure 5). Task cohesion, referring to how committed team members are to the task, and interpersonal cohesion, the degree to which individuals have positive relationships and are attracted to each other, play a significant role in the quality of AARs. In fact, Morrison and Meliza (1999) recommend that AAR leaders facilitate the development of cohesion by allowing team members themselves to discuss performance and generate their own solutions. Although a clear understanding of the cohesion-performance effect in the context of communication modality remains elusive, there is ample evidence to suggest this dimension deserves attention in the present study. For example, in a study on team decision making under temporal stress, Zaccaro et al. (1995) found better performance for teams exhibiting high levels of task cohesion. Furthermore, these teams devoted more time to planning and information exchange during the planning period, analogous to the AAR, and communicated task-relevant information more frequently during the performance period than teams with low task cohesion. This and other studies therefore indicate that task cohesion is involved in team performance, and worthy of continued research. To a lesser extent, interpersonal cohesion appears to indirectly affect performance by altering the social relationships of the team. Interpersonal attraction, an element of interpersonal cohesion, for instance, has been shown to decrease in less communication rich modalities like voice only. Zander and Havelin (1960) found that people are more likely to be positively disposed toward another if they interact FTF. Weisband and Atwater (1999) contend this is because FTF communication allows individuals to gain more personal information about others, which strengthens attraction. 65
If communication modality negatively affects cohesion development, both task and interpersonal, in any way, this could have implications for the overall effectiveness of the AAR, and subsequently team performance. In a DIVE, reduced interpersonal contact in the same physical setting may inhibit the formation of team cohesion. I therefore hypothesize that local teams will exhibit higher levels of cohesion, both task and interpersonal, than distributed teams.
Trust Team trust is the third team dimension predicted to impact the AAR process. Trust, referring to the attitudes team members have about the emotional closeness within the team (emotional trust), as well as the competence and reliability of other members (cognitive trust), has proven to have a positive effect on team performance, and the same is predicted for the AAR process. In general, findings support that trust is negatively affected by the absence of FTF communication (e.g., Muehlfelder, Klein, Simon, & Luczak, 1999). Rocco (1999) showed that virtual groups meeting over e-mail developed lower levels of trust than groups meeting FTF. Research by Jarvenpaa and Leidner (1999) indicated that virtual teams, cooperating across great physical distances, are able to develop a form of trust, yet this trust is fragile and short-lived. Consequently, virtual teams tend to exhibit poorer performance than local (i.e. FTF) teams. More specifically, emotional trust appears more dependent on FTF communication than cognitive trust. In a study of geographically local and distributed workers with Lucent Technologies, all respondents indicated higher levels of emotional trust with co-located colleagues than distant ones, but differences in cognitive trust were inconclusive (Rocco et al., 2000; 2001). Explaining this difference, the authors argued that cognitive trust is more easily demonstrated at a distance through actions like prompt replies to email and phone messages. In contrast, emotional trust is 66
“...harder to achieve at a distance, particularly without any prior face-to-face contact. For instance, evolution of an affective bond often occurs through gradual escalation across opportunistic conversations, not necessarily related to work.” (Rocco et al., 2000). A similar relationship between communication mode and emotional and cognitive trust is hypothesized in the present study. That is, local teams will report higher levels of emotional trust than distributed teams, but differences between cognitive trust levels will not be significant.
Team Communication Training The primary difference between local and distributed teams is how teammates communicate. Considering my assertion that team-related factors are influenced by the quality of communication, and that Singer et al. (2001) found poorer performance for distributed teams, a plausible prediction is that some form of brief TCT, prior to mission task performance, would help reduce or eliminate the distributed disadvantage. Choice of an effective communication training approach, however, is complicated because multiple factors are involved in the communication process. Nevertheless, focusing on the most critical communication-related factors for team performance, the content for a TCT approach can be realized. Another look at Cannon-Bowers et al.’s (1995) list of team competencies (Table 3) reveals that the following communication-related knowledge, skills, and abilities are important to teams: a) information exchange, b) intrateam feedback, c) consulting with others, d) shared task models, and e) shared problem models. For example, according to the authors, information exchange skills involve speaking clearly and concisely in an unambiguous manner; skills that have obvious implications for successful communication between team members. Further, the
67
development of shared task and problem models within a team partly depend on how well each individual member shares his or her perceptions of a task and the team’s performance. Additional guidance in developing a TCT approach comes from research on teams conducted by the US Navy. Following the inadvertent downing of an Iranian passenger jet by the U.S.S. Vincennes in July of 1988, the U.S. Navy developed a decade-long research and development program called Tactical Decision Making Under Stress (TADMUS) with the main objective being to “...enhance the quality of tactical decision making in high-stress operational environments by applying recent developments in decision theory, simulation and training technology, and information display systems.” (Collyer & Malecki, 1998, p. 10). One outcome of the TADMUS project was a technique to facilitate team training, similar in concept to the AAR. The Team Dimensional Training (TDT) strategy (Smith-Jentsch et al., 1998) is a process of guided self-correction whereby a facilitator helps a team recognize and discuss problem areas in team performance. A major goal of TDT is to develop different types of shared knowledge among team members on topics including expectations, teamwork processes, and teammatespecific preferences through a series of exercises. (Smith-Jentsch et al., 1998). This is accomplished through a series of exercises designed to highlight critical team dimensions. Two of the four main dimensions are directly associated with communication: information exchange, referring to searching for and utilizing all available sources of information in the environment, exchanging information to appropriate team members without having to be asked, and providing regular updates to give the team an overall picture of the task and performance, and communication, concerning components of communication delivery such as proper phraseology, complete reporting procedures, and the clarity and brevity of communication.
68
Combining the conceptual factors of the Cannon-Bowers et al. (1995) and TDT (SmithJentsch et al., 1998), the TCT employed in the current study encompassed four general dimensions, illustrated in Table 4. Training with this approach was intentionally brief (~ 1 hr) for the reason that personnel in the real world, such as distributed military teams training for immediate deployment, will need to focus a majority of their resources on practicing a shared task in the VE. Accordingly, a research was if TCT, even in this brief format, is sufficient to reduce the disadvantages faced by distributed, voice-only teams.
69
Table 4: Dimensions of Team Communication Training Communication Dimension
Description
Process
How people communicate: •
Speaking clearly (adequate volume, clarity of speech)
•
Speaking concisely (avoiding excess chatter or non-task related discussion)
•
Using clear and unambiguous expressions (speaking in certain terms to avoid confusion)
•
Using proper vocabulary (employ standard phrases and terms as dictated by task)
Information Exchange
What people communicate: •
Providing information to teammate when necessary (without having to be asked)
•
Providing regular situation assessments (to develop overall team awareness of task)
•
Gathering, and then communicating, all relevant information from the environment
Feedback
Shared Models
Providing and receiving feedback: •
Consulting with teammate (for guidance and support)
•
Asking relevant questions
•
Providing appropriate answers
Developing similar perceptions of common tasks: •
Expressing thoughts about the task to teammate
•
Asking teammate for his/her thoughts about the task
Note. Adapted from Cannon-Bowers et al. (1995) and Smith-Jentsch et al. (1998).
Based on previous hypotheses, I therefore predict that distributed teams, exposed to the TCT dimensions, will perform as well as untrained local teams over a series of VE missions. In addition, working on the assumption that improved communication positively affects team factors, trained distributed teams were expected to exhibit degrees of SMMs, cohesion, and trust similar to those of untrained local teams. Furthermore, considering the previous findings of
70
Singer et al. (2001), trained local teams sould possess the highest levels of performance over all conditions, as well as exhibit the highest scores on SMMs, cohesion, and trust.
Hypotheses Summary To summarize predictions outlined in previous sections, the present study tested the following 11 hypotheses based on two independent variables of location (local vs. distributed) and training (TCT vs. no-TCT): 1. Local teams will outperform distributed teams during VE missions. 2. Distributed TCT teams will perform as well as local no-TCT teams during VE missions. 3. The SMMs of local teams will be more similar than distributed teams. 4. The SMMs of TCT teams will be more similar than no-TCT teams. 5. The SMMs of local-TCT, local no-TCT, and distributed TCT teams will be more similar than distributed no-TCT teams. 6. Local teams will exhibit higher levels of cohesion, both task and interpersonal, than distributed teams. 7. TCT teams will exhibit higher levels of cohesion than non-TCT teams. 8. Local TCT, local no-TCT, and distributed TCT teams will exhibit higher levels of cohesion than distributed no-TCT teams. 9. Local teams will report higher levels of emotional trust than distributed teams, but differences for cognitive trust between team types will not be significant. 10. TCT teams will exhibit higher levels of emotional trust than no-TCT teams. 11. Local TCT, local no-TCT, and distributed TCT teams will exhibit higher levels of emotional trust than distributed no-TCT teams. 71
72
CHAPTER 2: MATERIALS AND METHODS
Research Design A 2 X 2, between groups design, outlined in Table 5, was used to test the 11 hypotheses. Four team conditions were derived from two independent variables: location (local and distributed) and communication training (TCT and no-TCT). Multiple dependent variables allowed for team comparisons on: 1) overall performance (average number of rooms properly searched during missions), 2) individual task performance (hallway search time, door entry time, room search time, canister disarming time, collisions, neutralization of opposing forces and innocent bystanders), 3) SMMs, 4) team cohesion, 5) team trust, and 6) additional measures of simulator sickness, presence, immersion, and situation awareness. Specifics of the measurements for these variables are described below.
Table 5: Experimental Conditions
Local Team (Face-to-face Communication) Distributed team (Voice-only Communication)
No Team Communication Training
Team Communication Training
Local no-TCT n = 8 teams
Local TCT n = 8 teams
Distributed no-TCT n = 8 teams
Distributed TCT n = 8 teams
Estimates of sample size, for a two-tailed significance test to determine if two or more samples belong to the same population, revealed that 63 teams per group is needed to achieve power of .80 with a medium effect size of .50 (Cohen, 1992) and an α level of .05. Using this value, a total of 504 participants would need to be selected (63 teams x 2 participants per team x 73
4 groups). Given the time and resource restrictions of the present study, this desired sample size was not possible. Furthermore, in the Singer et al. (2001) study, nine teams per condition were used, and significant differences were detected between local and distributed teams on the mean number of rooms properly searched over eight VE missions. Because this same dependent variable is used in the present study as a measure of team performance, and considering experimental limitations, eight teams per condition were used, or 64 total participants.
Participants Participants (N = 64, 37 men and 27 women, mean age = 21.73) were selected from the pool of undergraduate and graduate students at the University of Central Florida (UCF). Responses on the biographical questionnaire indicated all participants reported being in their normal state of physical health and had received a mean of 6.66 hr sleep the previous night before the initial VE training session. Furthermore, mean hours of computer usage per week for the sample was 17.64. All participants received either monetary compensation ($10.00/hour) or research credit for college courses for all time spent during the experiment.
Materials
Questionnaires Some questionnaires were administered using an Accesstm database, developed by ARI researchers, and implemented on a standard Microsoft Windowstm platform. This allowed for efficient and accurate data collection and storage. Other questionnaires were administered via paper and pencil copies, as indicated in the subsections below. 74
Biographical Questionnaire The biographical questionnaire (See Appendix A) addressed basic demographic statistics, health, motion sickness history, and computer, video, and virtual reality gaming experience and use. Participants completed the biographical questionnaire via the Accesstm program.
Shared Mental Model Questionnaire (SSMQ) Like many cognitive-based concepts, the assessment of SMMs is a challenging endeavor. Although a number of assessment techniques are available, each has its own weaknesses with regard to reliability (c.f., Evans, Jentsch, Hitt, Bowers, & Salas, 2001) and validity. Three more common techniques are concept mapping, pairwise relatedness ratings, and card sorting. Concept maps are drawings or spatial representations of knowledge consisting of multiple concepts, or nodes, connected together via links, which represent some type of relationship between nodes. An individual typically is given a list of concepts and asked to organize the concepts according to his or her perception of how the concepts are related. Jentsch et al. (2001) note that concept maps have proven to be a reliable indicator of knowledge in several domains including academe, biological science, and software applications. However, Jentsch et al. note that although the technique is easy to learn, concept maps can be difficult to interpret and may require numerous drawings to achieve a suitable map for analysis. Considering the SMM assessment for the current study needed to be done relatively quickly in light of time limitations, this approach was deemed too complex. Pairwise-relatedness rating techniques raise a similar concern. Mental models are represented either graphically or quantitatively based on similarity ratings of paired comparisons 75
of multiple concepts. For example, in Stout et al.’s (1999) study on SMMs, planning behaviors, and coordinated performance, participants made 190 judgments as to the informational relationship between two concepts related to a simulated helicopter surveillance and defense mission. These paired comparison judgments were then analyzed with a structural assessment technique called Pathfinder C (Schvaneveldt, 1990) to produce a mental model for each participant. The Pathfinder technique transforms raw comparison ratings into a network structure. Using an index termed C for closeness, Stout et al. then tested the similarity between the two participants’ network structures, indicative of the degree of mental model similarity. Mathieu et al. (2000) used a similar approach in their research on SMMs, team processes, and performance. To quantify participants’ mental models for both the task (F-16 flight simulation) and the team, the authors developed two matrices that listed task- and team-related attributes along the top and side of the matrix. Participants then rated each attribute’s relationship with all other attributes on a 9-point Likert scale (ranging from negatively related, a high degree of one attribute requires a low degree of the other, to positively related, a high degree of one requires a high degree of the other) (Mathieu et al.). The task-related matrix contained 8 attributes and the team-related matrix contained 7 attributes, resulting in 64 and 49 individual comparisons, respectively, for a total of 113 individual comparisons. A network analysis program (UCINET: Borgatti, Everett, & Freeman, 1992) was then used to provide an index of convergence for two matrices, thereby showing the level of similarity between participants’ team and task mental models. Jentsch et al. (2001) reported this family of techniques has shown promise for illustrating how people perceive relationships between concepts and differentiating between experts and novices. However, like concept maps, pairwise relatedness ratings require a
76
significant time commitment on the part of raters and limit their applicability in time-constrained research or repeated SMM measurements. A more expeditious approach is card-sorting or the Q-sort technique whereby an individual organizes a set of cards, each describing a different concept or item, into one or more piles based on similarity or some other categorization. Card groupings can either be governed by the participant, or specified by the experimenter. For example, one may be asked to form groupings based on physical characteristics (e.g., color, size, etc.), semantics, or purpose. Another variation is to ask participants to sort cards into hierarchies such that the top card in a pile indicates the most important concept, or the first step in a series of tasks (Jentsch et al., 2001). The validity and reliability of the card sorting method has received some support in the literature, and has advantages over concept maps and pairwise relatedness ratings with regard to time requirements (Jentsch et al). Considering the time requirements of the concept mapping and pairwise relatedness approaches, the present study employed a modification of the card sorting technique. For example, the number of items for the pairwise relatedness ratings employed by Stout et al. (1999) (180 comparisons) and Mathieu et al. (2000) (113 comparisons) is restrictive, particularly for repeated measurements. In addition, because the current focus was on explicit perceptions of the purpose, procedures, and personnel responsibilities involved in the VE missions, concept maps and relatedness ratings were deemed less appropriate as these are more effective in providing a general representation of the relationships between concepts. In other words, rather than evaluate how a participant perceives the overall picture for a task or the team, a direct assessment was needed to evaluate how participants rate the importance of certain goals, the
77
correct sequence of specific tasks, impressions of team member responsibilities, and awareness of how the team interacts and each team member’s strengths. Accordingly, a 20-item Shared Mental Model Questionnaire (SMMQ: see Appendix B) that tapped participants’ purpose, procedures, personnel, and interpersonal mental models was administered. Items for purpose, procedure, and interpersonal mental models were based on the card sorting technique. For purpose mental models, an assessment of the importance of certain mission goals, participants ranked a list of eight mission tasks in order of importance. For three different procedure mental modelss (Room Search, Door Entry, and Canister Disarming), participants placed a list of eight or 11 steps for a specific task in order from first to last. This approach is analogous to having participants physically manipulate a pile of cards into a hierarchy. For a portion of the items comprising the interpersonal mental models, participants ranked their own strengths, as well as their partner’s, during the mission and AAR phases. Items for personnel mental models, which assessed understanding of each team member’s responsibilities for nine different tasks, and certain interpersonal mental models were less amenable to multiple-item sorting because judgments forced the participant to select between one of two options: the team leader or the equipment specialist. In total, participants were required to make 70 individual judgments on each administration of the SMMQ; a number significantly less than employed in the Stout et al. (1999) and Mathieu et al. (2000) studies. Participants completed the SMMQ via paper-and-pencil.
Group Environment Questionnaire-Virtual Environment (GEQ-VE) Mudrack’s (1989) primary conclusion after reviewing nearly four decades of cohesion research was that too many measures exist, noting that, “Since so few investigators bother to use 78
identical (or even similar) instruments for assessing group cohesiveness, the results of any two studies are not necessarily compatible.” (p. 781). Furthermore, Mudrack recommended that a suitable starting point for identifying a suitable cohesion measure is to adapt an extant sport psychology measure of cohesiveness. For this reason, a modified version of the Group Environment Questionnaire (GEQ: Brawley, Carron, & Widmeyer, 1987; Carron, Widmeyer, & Brawley, 1985) was used to compare task and interpersonal cohesion for teams in the four conditions. The original GEQ was developed to assess individual and group level perceptions (see Table 4) of task and social (i.e., interpersonal) cohesion for sports teams as evidenced by individual responses to 18 items on a 9-point Likert scale ranging from 1 (strongly agree) to 9 (strongly disagree). In the current modified version, referred to as the GEQ-Virtual Environment (GEQ-VE: see Appendix C), wording for 15 items was changed to better reflect the two-person VE team context. For example, the original GEQ item “I am not going to miss the members of this team when the season ends” was changed to “I am not going to miss my team member when this experiment ends.” This alteration raises validity and reliability concerns, but was unavoidable in the present study, and similar modifications have proven valid in other contexts (see Carless & De Paola, 2000). The original (first) and revised (second) items are provided in Appendix C for review. The GEQ-VE was administered in a paper-based format immediately after the first and last mission sessions in order to evaluate if and how task and interpersonal cohesion change over missions.
79
Team Trust Questionnaire (TTQ) The Team Trust Questionnaire (TTQ: see Appendix D) was developed from extant examples in the literature and queries an individual’s perceptions regarding emotional closeness with their teammate (emotional trust), and perceived reliability and competence of the teammate (cognitive trust). In their research on trust and local and distributed teams, Rocco et al. (2000) employed the following three questions, scored on 7-point Likert scales (1 = strongly disagree to 7 = strongly agree), to measure emotional and cognitive trust: Emotional Trust 1. I feel comfortable sharing ideas and feelings about work with my co-workers. Cognitive Trust 2. If I do not closely monitor my co-worker’s progress, our tasks will not be completed (reverse scored). 3. I cannot rely on my co-workers to fulfill their commitments (e.g. meet deadlines, complete tasks) (reverse scored). The TTQ is based on a revision of these questions to better reflect the terminology of the team task and DIVE setting. Furthermore, questions were added to 1) obtain a more detailed account of emotional and cognitive trust, and 2) gather data both for individual perceptions of trust, as well as beliefs of the trust of one’s teammate. Items were ordered such that similar items were not grouped in order to minimize response sets. Furthermore, to maintain consistency between the GEQ-VE and TTQ structures, items were scored on a 9-point Likert scale. The TTQ was administered on paper.
80
Additional Measures Measures of presence (Presence Questionnaire [PQ], Witmer & Singer, Vs. 3.0, 1994, see Appendix G), immersion (Immersive Tendencies Questionnaire [ITQ], Witmer & Singer, Version 3.01, 1996, see Appendix H), and simulator sickness (Simulator Sickness Questionnaire [SSQ], Kennedy, Lane, Berbaum, & Lilienthal, 1993, see Appendix E) were also collected so that findings from the present study could be compared with the Singer et al. (2001) study, which utilized the same measures. Furthermore, participants completed a relatively short assessment of situation awareness (Mission Awareness Rating Scale [MARS], see Appendix I) and finally an End Questionnaire (see Appendix F), the primary purpose of which was to assess how close distributed team members believed their partners were and whether they would have performed better with their partner in the same room. To disguise this purpose, several additional “placebo” questions were included about the quality of the VE experience on the End Questionnaire.
Apparatus
Virtual Environment System The VE was rendered on an updated version of the Fully Immersive Team Training research system (FITT: see Lampton & Parsons, 2001 and figures 9 and 10) used by Singer et al. (2001). Although the new system had increased computational and processing capabilities, it retained the same virtual experience for participants. The major difference between the systems was a migration of the visual database and entity servers from Linuxtm-driven, Silicon Graphicstm machines to Linuxtm-driven personal computers. MotionStartm sensors tracked participants’ physical movements, and Virtual Realitytm VR8 head-mounted displays (HMD) presented head81
slaved, computer-generated, stereoscopic color imagery to the participants. Stereo sound was provided through earphones attached to the HMD. Sounds included voice communications between each of the participants and the experimenter, and sound effects such as collision noises, doors opening, grenade explosions, and gunfire. All software was written using Performer, C++, and Java by personnel from the Institute for Simulation and Training at the University of Central Florida.
82
Figure 9: Solo Participant in the Fully Immersive Team Training (FITT) System Developed by ARI and IST.
83
Figure 10: A Local Team in the Fully Immersive Team Training (FITT) System Developed by ARI and IST.
VE Mission Layouts The mission scenarios in Singer et al. (2001) were used in the present study. These were twelve, 10-room buildings representing simple business offices, a school, a department store, a library, a warehouse, and a variety of single story homes (see Figure 11 for an example layout). Each building had one main corridor 70 m in length with one 90-degree turn placed at either 20, 25, or 30 m from the building’s first room. The rooms varied between 5 x 10 and 15 x 10 m in 84
size, and were furnished according to the building type. For example, the rooms in Figure 10 represent the office theme, with a small library in the room on the top right corner of the figure, and offices with desks, tables, and chairs in the other rooms. Teams entered from the small room at the bottom, as if a van had backed up to the door into the building. This eliminated the necessity for team activities outside the building.
Figure 11: Example Environmental Layout for a VE Mission
The scenarios were populated with varying numbers of neutrals (avatars that had no weapons) and OpFor (avatars that were holding and using weapons). Avatars all had normal 85
civilian appearances, thus the only discriminating factor between neutrals and OpFor was whether the avatar was holding a weapon and firing on the team. All scenarios also had varying numbers of gas canisters, which also varied in their placement and state. Canisters had one of three possible armed states: a) no gas & not armed, b) gas & not armed, and c) gas & armed. Participants were instructed that the gas in the canisters was harmful for civilians, but not for team members, as they would be wearing Hazardous Materials (HazMat) suits. Scenario complexity (based on the number of OpFor, and the number and state of canisters) was balanced across the different scenarios to the greatest extent possible. Each scenario had several armed and unarmed gas canisters per scenario. In addition, not every room in a scenario contained a canister, yet an armed canister was typically encountered in at least one of the first three rooms. The order of scenarios was randomized such that each team received a unique permutation of scenarios, and that across teams, no single scenario was first or last for a specific team more than once.
Procedure Training and mission phases of the experiment took place over two days separated, on average, by 1 week, but no longer than 2 weeks, between training and mission phases. The following sections describe the VE training and team communication procedures completed on the first day and the mission procedures completed on the second day.
VE Training Participants were first informed about the general nature and requirements of the VE and training and mission phases. This introduction included viewing a video that demonstrated the 86
VE equipment, special techniques for using the equipment, and mission tasks. Participants were also told about the multi-session nature of the experiment in order to ensure commitment to both experiment phases (i.e., training and mission sessions on separate days). Following this introduction, informed consent was obtained from all participants. Next, each participant completed the biographical questionnaire, the ITQ, and the initial SSQ, before starting the training program. All participants received individual training on the VE equipment and mission activities. During each session, which averaged 4 hr, participants learned communication protocols and how to perform the primary tasks required in the mission rehearsals (e.g., walking, door opening, grenade launching, gas canister detection and disarming). This was accomplished by having participants first watch a demonstration of the task, and then practice the task with the experimenter (for communication protocols) or in the VE (for physical tasks). The training concluded with practice on the major coordinated team activities with an automated partner in the VE. Note that participants completed this training alone and not with their teammates. Each participant was trained to perform both team roles: Team Leader and Equipment Specialist. Each role had specific duties within the mission context and each player had access to a unique set of virtual tools to complete the door entry and canister disarming procedures. Furthermore, all participants were required to reach a predetermined criterion of no significant errors on any task in order to be assigned to teams for the mission rehearsals. Errors in a task required the participant to repeat the task until achieving acceptable performance. Teams were also instructed not to proceed past the X on the floor at the end of the corridor, which effectively limits the area for the mission (see Figure 11).
87
All training was completed at least one day prior to the first session of team missions. During the experiment, in order to minimize any adverse effects of immersion in the VE, participants were only allowed to spend a maximum of 12 min immersed in the environment within a 30-min period (the 12 min period started at initial exposure to the VE). Participants then had a minimum 15-min recovery time between VE immersions, during which questionnaires and non-VE training was administered. After the first VE training session, which trained movement using the VE equipment, participants completed another SSQ and their first PQ. Subsequently, an SSQ was administered before and after every VE session, and also 30 min after the last VE session of every day. This ensured that an evaluation of symptoms was completed before the participant was released for the day. If symptoms were elevated, participants were kept on-site until symptoms diminished to near baseline rates. The PQ was also be administered again immediately after the last VE training session. Following completion of all VE training exercises, participants were asked to provide available times when they could return for the VE mission phase.
Team Communication Training Half of the local and distributed teams also completed TCT at the end of the VE training session on the first day. Over the course of 1 hr, participants were asked to read four short descriptions of the communication dimensions (Process, Information Exchange, Feedback, and Shared Models), and then practice the main parts of each dimension while completing a collective task with the experimenter. Participants in the no-TCT condition completed a placebo task, described below, during this time. The specific procedure was as follows.
88
The participant was first seated next to the experimenter and read the directions for the TCT process (see first page of Appendix J). The participant then was given 5 min to read the one-page description of the first dimension for Process. When the participant indicated they were finished, a visual barrier was placed between the participant and experimenter so that each person could not see the others hand movements. To practice communicating using the main parts of the dimension just reviewed, the participant and experimenter completed a relatively simple electronic circuit-building task using a Radio Shack electronics learning lab (Model # 28280, Radio Shack, Fort Worth, TX) often used by young students to learn basic circuitry. Working from a list of parts and steps (see Appendix K), the participant built the circuit while the experimenter read the directions. These roles were reversed for subsequent tasks. At the completion of the task, the experimenter then reviewed the participant’s performance as to how well they utilized the TCT dimension. This same procedure was repeated for the remaining dimensions using different circuitbuilding tasks. After all four dimensions had been trained, the participant completed a TCT quiz to assess their understanding of the concepts (see Appendix L). Any errors were reviewed until the participant reported understanding the correct answer. Participants in the no-TCT conditions did not receive the TCT materials and were only asked to complete the circuit-building tasks on their own for the hour.
VE Missions Following training to criterion on the first day, each participant was randomly assigned to one of four team conditions (local no-TCT, local TCT, distributed no-TCT, and distributed TCT) and, using counterbalanced assignment, to one of the two team roles (Team Leader or Equipment 89
Specialist). In both local conditions, team members were in the same room and communicated FTF with one another and the reviewer during the AAR. In addition, after completion of the AAR, local team members had the opportunity to communicate with each other on an interpersonal level concerning non-mission topics if time allowed. Participants were instructed to not discuss mission topics during these free periods, and were asked to stop if any missionrelated discussion takes place. In both distributed conditions, team members were located in different rooms in the same building and communicated only by voice during the missions, the AAR replay, and the free interval. Steps were taken to ensure that distributed team members never saw one another during the experiment by asking one team member to arrive 30 min ahead of the other on the day of the experiment. The AAR was conducted in as near an identical manner to the local team AAR as possible. Once assigned to a team, participants did not change their role or teammate during the mission trials. Prior to VE missions, participants in the TCT conditions received the TCT procedures described above. Next, each team began their first of five VE missions. In each mission, the team moved through one of the 10-room building scenarios, searching for and disarming gas canisters, dealing with OpFor and neutrals, as described above. As with the VE training, in order to minimize any adverse effects of immersion in the VE, participants were only allowed to spend a maximum of 12 accumulated minutes immersed in the environment within a 30-min time frame (the 30 min starting at initial exposure to the VE). This exposure limitation followed guidelines derived from previous VE research conducted by ARI (e.g., Lampton, Kraemer, Kolasinski, & Knerr, 1995; Singer, Ehrlich, & Allen, 1998) and other recommendations (Knerr et al., 1998; McCauley & Sharkey, 1992). The exposure 90
limitation was accomplished by having the team begin their exit from the scenario at the 9:30min mark after the start of the mission. If a team continued past 12 min, the VE was programmed to automatically freeze. After each mission, the participants had a minimum 15-min recovery period before the next mission, during which questionnaires were administered. As during the training session, the SSQ was administered before and after every VE session, and also 30 min after the last VE exposure of each day. This ensured that an evaluation of symptoms was completed before the participant was released from the experiment. If symptoms were elevated, the participant was kept on-site until symptoms diminished to near normal based on the baseline SSQ scores for the day. In addition, the SMMQ, GEQ-VE, and TTQ were administered after the first and fifth missions. The PQ was administered after the second and fourth missions and the MARS was administered after the fourth mission. At the end of all missions, but prior to the experiment debriefing, distributed team members also completed the End Questionnaire. All teams received an experiment debriefing which explained the general design of the study and value of results to the development of future U.S. Army training systems. In addition, after the End Questionnaire was completed, distributed team members were brought together in the same room for the debriefing. This allowed the experimenter to remove any negative affects associated with deceiving participants that their partner was at a distant location. All participants, regardless of condition, were asked to not share details of the experimental design with fellow students to prevent contamination of future participants.
91
After Action Review At the conclusion of each mission rehearsal, the team conducted a 10-min AAR. The experimenter acted as the reviewer and replayed two critical segments of the mission for which performance was sub-optimal. Replays were digitally-captured, moving images of a “birds-eye” view of the mission activities. Each AAR was broken down into two separate 5-min segments: the first focused on the mission protocol (accuracy emphasized), and the second on mission performance (speed emphasized). The mission segments were selected for replay based on a preestablished hierarchy of errors (with the most complex collective tasks ranked as most important and search patterns and movement rated as least important). The segment with the most critical error was then selected for review. During the AAR, participants were allowed to review the mission activities scripts, used during the initial VE training to teach communication and mission tasks, and were instructed to discuss what happened in the replayed segment, why it happened that way, and how they could improve performance during the next mission. During the AAR period, after the team completed their desired discussion, they were allowed to freely address other aspects of the mission in which they perceived problems.
92
CHAPTER 3: RESULTS
A series of analyses were performed to determine how location (local vs. distributed) and training (TCT vs. no-TCT) affected two main categories of dependent variables: team performance and team characteristics. Team performance data, generated by the DIVE system, encompassed specific team tasks and overall performance during the missions. Team factors data were derived from the questionnaires on SMMs, team cohesion and team trust. In addition, a third category of data was collected on several additional measures including simulator sickness, presence, and immersive tendencies. Note that in addition to traditional F value and probability statements, results for analyses using the General Linear Model (e.g., univariate and multivariate analyses of variance [ANOVA and MANOVA, respectively]), also include an index of effect size, partial eta square (η2). Reporting effect size, also called strength of association, is becoming increasingly common in psychology, performance, and social research in order to augment significance testing (Kotrlik & Williams, 2003; Levine & Hullett, 2002; Smith & Davis, 2003) and is strongly encouraged in the American Psychological Association’s Publication Manual (2001). Effect size indicates the proportion of variance in the dependent variable associated with levels of an independent variable or the interaction between independent variables. Specifically, partial η2 represents the proportion of sample variance of the dependent attributed to a certain main effect or interaction, but excluding other main effects and interactions (Green & Salkind, 2003). Partial η2 is not to be confused with the more common eta squared (η2) technique which tends to produce higher values in factorial designs because it includes variance for other effects in addition to error variance and the variance associated with the variable of interest (Tabachnik & Fidell, 1996). 93
Partial η2 values range from 0, signifying no differences in the mean scores among the groups, to 1, indicative of differences between at least two of the means on the dependent variable. Because the partial η2s do not sum to the dependent variable variance attributed to the independent variables and possible interactions, partial η2s may sum to a value greater than 1.00 (Tabachnik & Fidell, 1996). Although conventional cutoffs exist for small, medium, and large effect sizes for the η2 approach (.01, .06, and .14, respectively), Green and Salkind (2003) caution these cutoffs are likely too large for partial η2 interpretations. For this reason, no firm interpretations of effect sizes in the current study are offered in the following sections.
Team Performance Multiple dependent measures provided information about a team’s overall mission performance and, more specifically, how well each team completed tightly- and looselystructured tasks. For tightly-structured tasks, such as the door opening and gas-canister detection/disarming routines, both team members had to complete a fixed sequence of rolespecific subtasks (e.g., Team Leader first opens door, Equipment Specialist then launches grenade, Team Leader enters room, and Equipment Specialist follows, etc.) to be successful. Each role also had unique tools available during the missions. Team Leaders, for instance, did not have access to the grenades or a canister-checking device used by the Equipment Specialists. During initial training, each participant received explicit guidelines on these tasks. In contrast, loosely-structured tasks, such as neutralizing OpFor, moving down the hallway, and searching rooms, could be accomplished with several different approaches by either team member and did not require the same linear task progression as the tightly-structured tasks. 94
Additional dependent measures were collected on a number of secondary tasks not directly related to mission performance including number of canisters missed in the scenarios, times the Team Leader or Equipment Specialist was shot by OpFor, and number of environmental collisions for each player.
Overall Performance Good Rooms The primary performance dependent variable, labeled good rooms, was the number of rooms successfully completed in a mission. A successful completion required that team members search the room, neutralize any OpFor, check the state of, and appropriately deal with (cap or disarm), all canisters, before being called back by the offsite controller when mission time expired. In addition, team members must not have shot any neutral bystanders or exploded any gas canisters. The good rooms variable therefore combined tightly and loosely structured tasks. First, a three-way (2 X 2 X 5) repeated measures ANOVA was performed to determine the effects of location and training on the change in mean number of good rooms over the five missions. Based on the multivariate criterion of Wilks’s lambda (Λ), the mission number main effect was significant, Λ = .134, F (4, 25) = 40.55, 60.91, p < .001, partial η2 = .866, indicating that all teams improved over the five missions on the mean number of good rooms, as illustrated in Table 6 and Figure 12. Interactions between mission and location, mission and training, or the mission by location by training interaction were not significant. Univariate tests from the ANOVA associated with the location and training main effects revealed a significant location effect, F (1, 28) = 5.94, p =.021, partial η2 = .175. Local teams completed a significantly greater number of rooms over the five missions than distributed teams. The mean number of good rooms 95
by TCT-teams (M = 5.24, SD = .94) was actually lower than no-TCT teams (M = 4.75, SD = .88), but this difference was not significant, nor was the location by training interaction was not significant.
Table 6: Means and Standard Deviations for Number of Good Rooms per Mission and Overall by Location and Training
Mission First
Location Local
Dist
Total
Second
Local
Dist
Total
Third
Local
Dist
Total
Fourth
Local
Dist
Training No-TCT TCT Total No-TCT TCT Total No-TCT TCT Total No-TCT TCT Total No-TCT TCT Total No-TCT TCT Total No-TCT TCT Total No-TCT TCT Total No-TCT TCT Total No-TCT TCT Total No-TCT
96
M 3.00 2.75 2.87 2.75 2.63 2.69 2.88 2.69 2.78 4.50 4.25 4.37 4.25 3.50 3.87 4.38 3.87 4.13 6.25 5.25 5.75 5.13 4.75 4.94 5.69 5.00 5.34 7.00 6.25 6.63 5.75
SD 0.93 1.04 0.96 0.71 1.30 1.01 0.81 1.14 0.97 1.31 1.16 1.20 1.28 0.76 1.09 1.26 1.02 1.16 1.39 1.04 1.29 1.13 0.71 0.93 1.35 0.89 1.18 1.31 1.58 1.45 1.39
Total
Fifth
Local
Dist
Total
Overall
Local
Dist
Total
TCT Total No-TCT TCT Total No-TCT TCT Total No-TCT TCT Total No-TCT TCT Total No-TCT TCT Total No-TCT TCT Total No-TCT TCT Total
97
5.38 5.56 6.38 5.81 6.09 7.25 7.13 7.19 6.50 5.63 6.06 6.88 6.38 6.62 5.60 5.13 5.36 4.88 4.38 4.63 5.24 4.75 4.99
1.51 1.41 1.45 1.56 1.51 1.83 1.36 1.56 1.41 2.26 1.88 1.63 1.96 1.79 1.00 0.80 0.91 0.77 0.84 0.82 0.94 0.88 0.93
8 7
Local no-TCT Local TCT Distributed no-TCT Distributed TCT
Number of Rooms
6 5 4 3 2 1 0 1st
2nd
3rd
4th
5th
Overall
Mission Number
Figure 12: Mean Number of Good Rooms by Location and Training over Missions and Overall
To follow up the significant main effect of location, a one-way MANOVA was performed to determine the main effect of location on the mean number of good rooms for all five missions. This analysis showed local and distributed teams were not significantly different for the first, second, and fifth missions. However for mission 3, local teams (M = 5.75, SD = 1.29) performed significantly better than distributed teams (M = 4.94, SD = .93), F (1, 30) = 4.18, p = .05, partial η2 = .122. A similar significant difference was found for mission 4 with local teams (M = 6.63, SD = 1.46) outperforming distributed teams (M = 5.56, SD = 1.41), F (1, 30) = 4.39, p =.045, partial η2 = .128 (see Figure 13).
98
8
All Local 7
All Distributed
Number of Rooms
6
5
4
3
2
1
0
1st
2nd
3rd
4th
5th
Overall
Mission Number
Figure 13: Mean Number of Good Rooms by Location over Missions and Overall In summary, these results indicate that local teams successfully completed a greater mean number of rooms than distributed teams, but there was no observable benefit of TCT. Furthermore, local and distributed teams performed similarly during their first, second, and final missions, however during missions 3 and 4, local team performance was superior to teams in the distributed condition.
99
Tightly-Structured Tasks Door Entry The good rooms variable provides a general picture of performance but does not indicate how well teams performed on the tightly- and loosely-structured components of this composite variable. Two tightly-structured tasks—door entry and gas canister disarming—required the collective efforts of each team member on a series of sequential tasks. For the door entry routine, the team leader and equipment each had their own unique tasks in order to open a door, launch a concussive grenade, and the enter the room in a predetermined order. A three-way (2 X 2 X 5) repeated measures ANOVA was performed to determine the effects of location and training on the change in mean time to conduct the door entry over the five missions. The multivariate criterion of Wilks’s Λ) revealed that for all teams the time to conduct the door entry routine decreased, Λ = .628, F (4, 25) = 3.70, p = .017, partial η2 = .372. This improvement in performance is evident from Table 7 and Figure 14. The interactions between mission and location, mission and training, or the mission by location by training, however, were not significant. Univariate tests associated with the location and training main effects were not significant, suggesting team location and communication training had no observable affect on door entry time.
100
Table 7: Means and Standard Deviations for Mean Door Entry Time in Seconds per Mission and Overall by Location and Training
Mission First
Location Local
Dist
Total
Second
Local
Dist
Total
Third
Local
Dist
Total
Fourth
Local
Dist
Total
Fifth
Local
Dist
Training No-TCT TCT Total No-TCT TCT Total No-TCT TCT Total No-TCT TCT Total No-TCT TCT Total No-TCT TCT Total No-TCT TCT Total No-TCT TCT Total No-TCT TCT Total No-TCT TCT Total No-TCT TCT Total No-TCT TCT Total No-TCT TCT Total No-TCT
101
M 17.94 17.77 17.86 20.42 20.13 20.27 19.18 18.95 19.06 16.65 14.54 15.60 16.94 17.79 17.36 16.80 16.16 16.48 15.98 13.91 14.95 12.23 16.22 14.22 14.11 15.06 14.58 13.33 14.09 13.71 19.47 15.04 17.26 16.40 14.57 15.48 14.54 14.01 14.27 11.90
SD 8.14 3.66 6.10 16.10 5.49 11.62 12.39 4.67 9.21 6.24 1.89 4.59 15.39 4.28 10.92 11.35 3.61 8.29 8.47 1.49 5.97 3.74 4.30 4.41 6.62 3.33 5.18 2.11 1.62 1.86 17.37 2.86 12.24 12.36 2.29 8.80 4.73 2.92 3.81 3.40
TCT Total No-TCT TCT Total No-TCT TCT Total No-TCT TCT Total No-TCT TCT Total
Total
Overall
Local
Dist
Total
16.93 14.42 13.22 15.47 14.34 15.69 14.86 15.28 16.19 17.22 16.71 15.94 16.04 15.99
25
5.58 5.16 4.21 4.56 4.46 2.60 1.93 2.25 10.30 3.45 7.44 7.26 2.96 5.46
Local no-TCT Local TCT Distributed no-TCT Distributed TCT
20
Seconds
15
10
5
0 1st
2nd
3rd
4th
5th
Overall
Mission Number
Figure 14: Mean Door Entry Time in Seconds by Location and Training over Missions
102
Canister Disarming Like the door entry routine, the canister disarming process required the sequential, collective performance of each team member in a tightly-structured procedure. Unlike door entry, however, teams encountered a varied number of armed canisters during their missions as noted in the materials and procedures and in early missions teams were less successful in properly disarming canisters. For these reasons, the number of properly disarmed canisters varied considerably across conditions. No distributed TCT team, for example, completed a canister disarming until the second mission. Accordingly, repeated measures analyses on the mean time to disarm canisters over the five missions was not appropriate as the number of teams successfully disarming canisters was not equal in every cell and residual degrees of freedom was insufficient for univariate and multivariate tests. Instead, a two-way MANOVA was performed to test the main effects of location and training with the mean time to disarm canisters for missions 2-5 as dependent variables. Results indicated no significant main effect for training, or a location by training interaction for the four evaluated missions. The main effect for location, in contrast, was significant, but only for the fourth mission, F (1, 22) = 4.36, p = .049, partial η2 = .165. Local teams required significantly less time to cap canisters than distributed teams, as indicated in Table 8 and Figure 15.
103
Table 8: Means and Standard Deviations for Mean Canister Disarming Time in Seconds per Mission and Overall by Location and Training
Mission First
Location Local
Dist
Total
Second
Local
Dist
Total
Third
Local
Dist
Total
Fourth
Local
Dist
Total
Fifth
Local
Dist
Training No-TCT TCT Total No-TCT TCT Total No-TCT TCT Total No-TCT TCT Total No-TCT TCT Total No-TCT TCT Total No-TCT TCT Total No-TCT TCT Total No-TCT TCT Total No-TCT TCT Total No-TCT TCT Total No-TCT TCT Total No-TCT TCT Total No-TCT
104
M 45.06 65.30 60.24 64.49 64.49 54.78 65.30 61.09 61.31 55.77 58.54 42.12 56.08 49.10 56.51 55.85 56.18 52.46 49.98 51.43 64.56 56.00 60.89 56.86 52.24 54.91 36.94 40.55 38.88 63.65 45.14 55.11 51.32 42.67 47.00 34.87 42.02 38.68 47.22
SD .40 10.13
13.74 0.40 8.97 22.75 14.40 17.30
9.87 20.91 11.76 15.71 16.37 16.00 15.52 16.53 23.79 18.61 16.74 17.82 16.87 10.53 11.72 10.88 31.62 11.09 25.37 27.17 11.21 20.83 8.43 13.11 11.40 18.81
TCT Total No-TCT TCT Total No-TCT TCT Total No-TCT TCT Total No-TCT TCT Total
49.51 22.19 48.29 19.73 Total 41.46 15.75 45.51 17.66 43.49 16.57 Overall Local 45.07 10.16 45.40 10.46 45.24 9.96 Dist 57.26 19.53 52.82 16.23 55.04 17.50 Total 51.17 16.30 49.11 13.73 50.14 14.87 Note. Because some teams did not complete a canister disarming procedure during their mission, or only one team type completed a disarming during a mission phase, means and standard deviations are missing for some cells.
70
All Local All Distributed
60
Seconds
50 40 30 20 10 0 1st
2nd
3rd
4th
Mission Number
Figure 15: Mean Canister Disarming Time in Seconds by Location 105
5th
Overall
To summarize, results for the door entry and canister disarming dependent variables suggest location and communication training did not produce major differences between teams on these tightly-structured tasks. For door entry, all teams improved performance over the five missions, needing less time to conduct the door entry, but there were no apparent effects of location or training. Canister disarming time also appeared to decrease for all teams over the missions, however because the repeated measures ANOVA was not possible on these data, this decrease may not be statistically significant. The only observable main effect was that of location during the fourth mission as local teams completed the disarming procedures more efficiently than distributed teams.
Loosely-Structured Tasks Unlike tightly-structured tasks which required a precise sequence of team memberspecific tasks, loosely-structured tasks, such as moving down the hallway, and searching rooms, followed a less stringent progression and individual subtasks (e.g., identifying neutral bystanders, neutralizing OpFors) could be completed by either team member.
Hallway Search Time Hallway search time encompassed the mean time spent moving from one room to the next during a mission, excluding time spent opening doors. Although participants were offered general guidelines for proper hallway search techniques during initial training, this task was less structured than the door entry or canister disarming tasks.
106
A three-way (2 X 2 X 5) repeated measures ANOVA tested the main effects of location and training on the change in mean time to search the hallways over the five missions. Multivariate tests based on Wilks’s Λ showed that the mission effect was significant, Λ = .213, F (4, 25) = 23.05, p < .001, partial η2 = .787, but no interactions between mission, location, and training were revealed. As is clear from Table 9 and Figure 16, the time to conduct hallway searches decreased for all teams from the first to last mission. However, the ANOVA’s univariate tests of the location and training main effects were not significant. Team location and TCT did not affect how quickly teams searched the hallways.
Table 9: Means and Standard Deviations for Mean Hallway Search Time in Seconds per Mission and Overall by Location and Training
Mission First
Location Local
Dist
Total
Second
Local
Dist
Total
Third
Local
Training No-TCT TCT Total No-TCT TCT Total No-TCT TCT Total No-TCT TCT Total No-TCT TCT Total No-TCT TCT Total No-TCT TCT Total
107
M 60.53 66.33 63.43 62.18 72.71 67.45 61.36 69.52 65.44 49.37 50.76 50.07 50.82 54.65 52.74 50.10 52.70 51.40 41.92 44.51 43.22
SD 10.34 18.41 14.73 15.73 24.44 20.59 12.89 21.16 17.73 16.03 11.78 13.61 12.97 14.67 13.53 14.11 13.01 13.42 7.32 10.14 8.65
Dist
Total
Fourth
Local
Dist
Total
Fifth
Local
Dist
Total
Overall
Local
Dist
Total
No-TCT TCT Total No-TCT TCT Total No-TCT TCT Total No-TCT TCT Total No-TCT TCT Total No-TCT TCT Total No-TCT TCT Total No-TCT TCT Total No-TCT TCT Total No-TCT TCT Total No-TCT TCT Total
108
41.78 48.31 45.04 41.85 46.41 44.13 37.49 40.53 39.01 42.60 44.08 43.34 40.05 42.30 41.17 38.39 37.40 37.89 37.71 44.74 41.23 38.05 41.07 39.56 45.54 47.90 46.72 47.02 52.90 49.96 46.28 50.40 48.34
8.30 10.45 9.72 7.56 10.14 9.10 7.18 9.00 8.02 13.68 9.51 11.41 10.88 9.13 9.95 10.34 9.27 9.50 7.65 11.76 10.25 8.79 10.91 9.87 6.05 8.63 7.30 9.52 12.89 11.36 7.74 10.90 9.53
80 Local no-TCT Local TCT
70
Distributed no-TCT Distributed TCT
60
Seconds
50 40 30 20 10 0 1st
2nd
3rd
4th
5th
Overall
Mission Number
Figure 16: Mean Hallway Search Time in Seconds by Location and Training over Missions Room Search Time Room search time was calculated as the mean time to search a room, from room entry of the Team Leader to room exit of the Team Leader. As with the hallway search activities, participants were trained with general guidelines for proper room search techniques, yet room search tasks were less structured than the tightly structured tasks. A three-way (2 X 2 X 5) repeated measures ANOVA was conducted on the main effects of location and training on the change in mean time to search the rooms over the five missions. Results of the mission main effect using the multivariate criterion of Wilks’s Λ were significant, Λ = .442, F (4, 25) = 23.05, p < .001, partial η2 = .558, thus all teams reduced their times to
109
search rooms over the five missions (see Table 10 and Figure 17). There were no interactions between mission, location, and training. The ANOVA’s univariate tests on the main effects of location and training did show a significant effect of location, F (1, 28) = 5.31, p =.029, partial η2 = .159, with local teams exhibiting shorter overall room search times than distributed teams. There was not, however, a significant main effect of training.
Table 10: Means and Standard Deviations for Mean Room Search Time in Seconds per Mission and Overall by Location and Training
Mission First
Location Local
Dist
Total
Second
Local
Dist
Total
Third
Local
Dist
Total
Training No-TCT TCT Total No-TCT TCT Total No-TCT TCT Total No-TCT TCT Total No-TCT TCT Total No-TCT TCT Total No-TCT TCT Total No-TCT TCT Total No-TCT TCT
110
M 91.31 85.09 88.20 79.34 88.93 84.14 85.33 87.01 86.17 59.57 57.72 58.64 68.96 73.31 71.14 64.26 65.51 64.89 47.53 54.62 51.07 62.91 59.35 61.13 55.22 56.98
SD 43.79 26.06 34.96 24.93 31.57 27.92 34.97 28.03 31.19 12.11 14.76 13.08 16.87 24.20 20.28 14.99 20.97 17.94 10.56 10.07 10.62 23.13 12.24 17.97 19.10 11.10
Fourth
Local
Dist
Total
Fifth
Local
Dist
Total
Overall
Local
Dist
Total
Total No-TCT TCT Total No-TCT TCT Total No-TCT TCT Total No-TCT TCT Total No-TCT TCT Total No-TCT TCT Total No-TCT TCT Total No-TCT TCT Total No-TCT TCT Total
111
56.10 45.51 47.42 46.46 55.45 60.85 58.15 50.48 54.13 52.31 43.16 44.89 44.02 47.91 62.62 55.26 45.53 53.75 49.64 57.42 57.95 57.68 62.91 69.01 65.96 60.17 63.48 61.82
15.39 9.45 12.56 10.79 16.43 17.88 16.83 13.93 16.46 15.12 10.16 9.45 9.52 12.65 23.95 20.00 11.36 19.83 16.43 10.80 5.18 8.19 11.68 11.56 11.66 11.24 10.37 10.77
100 Local no-TCT
90
Local TCT Distributed no-TCT
80
Distributed TCT
Seconds
70 60 50 40 30 20 10 0 1st
2nd
3rd
4th
5th
Overall
Mission Number
Figure 17: Mean Room Search Time in Seconds by Location and Training over Missions
To follow up the significant main effect of location, a one-way MANOVA was performed to determine the main effect of location on the mean room search time for all five missions. This analysis showed local and distributed teams only differed significantly on missions 2 and 4. For the second mission, local teams (M = 58.64, SD = 13.08) performed significantly better than distributed teams (M = 71.14, SD = 20.28), F (1, 30) = 4.29, p = .047, partial η2 = .125, as shown in Figure 18. Likewise, on mission 4, local teams (M = 46.46, SD = 10.79) had shorter search times than distributed teams (M = 58.15, SD = 16.83), F (1, 30) = 5.47, p =.026, partial η2 = .154. It is also worth noting location differences approached significance on the third (p = .064) and fifth missions (p = .051). 112
90
All Local 80
All Distributed 70
Seconds
60 50 40 30 20 10 0 1st
2nd
3rd
4th
5th
Mission Number
Figure 18: Mean Room Search Time in Seconds by Location over Missions
The above results indicate that for loosely-structured tasks, all teams improved performance on hallway and room search efficiency over the missions. Although no effects of location or training were revealed for hallway search time, local teams did perform room searches more quickly than distributed teams overall, stemming from statistically significant differences on missions 2 and 4.
Secondary Performance Measures Additional data on secondary performance variables did not reveal any significant differences between teams in the four conditions and are therefore not presented in detail. In
113
general, based on a series of three-way (2 X 2 X 5) repeated measures ANOVAs, there were significant improvements over the five missions on a number of variables (number of canisters missed, times Equipment Specialist was shot by OpFors, Team Leader collisions, and Equipment Specialist collisions), but univariate tests showed the main effects of location and training were only significant for one variable; Equipment Specialist collisions. For this variable, the main effect of location was significant, F (1, 28) = 9.19, p = .005, partial η2 = .247, with the Equipment Specialist on local teams (M = 55.34, SD = 15.90) having a greater number of collisions with objects in the VE than those on distributed teams (M = 39.27, SD = 13.20). A subsequent one-way MANOVA on the main effect of location for each of the five missions revealed the higher number of Equipment Specialist collisions for local teams were significantly different from distributed teams for the second, F (1,30) = 9.47, p = .004, partial η2 = .240, and fourth, F (1,28) = 5.09, p = .031, partial η2 = .145, missions.
Team Factors Questionnaire data were analyzed to assess similarity in mental models and team levels of cohesion and trust. The SMMQ revealed the degree of agreement between team members in four areas: purpose of the mission, procedures, personnel roles, and interpersonal factors. The GEQ-VE incorporated four subscales related to a team’s task and social integration and attraction to the task and group. Finally, the TTQ encompassed two subscales for cognitive and emotional trust between team members.
114
Shared Mental Models The 20-item SMMQ asked team members to make 70 individual judgments regarding the purpose of the VE missions, proper order of mission procedures, responsibilities of each team member, and interpersonal aspects. The SMMQ was administered after the first mission and again after the last mission. Using a nominal scale of measurement, 10 individual dependent variables related to the four SMM subscales (purpose, procedures, personnel, and interpersonal) were analyzed for agreement between team members. Although a common technique for judging agreement between observers on nominal scales is a relatively simple percentage of agreement calculation (number of agreements/total opportunities to agree), several authors (e.g., Hays, 1994; Howell, 1997) note this approach does not correct for chance agreements. Consequently, a chance-corrected measure of agreement, Cohen’s Kappa (κ), was employed for all but three items on the SMMQ. Cohen’s (1960) technique measures agreement on ranked or sorted items over and above the chance agreements expected for independent observations, providing a percentage agreement score ranging from -1.0 to 1.0. Three items related to communication during the missions and AARs, under the interpersonal subscale, were not amenable to Kappa calculations because many participants did not choose between the two options (me or my teammate) or wrote in a third option of “both.” For this reason, a number of Kappas were not computed because the technique requires a symmetric, 2-way table for which the values of the first rater match the values of the second rater. Accordingly, the non-chance corrected percentage of agreement technique was employed to evaluate agreement for these items (Howell, 1997). There are no concrete rules for interpreting Cohen’s Kappa, however several authors have offered reasonable guidelines on the relative strength of agreement for specific κ values. Fleiss (1981) contends κ values below .40 indicate poor agreement above chance levels, values 115
between .40 and .75 indicate fair agreement, and values above .75 suggest strong agreement between raters. In a more descriptive interpretation, Landis and Koch (1977) provided six levels of agreement for different κ values as shown in Table 11.
Table 11: Levels of Agreement for Cohen’s Kappa (κ) from Landis and Koch (1977) Value of κ
Level of Agreement
Below 0.00
None or Poor
0.00-0.20
Slight
0.21-0.40
Fair
0.41-0.60
Moderate
0.61-0.80
Substantial
0.81-1.00
Near Perfect
Because of the greater sensitivity of the Landis and Koch interpretation, these levels were used in the current analysis of the SMMQ subscales. To test the main effects of location and training over the two administrations of the SMMQ, a three-way repeated measures (2 X 2 X 2) MANOVA was performed. Nine of the 10 dependent variables in the analysis were κ values for variables related to: 1) purpose, 2) room search procedure, 3) door entry procedure, 4) can disarm procedure, 5) personnel, 6) Team Leader perceptions of mission strengths, 7) Equipment Specialist perceptions of mission strengths, 8) Team Leader perceptions of AAR strengths, and 9) Equipment Specialist perceptions of AAR strengths. The remaining dependent variable related to Interpersonal Communication was a percentage agreement between the Team Leader and Equipment Specialist. Results of the repeated measures analysis revealed a significant location by training 116
interaction on the interpersonal SMM variable of the agreement between an Equipment Specialist’s perceptions of his or her strengths during the AAR and the Team Leader’s perceptions of the Equipment Specialist’s strengths during the AAR, F (1,28) = 4.77, p = .037, partial η2 = .146. Local TCT teams (M = .2188, SD = .1976) and distributed no-TCT teams (M = .2455, SD = .2345) exhibited higher levels of agreement than local no-TCT (M = .0469, SD = .1760) and distributed TCT (M = .0915, SD = .2302) teams. Additional two-way (2 X 2) MANOVAs were conducted on all 10 dependent measures for each administration of the SMMQ. This approach is a valid alternative to repeated measures ANOVA and in essence becomes a two-way between-subjects analysis of the grouping variable and the repeated measures are treated as multiple dependent variables (see Tabachnik & Fidell, 1996). Because the SMMQ had not been validated previously, the decision was made to perform this secondary analysis in order to detect any possible group differences. This same approach was also used for the analyses of the cohesion and trust factors. The following sections describe MANOVA results for each subscale and an overall assessment of items participants agreed on the most.
Purpose One item asked participants to rank the goals of the team’s mission from least to most important for eight tasks. MANOVA results did not support an interaction or main effect of location, but did reveal a significant main effect for training on the first administration, F (1, 28) = 4.37, p = .046, partial η2 = .135. All TCT teams (M = .1429, SD = .1788) exhibited significantly higher degrees of agreement than no-TCT teams (M = .0268, SD = .1402). This difference was not found for the second administration of the SMMQ. The mean κ value for the 117
TCT teams on the first administration represents only a slight level of agreement according to guidelines established by Landis and Koch (1977). Furthermore, none of teams reported agreement levels above this slight level, as shown in Table 12.
Table 12: Mean Agreement on Mission Purpose for First and Second Administrations by Location and Training SMM Category Purpose First
Location Local
Training No-TCT TCT Total No-TCT TCT Total No-TCT TCT Total No-TCT TCT Total No-TCT TCT Total No-TCT TCT Total
M SD .0357 .1665 .2143 .1664 .1250 .1854 Dist .0179 .1193 .0714 .1708 .0447 .1450 Total .0268 .1402 .1429 .1788 .0848 .1687 Purpose Second Local .1786 .2832 -.0204 .1190 .0791 .2336 Dist .0714 .1708 .0938 .2011 .0826 .1806 Total .1250 .2326 .0367 .1702 .0808 .2054 Note. Values are Cohen’s Kappa (κ) and range from -1.0 to 1.0. Values above zero indicate increasing levels of agreement between team members.
Procedures Three items asked participants to report their mental models of mission procedures by placing a series of events in the proper order for the room search, door entry, and canister disarming tasks. No significant differences were found for the main effects or interaction between location and training. Overall, the mean total κ values for all teams suggest substantial
118
levels of agreement were achieved between team members on the second SMMQ administration for the door entry procedures (see Table 13). Furthermore, moderate levels of agreement were reported for the first administration on door entry and both administrations for the room search procedures. In contrast, only fair levels of agreement were reported for the canister disarming procedures on both administrations.
Table 13: Mean Agreement on Room Search, Door Entry, and Canister Disarming Procedures for First and Second Administrations by Location and Training SMM Category Room Search Procedure First
Location Local
Dist
Total
Door Entry Procedure -First
Local
Dist
Total
Canister Disarming Procedure Local - First Dist
Total
Room Search Procedure -
Local
Training No-TCT TCT Total No-TCT TCT Total No-TCT TCT Total Non-TCT TCT Total No-TCT TCT Total No-TCT TCT Total No-TCT TCT Total No-TCT TCT Total No-TCT TCT Total No-TCT
119
M .5000 .4524 .4762 .6429 .3393 .4911 .5714 .3958 .4836 .4000 .4500 .4250 .6625 .4929 .5777 .5313 .4714 .5013 .2250 .2857 .2554 .4000 .3250 .3625 .3125 .3054 .3089 .6327
SD .4041 .3773 .3785 .3968 .4641 .4456 .3938 .4128 .4068 .3117 .3240 .3082 .2066 .4625 .3569 .2892 .3864 .3371 .1909 .2949 .2420 .2507 .1953 .2205 .2335 .2424 .2341 .2516
Second
TCT Total No-TCT TCT Total No-TCT TCT Total No-TCT TCT Total No-TCT TCT Total No-TCT TCT Total No-TCT TCT Total No-TCT TCT Total No-TCT TCT Total
.4822 .4178 .5574 .3421 Dist .6429 .4252 .4970 .3701 .5670 .3923 Total .6378 .3375 .4896 .3814 .5637 .3622 Door Entry Procedure Local .6250 .2550 Second .6000 .2879 .6125 .2630 Dist .6857 .2587 .6036 .2358 .6446 .2429 Total .6554 .2501 .6018 .2542 .6286 .2496 Canister Disarming Procedure Local .2400 .1265 - Second .4333 .2960 .3367 .2415 Dist .2333 .2247 .3702 .3405 .3018 .2875 Total .2367 .1762 .4018 .3099 .3192 .2618 Note. Values are Cohen’s Kappa (κ) and range from -1.0 to 1.0. Values above zero indicate increasing levels of agreement between team members.
Personnel Nine items asked participants to report their mental models of team member responsibilities during the missions. These items covered checking rooms for OpFors, checking hallways for OpFors, neutralizing OpFors, checking gas canister state, capping gas canisters, disarming gas canisters, communicating with Sierra (the experimenter playing the role of an offsite commmander), checking the team’s air supply, and who has ultimate authority over the team’s actions. For each item, participants were to indicate which team member—the Team Leader, the Equipment Specialist, or both—was most responsible for each task. To assess the 120
personnel SMMs of each team, responses for all nine items were evaluated as a whole, providing one κ value for each team on this subscale. MANOVA results did not indicate any significant differences for the location by training interaction or the main effects. Overall, the mean total κ values for all teams suggest moderate levels of agreement were achieved between team members on perceptions of personnel responsibilities on both administrations (see Table 14).
Table 14: Mean Agreement on Personnel Responsibilities for First and Second Administrations by Location and Training SMM Category Personnel - First
Location Local
Training Non-TCT TCT Total Non-TCT TCT Total Non-TCT TCT Total Non-TCT TCT Total Non-TCT TCT Total Non-TCT TCT Total
M SD .6152 .2063 .4785 .2334 .5468 .2242 Dist .6211 .3223 .5127 .3475 .5669 .3286 Total .6181 .2614 .4956 .2865 .5569 .2769 Personnel - Second Local .5966 .2408 .5917 .1445 .5941 .1918 Dist .6477 .1762 .5227 .3838 .5852 .2957 Total .6221 .2055 .5572 .2824 .5897 .2452 Note. Values are Cohen’s Kappa (κ) and range from -1.0 to 1.0. Values above zero indicate increasing levels of agreement between team members.
121
Interpersonal Interpersonal items on the SMMQ assessed participants’ awareness of how the team interacts during the missions and the AAR and each team member’s strengths during these phases. Three items asked participants to report their mental models of who communicates more important, and unimportant, information during the missions, as well as whom most often leads the AAR discussion. An additional four items asked participants to rank their strengths, and that of their team member, during the missions and the AAR by ranking five different skills or abilities (see the SMMQ in Appendix X for more detail). As noted in the Material and Methods section, the three interpersonal communication items of the SMMQ could not be calculated with Cohen’s κ, thus data presented in Table 15 represent mean percent agreement between team members for all three items. Results of the overall MANOVA did not reveal any differences for the main effects of location and training or the interaction of these variables. Furthermore, the agreement percentages do not approach the 85% level, considered to be an acceptable minimum for interobserver reliability (Smith & Davis, 2003).
122
Table 15: Mean Agreement on Interpersonal Communication for First and Second Administrations by Location and Training SMM Category Interpersonal Communication - First
Location Local
Training No-TCT TCT Total No-TCT TCT Total No-TCT TCT Total No-TCT TCT Total No-TCT TCT Total No-TCT TCT Total
M SD .5000 .3086 .6250 .2136 .5625 .2644 Dist .6250 .2136 .5113 .3218 .5681 .2703 Total .5625 .2644 .5681 .2703 .5653 .2631 Interpersonal Communication Local .5834 .2955 -Second .6250 .3304 .6042 .3035 Dist .5000 .3564 .5125 .4212 .5063 .3770 Total .5417 .3192 .5688 .3703 .5552 .3403 Note. Values indicate non-chance corrected percentage of agreement calculated by dividing the number of agreements by the number of opportunities to agree. Larger values indicate higher levels of agreement between team members.
The additional four SMMQ items concerning perceptions of each team members’ strengths were evaluated by 1) comparing participants in the Team Leader role’s perceptions of their own strengths to their Equipment Specialist’s perceptions of the Team Leader’s strengths (“TL Own”), and 2) comparing the Equipment Specialist’s perceptions of their own strengths to their Team Leader’s perceptions of the Equipment Specialist’ strengths (“ES Own”). As each comparison was made for the VE missions and the AARs over two SMMQ administrations, Cohen’s κ was calculated for eight comparisons as shown in Table 16. For the eight comparisons, the MANOVA revealed a significant interaction between location and training for the TL Own AAR comparison on the first administration, F (1, 28) =
123
6.48, p = .017, partial η2 = .188. Local TCT teams (M = .4688, SD = .3822) exhibited significantly higher degrees of agreement than distributed no-TCT teams (M = -.0625, SD = .2216). The mean κ value for local TCT teams represents a moderate level of agreement, whereas the distributed no-TCT mean κ value is indicative of disagreement between the team members. Nevertheless, these main effects are qualified by the significant location by training interaction. MANOVA also indicated a significant main effect of location for the TL Own AAR comparison on the first SMMQ administration with all local teams (M = .2969, SD = .4303) exhibiting significantly higher degrees of agreement than distributed teams (M = .0469, SD = .2617), F (1, 28) = 4.46, p = .044, partial η2 = .137. Likewise, a significant main effect for training was revealed for the first SMMQ administration with all TCT teams (M = .3125, SD = .3594) exhibiting significantly higher degrees of agreement than no-TCT teams (M = .0314, SD = .3400), F (1, 28) = 5.64, p = .025, partial η2 = .168. On the second SMMQ administration, after teams had completed all five VE missions, the location and training main effects for the TL Own AAR dependent measure, or any of the remaining nine SMM measures, did not achieve significance. Overall, mean total κ values for all teams indicate only poor to slight levels of agreement for perceptions of Team Leaders’ and Equipment Specialists’ strengths during the VE missions and the AAR.
124
Table 16: Mean Agreement on Interpersonal Strength for First and Second Administrations by Location and Training SMM Category TL Own Mission - First
Location Local
Dist
Total
ES Own Mission -First
Local
Dist
Total
TL Own AAR – First
Local
Dist
Total
ES Own AAR - First
Local
Dist
Total
TL Own Mission – Second
Local
Dist
Training No-TCT TCT Total No-TCT TCT Total No-TCT TCT Total No-TCT TCT Total No-TCT TCT Total No-TCT TCT Total No-TCT TCT Total No-TCT TCT Total No-TCT TCT Total No-TCT TCT Total No-TCT TCT Total No-TCT TCT Total No-TCT TCT Total No-TCT TCT
125
M .1562 .0357 .0960 .1563 .2008 .1785 .1563 .1182 .1372 .3125 -.0313 .1406 .0313 .0833 .0573 .1719 .0260 .0990 .1250 .4688 .2969 -.0625 .1563 .0469 .0313 .3125 .1719 .0625 .3125 .1875 .3125 .0670 .1897 .1875 .1897 .1886 -.0313 .0000 -.0156 .0938 .3021
SD .4213 .3114 .3632 .2290 .4070 .3199 .3276 .3603 .3393 .3720 .2815 .3648 .2086 .4839 .3610 .3256 .3870 .3595 .4226 .3882 .4303 .2216 .2652 .2617 .3400 .3594 .3726 .2588 .1768 .2500 .3953 .2205 .3342 .3476 .2310 .2904 .1602 .2988 .2322 .1860 .5545
Total No-TCT TCT Total No-TCT TCT Total No-TCT TCT Total No-TCT TCT Total No-TCT TCT Total No-TCT TCT Total No-TCT TCT Total No-TCT TCT Total No-TCT TCT Total No-TCT TCT Total
.1979 .4137 .0313 .1800 .1510 .4577 .0912 .3474 ES Own Mission - Second Local -.1250 .1890 -.1563 .1294 -.1406 .1573 Dist .0625 .3204 .0625 .4173 .0625 .3594 Total -.0313 .2720 -.0469 .3191 -.0391 .2918 TL Own AAR – Second Local .1563 .2969 .2188 .4105 .1875 .3476 Dist .0313 .3116 .1964 .3912 .1138 .3522 Total .0938 .3010 .2076 .3876 .1507 .3462 ES Own AAR - Second Local .0313 .2478 .1250 .3536 .0781 .2989 Dist .1786 .2901 .1161 .3041 .1473 .2889 Total .1049 .2715 .1205 .3186 .1127 .2913 Note. Values are Cohen’s Kappa (κ) and range from -1.0 to 1.0. Values above zero indicate increasing levels of agreement between team members. Total
Cohesion The GEQ-VE was administered twice during the mission experimental session, after the first and final missions. For the first administration, a 2 X 2 MANOVA was conducted on the main effects of location and training on each of the four GEQ-VE subscales. Results indicated no
126
significant differences between conditions for the Group Integration-Task (GI-T), Group Integration-Social (GI-S), Interpersonal Attractions to the Group-Task (ATG-T), or Interpersonal Attractions to the Group-Social (ATG-S) subscales. A second 2 X 2 MANOVA on the second administration also revealed no significant differences on any of the four subscales of the GEQVE. Means and standard deviations for the both administrations are presented in Table 17 and Figure 19.
Table 17: Means and Standard Deviations for GEQ-VE Subscales by Location and Training for First and Last Administrations Subscale
Group Integration-Task
Group Integration-Social
Local M (first/last) 14.20 / 15.40 11.63 / 11.31 (SD) (1.29 / 1.49) (.88 / 1.03) Distributed M (first/last) 14.55 / 15.45 11.66 / 12.06 (SD) (1.64 / 1.31) (1.30 / 1.31) Local-TCT M (first/last) 16.05 / 16.58 11.66 / 11.59 (SD) (1.36 / .99) (1.65 / 1.80) Distributed-TCT M (first/last) 14.70 / 15.68 12.53 / 12.06 (SD) (2.03 / 1.50) (1.66 / 1.37) Note. Higher scores indicate greater reported cohesion levels.
127
Interpersonal Attractions to Group-Task
Interpersonal Attractions to Group-Social
13.47 / 15.19 (1.39 / 1.43)
10.73 / 11.10 (.73 / 1.04)
14.22 / 15.63 (1.86 / 1.52)
11.05 / 11.08 (1.39 / 1.30)
14.63 / 15.38 (1.52 / 2.15)
10.60 / 10.60 (1.48 / 1.63)
14.13 / 15.41 (2.72 / 2.07)
11.48 / 11.70 (1.11 / 1.22)
Local no-TCT Distributed no-TCT Local-TCT Distributed-TCT
18 16 14
Score
12 10 8 6 4 2 0 GI-T 1st
GI-T 2nd
GI-S 1st
GI-S 2nd
ATG-T 1st
ATG-T ATG-S 2nd 1st
ATG-S 2nd
Subscale and Administration
Figure 19: Mean GEQ-VE Subscale Scores by Location and Training for First and Last Administrations Trust The TTQ was also administered after the first mission and again after the final mission. A two-way MANOVA was conducted on the main effects of location and training on each of the two TTQ subscales for both administrations. As noted previously, this approach is a valid alternative to repeated measures analyses (Tabachnik & Fidell, 1996). For scores on the first administration, the interaction between location and training for emotional and cognitive trust, as well as the main effects on the emotional trust subscale, were not significant. There were, however, significant main effects for location and training on the cognitive trust subscale. All local teams (M = 12.94, SD = 1.49) reported significantly higher degrees of cognitive trust than
128
distributed teams (M = 11.98, SD = 1.28), F (1, 28) = 5.17, p = .031, partial η2 = .156. For the main effect of training, TCT-trained teams (M = 13.08, SD = 1.56) reported significantly higher degrees of cognitive trust than no-TCT teams (M = 11.88, SD = 1.05), F (1, 28) = 8.79, p = .006, partial η2 = .239. For the second TTQ administration, the MANOVA again did not reveal a significant interaction or main effects for the emotional trust subscale. Furthermore, the main effect for location on the cognitive trust subscale found for the first administration was not found for the second administration. Local and distributed teams were not significantly different on reported levels of cognitive trust after the last VE mission. The main effect for training, however, did remain for the cognitive trust subscale for the second administration with TCT-trained teams (M = 13.02, SD = 1.25) reporting significantly higher degrees of cognitive trust than no-TCT teams (M = 12.18, SD = .91), F (1, 28) = 5.70, p = .035, partial η2 = .149. Means and standard deviations for the main effects over both administrations are presented in Table 18 and Figure 20.
129
Table 18: Means and Standard Deviations for TTQ Subscales by Location and Training for First and Second Administrations Subscale and Administration
Cognitive Trust First
Cognitive Trust Second
Emotional Trust First
Emotional Trust Second
12.89 (1.53)
13.78 (2.09)
12.42 (2.07)
13.42 (1.96)
12.69 (2.27)
13.59 (2.13)
12.63 (1.27)
13.61 (1.93)
All Local M 12.94 12.58 (SD) (1.50) (1.27) All Distributed M 11.98 12.62 (SD) (1.28) (1.09) All Non-TCT M 11.83 12.18 (SD) (1.05) (.91) All TCT M 13.08 13.02 (SD) (1.56) (1.25) Note. Higher scores indicate greater reported trust levels.
14
13.5
All Local All Distributed All no-TCT All TCT
Seconds
13
12.5
12
11.5
11
10.5 Cognitive 1st
Emotional 1st
Cognitive 2nd
Emotional 2nd
Mission Number
Figure 20: Mean Cognitive and Emotional Trust Scores by Location and Training for First and Last Administrations
130
Team Factors Correlations An underlying assumption of the SMM, cohesion, and trust team factors as measured in the current study is team communication influences the development and maintenance of these characteristics. As such, it is conceivable that measurements of these factors tap overlapping features of the team relationship. For example, interpersonal mental model items in the SMMQ assessed team members’ perceptions of how the team interacts during the missions and the AAR and each team member’s strengths during these phases including remembering task procedures and completing tasks quickly and accurately. These perceptions have obvious parallels to trust and cohesion. Recall that trust was measured as the attitude held by team members regarding the emotional closeness with, and reliability and competence of, another team member. Similarly, cohesion encompassed the degree to which group or team members were committed to the task (task cohesion), and the degree to which participants were attracted to each other and had positive relationships (social cohesion). To measure possible overlap between these three team characteristics, a series of Pearson product-moment correlation coefficient (r) analyses were conducted as described below.
Shared Mental Models and Cohesion Pearson correlations were computed among the mean SMMQ scores and mean GEQ-VE scores for teams in all conditions. To reduce the total number of comparisons per analysis and control for increased Type I error, scores for each of the 10 dependent variables from the SMMQ were compared against the four subscales of the GEQ-VE. Therefore, each analysis compared five variables (SMMQ score, Group Integration-Task, Group Integration-Social, Attraction to 131
Group-Task, and Attraction to Group-Social) for a total of 10 correlations. Using the Bonferroni approach to control for Type I error, a p value less than .005 (.05/10 = .005) was needed for significance. When scores for the first administration of the two measures were compared, no significant correlations between any of the SMMQ variables and the four GEQ-VE subscales were detected. Likewise, when no significant correlations were found for scores on the second administration of the measures. A second series of analyses were conducted to determine if scores were related across administrations. In other words, did SMMQ or GEQ-VE scores from one administration correlate with scores on the other administration. Again, no correlations were found that achieved the .005 level of significance.
Shared Mental Models and Trust Pearson correlations were also computed among the mean SMMQ scores and mean TTQ scores for teams in all conditions. As before, scores for each of the SMMQ measures were compared against the two subscales of the TTQ (cognitive trust and emotional trust), with first and second administrations analyzed separately. Each analysis therefore involved three variables (SMMQ score, cognitive trust, emotional trust) for a total of three correlations. The Bonferroni adjustment specified a p value of .017 was needed to achieve significance. For the first administration, results indicated that SMM scores on the purpose of the missions was positively correlated with mean ratings of cognitive trust, r(32) = .425, p = .015. The remaining comparisons for the first administration, as well as all comparisons for the second administration, did not achieve the .05 level of significance.
132
A second series of analyses evaluated if SMMQ or TTQ scores from one administration correlated with scores on the other administration. For the comparison of first administration SMMQ scores and TTQ scores on the second administration, and the reverse comparison of second administration SMMQ scores and first administration TTQ scores, no significant results were found at the .017 level of significance.
Cohesion and Trust A common feature cohesion and trust is an emotional closeness or bond between members of a team. This social element of the team relationship is therefore likely to be represented by scores on the emotional trust subscale of the TTQ and the two social cohesionrelated subscales of the GEQ-VE. This relationship was tested by correlating scores on each measure. Further, although parallels between the concepts of cognitive trust and task cohesion are less obvious parallels, it was worthwhile to also evaluate any potential relationships. To test this assumption, Pearson correlations were computed among the mean GEQ-VE scores and mean TTQ scores for teams in all conditions. Each analysis compared six variables (Group Integration-Task, Group Integration-Social, Attraction to Group-Task, and Attraction to Group-Social from the GEQ-VE and cognitive and emotional trust from the TTQ) for a total of 15 correlations. Using the Bonferroni approach to control for Type I error, a p value less than .003 was needed for significance. For the first administration, the comparison between four GEQ-VE subscale scores and two TTQ items (cognitive trust and emotional trust) revealed a number of positive correlations, as shown in table 19, at a Bonferroni adjusted level of significance of .0083 for the six comparisons (.05/6 = .0083). In addition to positive correlations between the GEQ-VE subscales, 133
the Group Integration-Task subscale—a measure of the similarity, closeness, and bonding within the team as a whole around the group's task—was positively correlated with cognitive and emotional trust. Similarly, the Attraction to Group-Task subscale—indicative of the team member's feelings about his or her personal involvement with the group task, productivity, and goals and objectives—was positively correlated with cognitive trust, but not emotional trust. In general, results suggest that after their first VE mission, teams reporting higher levels of group integration related to the task also exhibit higher levels of cognitive and emotional trust. Teams reporting higher levels of attraction to the group task also report higher levels of cognitive trust.
Table 19: Correlations Between Mean GEQ-VE and TTQ Scores over all Conditions on the First Administration
Group Integration-Task Group Integration-Social Attraction to Group-Task Attraction to Group-Social Cognitive Trust Emotional Trust
Group IntegrationTask .405 .632* .231 .653* .504*
Group IntegrationSocial .301 .705* .043 .160
Attraction to Group-Task
Attraction to Group-Social
Cognitive Trust
.235 .510* .490
.050 .192
.344
Note. *Correlation is significant at the Bonferroni adjusted level of p = .003; n = 32 for all comparisons.
Pearson correlations were also conducted on mean scores for the second administration of the GEQ-VE and TTQ. Results again indicated significant positive correlations between subscales of the GEQ-VE, as would be expected, as well as between the GEQ-VE and TTQ, as shown in Table 20. As during the first administration, the Group Integration-Task subscale was positively correlated with emotional trust for the second administration, however the correlation with cognitive trust failed to reach significance. This same pattern was found for the Attraction 134
to Group-Task subscale which was positively correlated with cognitive trust on the first administration but not on the second. These results indicate that at the end of five VE missions, teams reporting higher levels of group integration related to the task reported higher levels of emotional trust, however in contrast to the first administration, there was no positive correlation with cognitive trust.
Table 20: Correlations Between Mean GEQ-VE and TTQ Scores over all Conditions on the Second Administration
Group Integration-Task Group Integration-Social Attraction to Group-Task Attraction to Group-Social Cognitive Trust Emotional Trust
Group IntegrationTask .220 .611* .429 .292 .525*
Group IntegrationSocial .274 .417 .313 .387
Attraction to Group-Task
Attraction to Group-Social
Cognitive Trust
.574* .221 .468
.100 .413
.183
Note. *Correlation is significant at the Bonferroni adjusted level of p = .003; n = 32 for all comparisons.
A second series of analyses evaluated if GEQ-VE or TTQ scores from one administration correlated with scores on the other administration. For the comparison of first administration GEQ-VE scores and second administration TTQ scores, no significant correlations were found at the .003 level of significance (see Table 21). For the reverse comparison, second administration GEQ-VE scores and first administration TTQ scores, cognitive and emotional trust levels were positively correlated with Group Integration-Task scores, suggesting that teams with higher trust levels early in the experiment developed higher levels of group integration related to the task at the end of the experiment.
135
Table 21: Correlations Between Mean Second Administration GEQ-VE and First Administration TTQ Scores over all Conditions Attraction to Attraction to Cognitive Group Group Group-Task Group-Social Trust IntegrationIntegrationSocial Task Group Integration-Task Group Integration-Social .220 Attraction to Group-Task .611* .274 Attraction to Group-Social .429 .417 .574* Cognitive Trust .561* .080 .211 .061 Emotional Trust .539* .317 .431 .295 .344 Note. *Correlation is significant at the Bonferroni adjusted level of p = .003; n = 32 for all comparisons.
Overall, the above analyses indicate no apparent relationship between SMMs and cohesion and only one correlation between SMMs for the purpose of the missions and cognitive trust, but only on the first administration. In contrast, task-related cohesion was positively correlated with cognitive and emotional trust after teams had completed the first VE mission. After five missions, however, only emotional trust correlated positively with task cohesion.
Additional Measures In addition to the main dependent variables to assess performance and team characteristics, the present study also assessed simulator sickness and several features of the distributed team condition to determine if these factors influenced performance or the team factors. Simulator sickness data and responses from the End Questionnaire are presented in subsequent sections. Additional measures were collected in this study, as outlined in the Materials and Method section to allow for future comparisons between prior research at ARI, the aforementioned findings from Singer et al. (2001), and the present study. These included measures of presence, immersive tendencies, and mission situation awareness. Findings from 136
these measures are not included in the present discussion. Furthermore, digital audio/video recordings of the AAR sessions were recorded for later comparisons of verbal and nonverbal communication.
Simulator Sickness A common feature in ARI’s VE research program is the assessment of simulator sickness. Simulator sickness results from exposure to a simulation or VE environment and is characterized by one of several physical symptoms including disorientation, nausea, and eye strain. Because these symptoms can potentially affect performance in a VE setting, and, in extreme cases, the physical well-being of research participants, simulator sickness is closely monitored in all phases of experiments conducted by ARI. In the present study, simulator sickness was evaluated with a modified version of the Simulator Sickness Questionnaire (SSQ, see Appendix E). The SSQ is a self-report measure developed by Kennedy et al. (1993) comprised of three subscales and a combined total severity scale. Subscales are computed by summing severity scores for a set of symptoms and weighting those sums (using a different weight for each scale) with Total Severity computed as a combination of scores on the three subscales. The Nausea subscale encompasses symptoms related to general discomfort, increased salivation, sweating, nausea, difficulty concentrating, stomach awareness, and burping. The Oculomotor Discomfort subscale includes symptoms associated with fatigue, headaches, eyestrain, difficulty focusing, difficulty concentrating, and blurred vision. The Disorientation subscale captures the respondent’s ratings on difficulty focusing, nausea, fullness of head, blurred vision, dizziness with eyes open, dizziness with eyes closed, and vertigo. Each participant completed a total of 20 SSQs over the course of the 137
experiment, 10 during the VE training phase, and 10 during the mission phase. In general, the SSQ was administered immediately before and after each VE exposure. Training differences in SSQ severity were not analyzed for the first 10 SSQ administrations in the present study, although future analyses of these data may be appropriate. Mean scores and comparisons across conditions for the final 10 administrations, which covered the mission phase of the experiment, are presented below. A two-way MANOVA was performed on the main effects of location and training, and the location by training interaction for mean scores on the nausea, oculomotor discomfort, disorientation subscales and total severity before and after each mission. For scores on all subscales and total severity, there was no significant interaction between location and training. There were, however, several significant differences for the main effects. These are described below, organized by subscale and total severity.
Nausea A significant main effect of location was found for mean scores on the nausea subscale on SSQ administrations before and after mission 4. Prior to mission 4, all local teams (M = .30, SD = 1.69) reported significantly less nausea than distributed teams (M = 2.63, SD = 6.19), F (1, 57) = 4.47, p = .039, partial η2 = .073. The same relationship was shown after mission 4 with local teams (M = 2.13, SD = 3.99) reporting less nausea than distributed teams (M = 5.26, SD = 7.47), F (1, 57) = 4.16, p = .046, partial η2 = .068. This finding is illustrated in Figure 21.
138
7
6
SSQ Score
5
Pre-Local Post-Local Pre-Distributed Post-Distributed
4
3
2
1
0 1st
2nd
3rd
4th
5th
Mission Number
Figure 21: Mean Nausea Subscale Scores Pre- and Post-mission by Location over Missions
Oculomotor Discomfort A significant main effect of location was found for mean scores on the oculomotor discomfort subscale on SSQ administrations before mission 3. All local teams (M = 1.46, SD = 4.05) reported significantly less oculomotor discomfort than distributed teams (M = 5.75, SD = 7.21), F (1, 57) = 8.22, p = .006, partial η2 = .126, as shown in Figure 22.
139
8 7
SSQ Score
6
Pre-Local Post-Local Pre-Distributed Post-Distributed
5 4 3 2 1 0 1st
2nd
3rd
4th
5th
Mission Number
Figure 22: Mean Oculomotor Subscale Scores Pre- and Post-mission by Location over Missions
Disorientation MANOVA results indicated a significant main effect of location and training for scores on the disorientation subscale before missions 1, 2 and 3. Prior to mission 1, no-TCT teams (M = 3.21, SD = 6.90) reported significantly more disorientation than TCT teams (M = .46, SD = 2.54), F (1, 57) = 4.25, p = .044, partial η2 = .069. Similarly, prior to mission 2, more disorientation was reported by no-TCT teams (M = 5.07, SD = 9.83) than TCT teams (M = 0.00, SD = 0.00), F (1, 57) = 7.97, p = .007, partial η2 = .123. Mean scores for no-TCT and TCT teams for all missions are presented in Figure 23.
140
7
Pre No-TCT Post No-TCT Pre-TCT Post-TCT
6
SSQ Score
5
4
3
2
1
0 1st
2nd
3rd
4th
5th
Mission Number
Figure 23: Mean Disorientation Subscale Scores Pre- and Post-mission by Training over Missions
A significant main effect of location was found for mean scores on the disorientation subscale prior to mission 3. Local teams (M = .47, SD = 2.46) reported significantly less disorientation than distributed teams (M = 4.32, SD = 7.54), F (1, 57) = 7.30, p = .009, partial η2 = .113, as illustrated in Figure 24.
141
8
Pre-Local Post-Local Pre-Distributed Post-Distributed
7
SSQ Score
6 5 4 3 2 1 0 1st
2nd
3rd
4th
5th
Mission Number
Figure 24: Mean Disorientation Subscale Scores Pre- and Post-mission by Location over Missions
Total Severity Results of the MANOVA also showed a significant main effect for location prior to mission 3 on total SSQ severity scores. Local teams (M = 1.33, SD = 3.75) reported significantly less total severity than distributed teams (M = 5.42, SD = 7.25), F (1, 57) = 7.58, p = .008, partial η2 = .117. Mean total SSQ scores for local and distributed teams are depicted in Figure 25.
142
8 7
SSQ Score
6
Pre-Local Post-Local Pre-Distributed Post-Distributed
5 4 3 2 1 0 1st
2nd
3rd
4th
5th
Mission Number
Figure 25: Mean Total Severity Scores Pre- and Post-mission by Location over Missions
Overall, results indicate distributed teams in both training conditions exhibited higher total simulator sickness severity prior to the third mission. Analyses of the SSQ subscales showed this elevation in total severity was attributed to increased oculomotor discomfort and disorientation. A similar relationship was found on the nausea subscale before and after mission 4, with distributed teams exhibiting higher levels of symptoms than local teams, yet differences on oculomotor discomfort, disorientation, and total severity were not significant. In summary, some aspect of the distributed experimental setting led to increased simulator sickness during the middle portion of the mission exercises.
143
In view of the overall goals of the study, an additional analysis was conducted to determine if SSQ scores were related to team performance during the VE missions. Pearson correlations were computed among the mean good rooms for all teams for a given mission and SSQ total and subscale means for administrations surrounding a particular mission. Thus each individual analysis compared four variables (good rooms, SSQ score at end of previous mission, before current mission, and end of current mission) for a total of 6 correlations. Using the Bonferroni approach to control for Type I error, a p value less than .0083 (.05/6 = .0083) was necessary for significance. Results indicated that disorientation subscale scores obtained prior to mission 4 were positively correlated with the mean number of good rooms for mission 4, r(32) = .492, p = .004. These results suggest as disorientation increased, there was also an increase in performance, not a decrease as would be expected when participants experience simulator sickness symptoms. Clearly this relationship, albeit interesting, is of little value to the current study. The same type of analysis was performed individually on local and distributed teams. Results for local teams again did not reveal any negative correlations between mean number of good rooms and SSQ scores. For distributed teams, there was one negative correlation, r(32) = .709, p = .002, but this was between mean good rooms for mission 5 and scores on the nausea subscale prior to mission 2. This relationship is not considered meaningful, however, because of the separation in time between these two variables. The pre-mission 2 SSQ was administered roughly 1.5 hr before distributed teams attempted their fifth mission. Accordingly, although distributed teams exhibited elevated SSQ scores prior to mission 3, and before and after mission 4, there does not appear to be a relationship between simulator
144
sickness symptoms and mission performance as measured by the mean number of rooms properly searched during a mission.
End Questionnaire The primary purpose of this questionnaire was to assess if distributed team participants believed there partner was at a geographically distant location. To best replicate the experimental conditions in Singer et al. (2001), participants in the present study were told their teammate was “at a distant location” with no more details offered. Although distributed team members only met one another after the experiment had concluded, and safeguards where in place to avoid team member visual contact before and during the experiment, because all participants were drawn from a population of students at the same university, it was possible some believed their teammate was actually closer than described by the experimenter. Therefore, on the End Questionnaire (see Appendix F) participants were asked to rate on 9-point Likert scale (10 mile increments ranging from 1 = 0-1 miles to 9 = 70+ miles) how far away they believed their partner was. Two additional items asked if they would have performed better if their partner were in the same room and if they would have liked to meet their partner (9-point Likert scale; strongly agree to strongly disagree). The End Questionnaire also contained four “placebo” items regarding the quality of the audio and visual information provided by the VE system in order to reduce the emphasis on the distance question. A one-way MANOVA on the main effects of training for Team Leader and Equipment Specialist responses on the three items related to distance, performance, and meeting one’s partner was not significant, indicating no differences between TCT and no-TCT distributed teams. When asked, “How far away do you think your partner is,” the mean response for all 145
teams was 2.54, as shown in Table 22. This value is roughly equivalent to 10 miles on the question’s scale. Distributed participants also were relatively neutral when asked if they would have performed better if their partner was in the same room. There was slightly higher agreement when participants were asked if they would have liked to meet their partner.
146
Table 22: Mean Responses on Partner Distance Estimation, Performance Differences, and Meeting One’s Partner for Distributed Team Leaders and Equipment Specialists by Training Condition Question Partner Distance
Role TL
Training No-TCT TCT Total No-TCT TCT Total No-TCT TCT Total No-TCT TCT Total No-TCT TCT Total No-TCT TCT Total No-TCT TCT Total No-TCT TCT Total No-TCT TCT Total
M SD 1.50 0.58 3.00 2.56 2.50 2.20 ES 2.25 2.50 2.75 2.19 2.58 2.19 Total 1.88 1.73 2.88 2.31 2.54 2.15 Better Performance if Partner TL 5.00 3.27 in Same Room 5.25 2.25 5.17 2.48 ES 4.00 2.94 5.13 3.31 4.75 3.11 Total 4.50 2.93 5.19 2.74 4.96 2.76 Meet Partner TL 8.00 2.00 7.00 1.20 7.33 1.50 ES 5.50 2.38 7.75 1.39 7.00 2.00 Total 6.75 2.44 7.38 1.31 7.17 1.74 Note. Values are based on a 9-point Likert Scale. Partner Distance items are rated from 1 = 0-1 miles to 9 = 70+ miles. Better Performance and Meet Partner items are rated from 1 = strongly disagree to 9 = strongly agree.
147
CHAPTER 4: DISCUSSION
The present research endeavored to explain earlier findings that teams sharing the same physical location as they complete a series of VE-based missions perform better than teams with members operating from different physical locations. In that study (Singer et al, 2001), local and distributed teams exhibited no significant performance differences for the first of eight VE missions. However, after each team had completed at least one post-mission discussion of their performance, local teams gained a performance advantage on the second mission which remained for the rest of the missions. Because the primary difference between these local and distributed teams was that distributed personnel never met or had visual contact with their partner, and that the local/distributed difference first surfaced after both teams had completed their first AAR, the guiding premise of the current study was that some aspect of team performance in a VE is dependent on FTF contact between team members during post-mission discussions. Several communication-dependent team factors were identified as potential explanations for the local-team advantage in Singer et al (2001). Evidence from a variety of domains suggests performance is improved if team members possess similar mental models for the collective task (Bolstad & Endsley, 1999; Orasanu & Salas, 1993), as well as high degrees of trust and cohesion (Zaccaro et al., 1995). Because FTF communication has a positive effect on team processes related to each of these factors, it was hypothesized that distributed teams in Singer et al. exhibited less similar mental models and degraded cohesion and trust in comparison to local teams, which may have been responsible for their poor performance. The current study therefore 148
tested this prediction by replicating Singer et al.’s local and distributed team comparisons with the addition of dependent variables to measure teams’ shared mental models (SMMs), cohesion, and trust. An additional prediction in the current study was if distributed teams learned skills to facilitate communication during the missions and the AARs, this may reduce barriers to effective communication that negatively affected distributed team performance in the previous study. For this reason, half of the teams in the current study received a 1 hr training session in team communication addressing techniques to improve process, information exchange, feedback, and shared model elements of communication. This study therefore manipulated the variables of location (local vs. distributed) and communication training (TCT vs. no-TCT) to test 11 hypotheses focused on how FTF contact during post-mission discussions affects VE performance. Results from measures of overall performance and the three team factors provided only partial support for these hypotheses as listed below.
1. Local teams will outperform distributed teams during VE missions The results of multivariate analyses did support that local teams outperformed distributed teams; however the difference was not universal across all performance measures. For the mean number of rooms properly searched over all five missions, local teams exhibited better performance than distributed teams. When compared mission-by-mission, however, local teams were superior only for missions 3 and 4. Furthermore, analyses of more specific mission performance revealed local teams required less time to disarm gas canisters during their fourth mission and had lower room search times, but only for missions 2 and 4. 149
2. Distributed TCT teams will perform as well as local no-TCT teams during VE missions The absence of any significant training by location interactions for all performance measurements indicates that distributed TCT teams did in fact perform as well as local no-TCT teams for the five missions.
3. The SMMs of local teams will be more similar than distributed teams In contrast to mission performance, there were very few SMM differences between local and distributed teams. Based on the degree to which team members agreed on their reported perceptions for purpose, procedure, personnel, and interpersonal SMMs, the only significant main effect of location was on the levels of agreement between a Team Leader’s own perceptions of his or her strengths during the AAR sessions and an Equipment Specialist’s perceptions of the Team Leader’s strengths, and only for the first administration of the SMMQ. For this variable, local teams reported higher levels of agreement than distributed teams, suggesting local teams had more similar mental models of each player’s contributions to the AAR process. It is worthwhile to note that the converse relationship of this variable, a comparison of the Equipment Specialist’s own perceptions of AAR strengths and the Team Leader’s perceptions of the Equipment Specialist’s strengths, did not produce a significant main effect for location.
4. The SMMs of TCT teams will be more similar than no-TCT teams For the same SMM variable of the Team Leader’s perceptions of AAR strengths, there was a significant main effect for training. TCT teams reported greater levels of agreement 150
between team leaders and equipment specialists on the leader’s AAR strengths than no-TCT teams, but only for the first administration of the SMMQ. In addition, TCT teams exhibited higher levels of agreement when asked to rank the goals of the team’s mission for the first administration, but again this difference was not evident on the second administration.
5. The SMMs of local TCT, local no-TCT, and distributed TCT teams will be more similar than distributed no-TCT teams A significant location by training interaction was found for the team leader’s perceptions of AAR strengths, but only on the first administration. Post-hoc tests revealed that local TCT teams reported higher levels of agreement on this variable than distributed, no-TCT teams, but no significant differences between local TCT, local no-TCT, or distributed TCT teams. No interactions were found for the remaining SMM measures on the first and second administrations.
6. Local teams will exhibit higher levels of cohesion, both task and interpersonal, than distributed teams 7. TCT teams will exhibit higher levels of cohesion than no-TCT teams 8. Local TCT, local no-TCT, and distributed TCT teams will exhibit higher levels of cohesion than distributed no-TCT teams For team levels of interpersonal and task cohesion, no significant differences were found for the main effects of location and training, or the training by location interaction. Accordingly, hypotheses 6, 7, and 8 above were not supported.
151
9. Local teams will report higher levels of emotional trust than distributed teams, but differences for cognitive trust between team types will not be significant In contrast to this hypothesis, emotional trust levels were not different between local and distributed teams, but local teams did report higher levels of cognitive trust than distributed teams on the first administration of the TTQ, but not the second.
10. TCT teams will exhibit higher levels of emotional trust than no-TCT teams Again, the hypothesis regarding emotional trust was not supported for the TCT variable, however TCT teams did report higher levels of cognitive trust than the no-TCT teams for both the first and second TTQ administrations.
11. Local TCT, local no-TCT, and distributed TCT teams will exhibit higher levels of emotional trust than distributed no-TCT teams No differences were found between teams on levels of emotional trust. Furthermore, there was no significant training by location interaction for levels of reported cognitive trust. In summary, local teams in the present study did perform better than distributed teams. Overall, local teams successfully searched a larger number of rooms in the virtual buildings over the five missions. These findings are less robust, however, than those of Singer et al. (2001). For example, when comparing performance on each individual mission, the local team advantage was only present for missions 3 and 4 and disappeared on the final mission. In the previous study, local teams performed better than distributed teams after the first mission and maintained this superiority for the remaining missions. Furthermore, TCT did not produce any observable
152
benefits for either local or distributed teams with regard to performance and in fact TCT teams exhibited poorer performance, albeit not statistically so, than untrained teams. With regard to the team factors hypothesized to account for a portion of the performance variance in Singer et al. (2001), the main effect of location was significant for only one of 10 SMM dependent measures on the first administration of the SMMQ after the first VE mission. After the first VE mission, local teams reported greater agreement with regard to the Team Leader’s strengths during the AAR. Local teams also reported higher levels of cognitive trust than distributed teams after the first and fifth missions. Cohesion differences, however, were not found. The main effect of TCT produced similar results to the location main effect. Compared to no-TCT teams, TCT teams exhibited higher levels of agreement regarding the Team Leader’s AAR strengths after the first mission, and higher levels of cognitive trust after the first and fifth missions. The following sections present possible explanations for these findings and offer implications for future U.S. Army distributed VE programs continued research. The discussion is organized by mission performance, the team factors, and the TCT approach.
Performance The first main goal of the present study was to corroborate the finding that VE teams operating in the same physical location perform better than teams with members at distant geographic locations. Understanding this relationship has implications not only for future U.S. Army VE-based distributed training applications, but in other military branches as well as domains utilizing distributed collaborations such as education, business, and spaceflight. A 153
consistently negative correlation between partner distance and distributed team performance would obviously limit the utility of this approach for collaborative activities. Although the present results do support that distributed teams exhibit degraded performance, this difference was less pronounced and reliable than results from the earlier Singer et al. (2001) evaluation. Part of this discrepancy may be explained by how the distributed team condition was designed for each study and how differences affected team interactions. In the first study, distributed teams were split between Orlando, Florida and Toronto, Canada, whereas in the present study, distributed team members were located in different rooms in the same building in Orlando. Although distributed participants experienced the same experimental conditions as in Singer et al. (no pre-mission contact, no FTF contact during missions or AARs) and were told their partner was at a “distant location,” it is possible that familiarity with a teammate’s dialect or other cues led participants to react differently and therefore alter the distributed team relationship from before. For example, in Singer et al., some of the Canadian participants possessed thick French accents and used slang terms uncommon to the American college student vernacular; obvious signs they were at a distant location. In the current study, similar cues about a partner’s location were absent as participants were drawn from the same undergraduate psychology population. Further support that the distributed condition was not fully replicated comes from distributed team member responses on a questionnaire administered at the end of the experiment asking participants to indicate how far away they believed their partners were during the missions. On average, participants reported their partner was around 10 miles away. It is unclear whether distributed teams would have performed any worse thinking their partner was located at an even greater distance, although responses were mixed when participants were asked on the 154
same questionnaire if they would have performed better with their teammate in the same room. Nevertheless, it is defensible that participants in Singer et al. (2001), even though they did not make distance estimations at the end of the study, were aware the separation was far greater than 10 miles (Toronto is over 1200 miles from Orlando). Because distributed teams in both studies operated within the same communication modality, differences between the two studies might therefore be explained in how team members perceived the physical and psychological distance of their partner. As previously mentioned, social presence, also termed immediacy by Mehrabian (1972), refers to perceptions of the physical and psychological separation between two communicators. Williams’ (1977) review established that less rich communication modalities reduce levels of social presence, however it is also possible that teams using the same communication modality can experience dissimilar levels of social presence based on environmental cues about the location of, or similarity with, their partner. If team members believed their partner was nearby, or possessed similar characteristics (e.g., both college students in the U.S.), this may have decreased inclinations to treat the partner in a more informal or disrespectful manner. Insight into how distance perception can alter a team and its effectiveness comes from research on the concept of immediacy. Immediacy, specifically referring to verbal and nonverbal behaviors that reduce the physical and psychological distance between two or more communicators, has been evaluated most often in the education domain. Findings generally indicate a positive relationship between learning and immediacy; however nonverbal immediacy appears more influential than verbal immediacy. Witt (2001), for example, manipulated verbal and nonverbal immediacy in a sample of students to evaluate learning outcomes. His results supported that nonverbal immediacy of the instructor enhanced learning, but no apparent affect 155
for verbal immediacy. Similarly, students in traditional, FTF classes and distributed learning classes reported different levels of instructor nonverbal immediacy, but no significant differences on the instructor’s verbal immediacy (Freitas, Myers, & Avtgis, 1998). What is unclear is how immediacy affects team performance. One could argue the instructor-student dyad represents a type of team, however little research exists on immediacy and performance in military or VE-based teams. In the present context, nonverbal immediacy levels may have been different between distributed teams in Singer et al. (2001) and those in the current study, however without a quantitative comparison, predictions as to how this difference affected team performance are tenuous at best. Accordingly, one line of future research in distributed team settings is the experimental manipulation of nonverbal immediacy. An example approach is to vary nonverbal immediacy via different communication channels, for example comparing audio-only and audio-visual (e.g., video teleconference) conditions, and then measure immediacy with extant tools such as the Nonverbal Immediacy Behaviors Instrument employed by Freitas et al. (1998). To a lesser extent, the cultural makeup of teams in the two studies may have influenced performance. Some distributed teams in the previous experiment were multicultural with American students working with French-speaking Canadian students. Even though differences between these cultures are relatively small in comparison to other possible combinations (e.g., American-Japanese teams or American-Russian teams), research in cross-cultural psychology suggests multicultural teams face unique challenges over homogenous teams. Culture influences how people view their world (Altarriba & Forsythe, 1993; Ayabe-Kanamura et al., 1998; Massaro & Ellison, 1996) and organize information (Carroll, 1993). Differences related to culture have also been associated with communication and group interactions (Oetzel, 1998), as 156
well as team decision-making performance (Dubrovsky, Kolla, & Sethna, 1989). For instance, Kaplan, Morgan, and Kring (2000) argue that culturally diverse teams possess certain advantages over culturally similar teams in certain types of decision making because the team is able to identify problems and generate solutions more effectively by drawing on the cultural differences between team members. This relationship was demonstrated in a study of culture and groups making decisions when collaborating via computer-based group decision support system (Daily, Whatley, Ash, & Steiner, 1996). Multicultural groups produced more non-redundant and realistic ideas than single-culture groups. In contrast, multicultural teams face other obstacles to effective decision making due to problems of group interaction and communication (Li, 1999; Orasanu et al., 1997) and often opposing views on leadership and management styles (Kelly & Kanas, 1992). Because a main goal of the AAR session was for teams to decide how to improve on future missions, larger cultural differences in Singer et al. may partly explain why distributed team performance was poorer than distributed teams in the current experiment. Unfortunately, the lack of dependent measures on cultural attitudes and beliefs from both studies makes this prediction difficult to support. Beyond perceptions of social presence and culture, other factors in the experimental environment may help explain the less robust local-distributed differences in the present study. Consider that demand characteristics, or features of the experimental environment that can influence participants to respond in a particular manner, have been linked to research participants’ efforts to seek what they perceive to be the “real” reason for the experiment and then behave accordingly (Smith & Davis, 2003). Although quantifiable data on this behavior was not collected presently, experimenter efforts to convince participants their partner was located
157
elsewhere may have actually worked in the opposite manner by overly emphasizing the distributed nature of the experimental condition. Another concern is that although every effort was made to ensure participants in all conditions had no prior contact or preexisting relationships, participants were primarily undergraduate psychology students at from the same university and it is therefore possible that some participants had extant relationships; a factor much less likely for distributed teams in Singer et al. Clearly, teams comprised of members sharing some common bonds, even at shallow levels, have advantages over two people meeting for the first time. In conjunction with possible influences from social presence, culture, and the experimental setting, a plausible explanation for the smaller local-distributed difference in the present study is simulator sickness experienced by distributed participants. In the mission-bymission analysis, distributed teams cleared fewer mean rooms than local teams during the third and fourth missions; the same missions distributed teams exhibited significantly higher simulator sickness symptoms. Although Pearson correlations indicated these two factors were statistically unrelated, it is an intriguing coincidence and may explain a portion of the variance on the good rooms dependent measure. In addition, even though Singer et al. (2001) collected SSQ data, they did not report a relationship between simulator sickness and performance for distributed teams, and therefore parallels between the two studies are not possible. Considering the present findings, it may have been prudent to retain the same number of VE missions as in Singer et al. (2001). In that study, teams completed eight missions over the course of 2 days, whereas current teams performed five missions on a single day. The fivemission design was chosen primarily because in the prior study the local team superiority was evident on the second mission and consistent for missions three through eight. Predicting a 158
similar pattern for the current study, five missions were deemed satisfactory to detect differences. Furthermore, the addition of a second independent variable (TCT) doubled the number of participants needed to achieve eight teams per condition. Using a 2-day, 8 mission design for 32 teams would have severely lengthened data collection and was deemed limiting. In hindsight, a greater number of missions might have exposed more significant differences between local and distributed teams.
Team Factors The second main goal of this study was to evaluate three team factors with empiricallysupported connections to team performance. The local team advantage in Singer et al. (2001) was believed to stem from differences in the development and maintenance of communicationdependent team factors related to the similarity of a team’s mental models, the team’s cohesion, and trust between team members. First, SMMs, which contribute to effective team performance (Stout et al., 1999), were expected to be less similar for distributed teams. The absence of FTF communication during the AARs was presumed to degrade team discussions and planning capabilities, and subsequently reduce the formation of SMMs related to the purpose, procedures, personnel responsibilities for the VE missions, and perceptions of interpersonal interactions. Recall that research on the benefit of communication to SMM development (Bolstad & Endsley, 1999; Orasanu, 1990; Orasanu & Fischer, 1992; Orasanu & Salas; 1993 Stout et al. 1999) suggests that for the AAR process to be effective, there needs to be sufficient communication between team members for the team to discuss and then gain SMMs regarding the purpose, procedures, and personnel responsibilities for the task, and perceptions of other team members. Based on the premise that distributed team 159
communication is inhibited by the lack of FTF contact and nonverbal cues, distributed teams should exhibit less similar mental models. Results, however, only minimally supported this assertion as the only significant local-distributed difference was on the similarity between Team Leader’s perceptions of his or her strengths during the AAR and the Equipment Specialist’s perceptions of the Team Leader’s strengths. This finding may represent the true state of affairs for teams operating in a DIVE setting in that communication modality does not significantly influence the degree to which the team develops common perceptions of the mission tasks and each other. The absence of location differences on nine of the 10 SMM measures suggests distributed teams were able to develop mental models comparable to their local counterparts. Furthermore, all teams achieved the highest levels of agreement for SMMs related to more concrete concepts such as procedures for opening the door and searching rooms and team role responsibilities; concepts that were addressed in the VE training and reviewed during the AARs via mission activity scripts available to each team member. Agreement on these features of the missions therefore may have depended less on team communication than originally anticipated. In short, FTF communication may figure minimally into the development of these types of SMMs. An alternative explanation is the SMMQ simply did not capture SMM differences that did exist between local and distributed teams. The questionnaire was based on the card-sorting or Q-sort technique to evaluate how participants rate the importance of certain goals, the correct sequence of specific tasks, impressions of team member responsibilities, and awareness of how the team interacts and each team member’s strengths. This approach was selected over more comprehensive and time-consuming techniques, like concept mapping and relatedness ratings, primarily due to the repeated-measures design and because these techniques provide a more 160
general picture of the relationships between concepts. Nevertheless, a more in-depth measure may have been warranted. Future research is needed to validate the current SMMQ for use with distributed VE teams and determine if this measure possesses concurrent validity with other approaches to SMM measurement such as concept mapping or pairwise-relatedness ratings. Second, levels of task cohesion, or how committed team members are to a shared task, and interpersonal cohesion, the degree to which individuals have positive relationships and are attracted to each other, were anticipated to be lower for distributed teams because they lacked a communication-rich environment in which to develop these factors. Findings from Zacarro et al. (1995), Zander and Havelin (1960), and Weisband and Atwater (1999) suggest communication plays an integral role in the formation of task and interpersonal cohesion. The present results did not support this premise as no differences were detected between conditions. Part of this may be explained by the nature of questionnaire. The GEQ-VE was modified from the Group Environment Questionnaire which was initially developed for use with sports teams. The twoperson VE teams in the present study only met once for 4 hr, far less interaction than is typical for teams in organized sports who may meet three to four times a week for a period of months. Accordingly, future research should investigate the availability of measures designed specifically for short-duration teams, or modify existing measures developed for military teams (e.g., Siebold & Kelly’s [1988] Combat Platoon Cohesion Questionnaire) to capture cohesion in the short term. Such a measure would allow researchers to test a more likely explanation for the current results which is cohesion requires more than several hours to develop in two-person teams. In other words, it is likely cohesion simply did not increase enough during the experiment to be detected by the GEQ-VE. In previous examinations of cohesion in military teams, for example, measurements occurred after longer periods of time, from 1 week in Bartone, Johnson, Eid, 161
Brun, and Laberg’s (2002) study of cohesion in Norwegian Navy officer cadets, to over five months in Tziner and Vardi’s (1983) evaluation of tank crews. The third team factor was trust, or attitudes team members possess about the emotional closeness they have with their partner (emotional trust) and perceptions of a partner’s competence and reliability (cognitive trust). Although both kinds of trust appear negatively affected by the absence of FTF communication (Muehlfelder, Klein, Simon, & Luczak, 1999), emotional trust is more closely tied to FTF communication. Accordingly, cognitive trust was not expected to vary between local and distributed teams, but emotional trust was predicted to be significantly lower in the distributed condition. Results in fact supported the opposite relationship as local teams reported higher levels of cognitive trust than distributed teams, but not significantly different degrees of emotional trust. As with cohesion, it is arguable emotional trust requires more time to develop than afforded teams in the current study. Findings by Rocco et al. (2000; 2001) support this contention in that evolution of an affective bond appears to gradually develop through a series of what they termed “opportunistic conversations,” whereas cognitive trust is more easily formed when members of a team display competency for the collective task. Nevertheless, because cognitive trust was the primary difference between local and distributed teams, as well as communication trained and non-trained teams, the relationship between this team factor and team performance in a DIVE setting deserves continued attention. The higher level of cognitive trust for local teams implies this factor contributed to some extent to improved levels of performance. However, additional research that manipulates cognitive trust as an independent variable is needed before implying a cause-and-effect relationship.
162
Furthermore, as with the SMMQ, the TTQ should be validated in a controlled comparison of teams or groups with established degrees of emotional and cognitive trust. In addition to local-distributed differences for the team factors, and based on the assumption that improved communication would positively affect each of these team factors, TCT was expected to make up for communication limitations faced by distributed teams, therefore leading to relatively equal degrees of SMMs, cohesion, and trust similar to those of untrained local teams. However, the only significant findings were related to one portion of the SMM factor and levels of cognitive trust. Additional discussion on the TCT intervention is presented next.
Team Communication Training The third main goal of the current study was to assess benefits of brief TCT on team factor development and mission performance. Overall, TCT did not produce an observable benefit to team performance or levels of team’s SMMs and cohesion. With regard to mission performance, TCT teams were no different than no-TCT teams and actually had lower mean scores, albeit not significantly, than no-TCT teams on many performance measures. There was a small positive effect for teams on their SMM similarity regarding the purpose of the VE missions and the strengths of the Team Leader during the AAR discussions early in the missions. On the second SSMQ administration, however, agreement for TCT teams dropped to levels not significantly different from no-TCT teams. Likewise, TCT produced no significant effect on task and interpersonal. The main effect of communication training was significant for levels of cognitive trust, but not emotional trust, for both TTQ administrations. Teams exposed to training about how to 163
communicate more effectively during the VE missions and AAR process tended to report higher degrees of cognitive trust, although this finding does not indicate causality or the interaction with other team factors. Consequently, the value of TCT as administered in the present study was mixed. This may partially be due to the short time in which participants could practice and potentially master the concepts. Therefore, although purposefully limited to 1 hr, the brevity of the TCT procedure may have considerably reduced any potential benefits. In addition, the electronic circuit-building task used to practice the four TCT dimensions might have been so obscure and/or difficult that participants were focusing all cognitive attention on the task and not learning the TCT dimension characteristics. This leads to another plausible explanation for the minimal benefits of TCT in that exposure to additional information during the general VE training increased the cognitive load of participants during the mission phase such that participants not only were focusing attention on how to perform the mission tasks, such as door opening and gas canister disarming, but were also devoting attention to applying the TCT skills in the missions. A great deal of human performance research supports that when an individual is required to devote his or her attention between two or more tasks, performance typically declines on one of the tasks (Sanders & McCormick, 1993). Referred to as divided attention, several theories argue (e.g., Wickens, 1984) humans have a finite reservoir of attention available for multiple tasks. When the demand of two tasks exceeds an individual’s attentional resources, he or she may experience difficulty completing both tasks effectively. In summary, TCT failed to impart significant benefits to teams in local and distributed conditions. As noted previously, TCT was based on extant literature and techniques, drawing 164
heavily on the Team Dimensional Training (TDT) paradigm. Although such an approach was tenable given the absence of other communication training approaches that focus specifically on distributed teams, it is likely the current TCT approach was either to general to be of any value, or did not adequately target the critical differences between FTF and non-FTF communication that would have led to observable differences. For example, TCT may have been more effective by providing suggestions as to how team members can compensate for the absence of nonverbal cues or offering ways to detect emotional changes by focusing on paralinguistic cues such as the partner’s tone of voice. As such, further research is needed to identify specific elements of communication that are unique to teams in distributed settings and then develop a TCT program focused on these differences. Only then can a sound empirical conclusion on the benefits of communication training for distributed teams be realized.
Conclusions The present study adds support to the theory that distributed teams operating in a common virtual setting experience performance deficits when compared to their physically colocated counterparts. Although results were less clear than in previous VE research on distributed teams, the findings suggest future U.S. Army efforts to train soldiers in geographically-distant locations should take steps to enhance communication avenues between team members. The presently employed TCT approach did not prove beneficial; however research on more comprehensive techniques is warranted. Ultimately, this study’s most significant contribution is identifying a new set of empirical questions regarding virtual team performance. In addition to a deeper examination of cognitive trust, future research should address how features of the distributed team experience affect 165
perceptions of the physical and psychological distance, or social presence, between team members. It is also critical to understand how broadening the communication channel for distributed teams, such as the inclusion of video images or access to biographical information about one’s distant teammate, facilitates performance in a variety of virtual team contexts. Another line of research is warranted to more clearly define what makes distributed communication different from local communication, and whether communication training based on these differences can ultimately improve distributed team performance. In addition, this research can be expanded to improve team performance in domains outside the virtual environment. As humankind grows ever more connected by technology, answers to these and other questions are vital to supporting virtual teams on the battlefield, in the classroom, and one day, in the cosmos.
166
APPENDIX A: BIOGRAPHICAL QUESTIONNAIRE
167
6.3 Biographical Questionnaire ID ____________ Please fill in the blank or circle the appropriate response. 1. What is your age?
_____ years
2. What is your gender?
female
male
3. What is your ethnic background? ___ American Indian or Alaskan Native
___ Hispanic
___ Asian or Pacific Islander
___ White, not Hispanic
___ Black, not Hispanic
___ Other
4. Are you currently in your usual state of fitness? 5. How many hours of sleep did you get last night? 5a. Was it sufficient? yes no
yes
no
_____ hours
6. Indicate all medications/substances you have used in the past 24 hours: CIRCLE ALL THAT APPLY 0 1 2 3 4 5
-
none sedatives or tranquilizers aspirin, Tylenol, other analgesics anti-histamines decongestants other (please list: _______________________________________________)
7. Have you ever experienced motion or car sickness? 8. How susceptible are you to motion or car sickness? 0 1 2 3 4 5 6 not very average susceptible mildly 9. Do you have a good sense of direction?
yes
1 low
2
3 4 average
5 high 168
no
7 very highly
no
10. How many hours per week do you use computers? 11. My level of confidence in using computers is
yes
_____ hours per week
12. I enjoy playing video games (home or arcade). 1 2 disagree
3 unsure
4
5 agree
13. I am _____ at playing video games. 1 bad
2
3 4 average
5 good
14. How many hours per week do you play video games?
_____ hours per week
15. How many times in the last year have you experienced a virtual reality game or entertainment? 0
1
2
3
4
5
6
7
8
9
10
16. Do you have a history of epilepsy or seizures?
11 yes
12+ no
17. Do you have normal or corrected to normal 20/20 vision? yes 18. Are you color blind?
yes
no
169
no
APPENDIX B: SHARED MENTAL MODEL QUESTIONNAIRE (SMMQ)
170
6.3 SMMQ V3 A. Purpose: 1. Rank the following goals of your team’s mission according to importance, from 1 = most important to 8 = least important: ____ Checking the state of all gas canisters ____ Neutralizing all OpFors ____ Not shooting any neutral bystanders ____ Checking all rooms ____ Disarming all armed gas canisters ____ Exiting the building before time is up ____ Checking the hallways for OpFors ____ Checking amount of air left in suit
B. Procedures: 1. For the Room Search task, place the following 8 procedures in the proper order, from 1 for the first task to 8 for the last task: ____ ES (Equipment Specialist) moves into room and covers the right side ____ TL identifies gas canisters ____ ES identifies neutral bystanders ____ TL identifies OpFors ____ TL (Team Leader) moves into room and covers the left side ____ ES identifies OpFors ____ TL identifies neutral bystanders ____ ES identifies gas canisters
2. For the Door Entry task, place the following 11 procedures in the proper order, from 1 for the first task to 11 for the last task: ____ TL asks “ready to enter?” ____ TL moves to the right side of the doorway ____ ES announces “in position” ____ TL moves into room ____ ES switches to the hand grenade ____ ES moves to the left side of the doorway ____ TL announces “in position” ____ ES moves into room
171
____ ES announces “ready” ____ TL opens door ____ ES launches grenade into room 3. For the Canister Disarming task, place the following 11 procedures in the proper order, from 1 for the first task to 11 for the last task: ____ TL moves to the canister ____ ES announces “prepare to disarm” ____ ES announces state of canister ____ ES reports new status of canister ____ TL switches to the canister disarming tool ____ ES calls out the disarming code ____ TL announces “ready” ____ ES obtains the disarming code ____ ES switches to the canister detector tool ____ TL acknowledges disarming code ____ TL sends disarming code
C. Personnel: 1. Who is most responsible for checking the rooms for OpFors? ____ TL ____ ES ____ Both 2. Who is most responsible for checking the hallways for OpFors? ____ TL ____ ES ____ Both 3. Who is most responsible for neutralizing OpFors? ____ TL ____ ES ____ Both 4. Who is most responsible for checking the state of gas canisters? ____ TL
172
____ ES ____ Both 5. Who is most responsible for capping gas canisters? ____ TL ____ ES ____ Both 6. Who is most responsible for disarming gas canisters? ____ TL ____ ES ____ Both 7. Who is most responsible for communicating with Sierra (offsite controller)? ____ TL ____ ES ____ Both 8. Who is most responsible for checking the status of the team’s air supply? ____ TL ____ ES ____ Both 9. Overall, who has ultimate authority over the team’s actions? ____ TL ____ ES ____ Both
D. Interpersonal: 1. Who communicates more important or relevant information during the missions? ____ Me ____ My teammate 2. Who communicates more unimportant or non-relevant information during the missions? ____ Me ____ My teammate
173
3. Who leads the discussion more often during the AAR? ____ Me ____ My teammate 4. In the context of the VE missions, rank the following items in order of your strengths, from 1 indicating your greatest strength to 5 your greatest weakness: ____ Remembering the correct order of procedures for tasks ____ Covering one’s teammate during the mission ____ Communicating important information during the missions ____ Completing tasks quickly ____ Completing tasks accurately 5. In the context of the VE missions, rank the following items in order of your teammate’s strengths, from 1 indicating his or her greatest strength to 5 his or her greatest weakness: ____ Remembering the correct order of procedures for tasks ____ Covering one’s teammate during the mission ____ Communicating important information during the missions ____ Completing tasks quickly ____ Completing tasks accurately 6. In the context of the AAR sessions, rank the following items in order of your strengths, from 1 indicating your greatest strength to 5 your greatest weakness: ____ Identifying what happened in the previous mission ____ Identifying why certain events happened during the previous mission ____ Developing solutions to improve performance for future missions ____ Determining who was more responsible for poor performance or errors ____ Helping one’s teammate learn from their mistakes 7. In the context of the AAR sessions, rank the following items in order of your teammate’s strengths, from 1 indicating his or her greatest strength to 5 his or her greatest weakness: ____ Identifying what happened in the previous mission ____ Identifying why certain events happened during the previous mission ____ Developing solutions to improve performance for future missions ____ Determining who was more responsible for poor performance or errors ____ Helping one’s teammate learn from their mistakes
174
APPENDIX C: GROUP ENVIRONMENT QUESTIONNAIRE-VIRTUAL ENVIRONMENT (GEQ-VE)
175
The GEQ-VE was adapted from the Group Environment Questionnaire (GEQ: © 1985 by Albert V. Carron, Lawrence, R. Brawley, & W. Neil Widmeyer). The original GEQ was designed to assess the cohesiveness of a group based on the perceptions of individual members. Two versions of the GEQ were developed, a sport team version and an exercise class version. The GEQ is composed of 18 items in four subscales: Group Integration-Task (GI-T) 5 items Group Integration-Social (GI-S) 5 items Interpersonal Attractions to the GroupTask (ATG-T) 4 items Interpersonal Attractions to the GroupSocial (ATG-S) 5 items
Individual team member's feelings about the similarity, closeness, and bonding within the team as a whole around the group's task. Individual team member's feelings about the similarity, closeness, and bonding within the team as a whole around the group as a social unit. Individual team member's feelings about his or her personal involvement with the group task, productivity, and goals and objectives Individual team member's feelings about his or her personal acceptance and social interaction with the group
Note. Above adapted from Carron, A. V., Brawley, L. R., & Widmeyer, W. N. (1985). The Group Environment Questionnaire. London, Ontario: Author. Participants are required to respond to the 18 statements about their team on a 9-point Likert-type scale which is anchored at the two extremes by “strongly agree” and “strongly disagree.” The score on each specific subscale is computed by summing the scores from relevant items described below. Items are both positively and negatively worded, Thus, after reversing the score for negatively worded items, a higher total score for each subscale indicates greater perceptions of cohesion. The scoring is as follows:
176
1. For Group Integration-Task, items 10, 12, and 16 are scored from strongly disagree = 1 to strongly agree = 9. Items 14 and 18 are scored from strongly disagree = 9 to strongly agree = 1. 2. For Group Integration-Social, item 15 is scored from strongly disagree = 1 to strongly agree = 9. Items 11, 13 and 17 are scored from strongly disagree = 9 to strongly agree = 1. 3. For Individual Attractions to the Group-Task, items 2, 4, 6, and 8 are scored from strongly disagree = 9 to strongly agree = 1. 4. For Individual Attractions to the Group-Social, items 5 and 9 are scored from strongly disagree = 1 to strongly agree = 9. Items 1, 3, and 7 are scored from strongly disagree = 9 to strongly agree = 1. Because the original GEQ was developed for use with sports teams or exercise classes, certain items were revised in the current GEQ-VE to better reflect the two-person VE team setting. The first statement for each of the 18 items below is the original GEQ item, the second statement is the revised item used in the GEQ-VE: 1. I do not enjoy being a part of the social activities of this team. I do not enjoy talking with my teammate during non-mission periods. 2. I am not happy with the amount of playing time I get. I am not happy with the amount of performance time I get. 3. I am not going to miss the members of this team when the season ends. I am not going to miss my team member when this experiment ends. 4. I am unhappy with my team’s level of desire to win. I am unhappy with my teammate’s desire to perform well. 5. Some of my best friends are on this team. I could become good friends with my teammate. 6. This team does not give me enough opportunities to improve my personal performance. 177
Same 7. I enjoy other parties more than team parties. I would enjoy hanging out with my teammate more than other people I know. 8. I do not like the style of play on this team. I do not like the style of performance on this team. 9. For me, this team is one of the most important social groups to which I belong. For me, this team is one of the most important teams to which I belong. 10. Our team is united in trying to reach its goals for performance. Same 11. Members of our team would rather go out on their own than get together as a team. Members of our team would rather spend time alone during non-mission periods than talk with each other. 12. We all take responsibility for any loss or poor performance by our team. We all take responsibility for any error or poor performance by our team. 13. Our team members rarely party together. Our team members rarely talk during non-mission periods. 14. Our team members have conflicting aspirations for the team’s performance. Same 15. Our team would like to spend time together in the off season. Our team would like to spend time together after the experiment is over. 16. If members of our team have problems in practice, everyone wants to help them so we can get back together again. If members of our team have problems during the missions, we want to help each other so that we can do better.
178
17. Members of our team do not stick together outside of practices and games. Members of our team do talk together outside of after action reviews or missions. 18. Members of our team do not communicate freely about each athlete’s responsibilities during competition or practice. Members of our team do not communicate freely about each teammate’s responsibilities during missions or the after action review. The final version of the GEQ-VE is presented on the next page including instructions to participants.
179
6.3 GEQ-VE This questionnaire is designed to assess your perceptions of your virtual environment team. There are no right or wrong answers so please give your immediate reaction. Some of the questions may seem repetitive but please answer ALL questions. Your candid responses are very important to us. Your responses will be kept in strict confidence. Neither your teammate nor anyone other than the researcher will see your responses. The following questions are designed to assess your feelings about YOUR PERSONAL INVOLVEMENT with this team. Please CIRCLE a number from 1 to 9 to indicate your level of agreement with each of the statements. 1. I do not enjoy talking with my teammate during non-mission periods. 1 Strongly Disagree
2
3
4
5
6
7
8
9 Strongly Agree
6
7
8
9 Strongly Agree
6
7
8
9 Strongly Agree
5
6
7
8
9 Strongly Agree
5
6
7
8
9 Strongly Agree
8
9 Strongly Agree
2. I am not happy with the amount of performance time I get. 1 Strongly Disagree
2
3
4
5
3. I am not going to miss my team member when this experiment ends. 1 Strongly Disagree
2
3
4
5
4. I am unhappy with my teammate’s desire to perform well. 1 Strongly Disagree
2
3
4
5. I could become good friends with my teammate. 1 Strongly Disagree
2
3
4
6. This team does not give me enough opportunities to improve my personal performance. 1 Strongly Disagree
2
3
4
5
6
7
7. I would enjoy hanging out with my teammate more than other people I know. 1 Strongly Disagree
2
3
4
5
6
7
8
9 Strongly Agree
5
6
7
8
9
8. I do not like the style of performance on this team. 1
2
3
4
180
Strongly Disagree
Strongly Agree
9. For me, this team is one of the most important teams to which I belong. 1 Strongly Disagree
2
3
4
5
6
7
8
9 Strongly Agree
The following questions are designed to assess your perceptions of YOUR TEAM AS A WHOLE. Please CIRCLE a number from 1 to 9 that best indicates your level of agreement with each of the statements. 10. Our team is united in trying to reach its goals for performance. 1 Strongly Disagree
2
3
4
5
6
7
8
9 Strongly Agree
11. Members of our team would rather spend time alone during non-mission periods than talk with each other. 1 Strongly Disagree
2
3
4
5
6
7
8
9 Strongly Agree
6
7
8
9 Strongly Agree
6
7
8
9 Strongly Agree
7
8
9 Strongly Agree
7
8
9 Strongly Agree
12. We all take responsibility for any error or poor performance by our team. 1 Strongly Disagree
2
3
4
5
13. Our team members rarely talk during non-mission periods. 1 Strongly Disagree
2
3
4
5
14. Our team members have conflicting aspirations for the team’s performance. 1 Strongly Disagree
2
3
4
5
6
15. Our team would like to spend time together after the experiment is over. 1 Strongly Disagree
2
3
4
5
6
16. If members of our team have problems during the missions, we want to help each other so that we can do better. 1 Strongly Disagree
2
3
4
5
6
7
17. Members of our team do talk together outside of after action reviews or missions.
181
8
9 Strongly Agree
1 Strongly Disagree
2
3
4
5
6
7
8
9 Strongly Agree
18. Members of our team do not communicate freely about each teammate’s responsibilities during missions or the after action review. 1 Strongly Disagree
2
3
4
5
6
182
7
8
9 Strongly Agree
APPENDIX D: TEAM TRUST QUESTIONNAIRE (TTQ)
183
6.3 TTQ V2 This questionnaire is designed to assess perceptions of your virtual environment team. There are no right or wrong answers so please give your honest reaction. Some of the questions may seem repetitive but please answer ALL questions. Your candid responses are very important to us. Your responses will be kept in strict confidence. Neither your teammate nor anyone other than the researcher will see your responses. Please CIRCLE a number from 1 to 9 to indicate your level of agreement with each of the statements. 1. I feel comfortable sharing ideas and feelings about our performance with my teammate. 1 Strongly Disagree
2
3
4
5
6
7
8
9 Strongly Agree
2. I would offer to help my teammate with any mission performance-related need without being asked to do so. 1 Strongly Disagree
2
3
4
5
6
7
8
9 Strongly Agree
8
9 Strongly Agree
3. If I do not closely monitor my teammate’s progress, our tasks will not be completed. 1 Strongly Disagree
2
3
4
5
6
7
4. I can rely on my teammate to fulfill his or her commitments (e.g., complete tasks, remember procedures). 1 Strongly Disagree
2
3
4
5
6
7
8
9 Strongly Agree
5. After the experiment, I would offer to help my teammate with any personal need without being asked to do so. 1 Strongly Disagree
2
3
4
5
6
7
8
9 Strongly Agree
6. I believe my teammate is comfortable sharing ideas and feelings about our performance with me. 1 Strongly Disagree
2
3
4
5
6
7
8
9 Strongly Agree
7. I believe my teammate would offer to help me with any mission performance-related need without being asked to do so.
184
1 Strongly Disagree
2
3
4
5
6
7
8
9 Strongly Agree
8. If my teammate does not closely monitor my own progress, our tasks will not be completed. 1 Strongly Disagree
2
3
4
5
6
7
8
9 Strongly Agree
9. My teammate can rely on me to fulfill my commitments (e.g., complete tasks, remember procedures). 1 Strongly Disagree
2
3
4
5
6
7
8
9 Strongly Agree
10. After the experiment, I believe my teammate would offer to help me with any personal need without being asked to do so. 1 Strongly Disagree
2
3
4
5
6
185
7
8
9 Strongly Agree
APPENDIX E: SIMULATOR SICKNESS QUESTIONNAIRE (SSQ)
186
Note, adapted from Kennedy, Lane, Berbaum, & Lilienthal (1993) ID
Date
Instructions: 1. 2. 3. 4. 5. 6. 7. 8. 9. 10. 11. 12. 13. 14. 15. 16.
Please indicate how you feel right now in the following areas, by circling the word that applies.
General Discomfort Fatigue Headache Eye Strain Difficulty Focusing Increased Salivation Sweating Nausea Difficulty Concentrating Fullness of Head Blurred vision Dizzy (Eyes Open) Dizzy (Eyes Closed) Vertigo* Stomach Awareness** Burping
None None None None None None None None None None None None None None None None
Slight Slight Slight Slight Slight Slight Slight Slight Slight Slight Slight Slight Slight Slight Slight Slight
*
Moderate Moderate Moderate Moderate Moderate Moderate Moderate Moderate Moderate Moderate Moderate Moderate Moderate Moderate Moderate Moderate
Severe Severe Severe Severe Severe Severe Severe Severe Severe Severe Severe Severe Severe Severe Severe Severe
Vertigo is a disordered state in which the person or his/her surroundings seem to whirl dizzily: giddiness Stomach awareness is usually used to indicate a feeling of discomfort which is just short of nausea.
**
187
APPENDIX F: END QUESTIONNAIRE
188
End Questions Below are several questions about the experiment design and your distributed partner. Please answer all questions truthfully. Please CIRCLE the appropriate response for each of the statements. 1. The audio of my partner’s voice during the missions was clear and at the right volume. 1 Strongly Disagree
2
3
4
5
6
7
8
9 Strongly Agree
2. The audio of my partner’s voice during the after action reviews was clear and at the right volume. 1 Strongly Disagree
2
3
4
5
6
7
8
9 Strongly Agree
3. Your partner is at a different location. In miles, how far away do you think your partner is? 0-1 Miles
1-10
10-20
20-30
30-40
40-50
50-60
60-70
70+
4. I would have performed better if my partner were in the same room. 1 Strongly Disagree
2
3
4
5
6
7
8
9 Strongly Agree
5
6
7
8
9 Strongly Agree
7
8
9 Strongly Agree
5. I would have liked to meet my partner. 1 Strongly Disagree
2
3
4
6. The visual images in the helmets were clear and in focus. 1 Strongly Disagree
2
3
4
5
6
7. The visual images in the helmets moved smoothly with few jumps or lags in the image. 1 Strongly Disagree
2
3
4
5
6
189
7
8
9 Strongly Agree
APPENDIX G: PRESENCE QUESTIONNAIRE
190
PRESENCE QUESTIONNAIRE (Witmer & Singer, Vs. 3.0, Nov. 1994) Characterize your experience in the environment, by marking an "X" in the appropriate box of the 7-point scale, in accordance with the question content and descriptive labels. Please consider the entire scale when making your responses, as the intermediate levels may apply. Answer the questions independently in the order that they appear. Do not skip questions or return to a previous question to change your answer. WITH REGARD TO THE EXPERIENCED ENVIRONMENT 1. How much were you able to control events? |________|________|________|________|________|________|________| NOT AT ALL SOMEWHAT COMPLETELY 2. How responsive was the environment to actions that you initiated (or performed)? |________|________|________|________|________|________|________| NOT MODERATELY COMPLETELY RESPONSIVE RESPONSIVE RESPONSIVE 3. How natural did your interactions with the environment seem? |________|________|________|________|________|________|________| EXTREMELY BORDERLINE COMPLETELY ARTIFICIAL NATURAL 4. How much did the visual aspects of the environment involve you? |________|________|________|________|________|________|________| NOT AT ALL SOMEWHAT COMPLETELY 5. How much did the auditory aspects of the environment involve you? |________|________|________|________|________|________|________| NOT AT ALL SOMEWHAT COMPLETELY 6. How natural was the mechanism which controlled movement through the environment?
191
|________|________|________|________|________|________|________| EXTREMELY BORDERLINE COMPLETELY ARTIFICIAL NATURAL 7. How compelling was your sense of objects moving through space? |________|________|________|________|________|________|________| NOT AT ALL MODERATELY VERY COMPELLING COMPELLING 8. How much did your experiences in the virtual environment seem consistent with your real world experiences? |________|________|________|________|________|________|________| NOT MODERATELY VERY CONSISTENT CONSISTENT CONSISTENT 9. Were you able to anticipate what would happen next in response to the actions that you performed? |________|________|________|________|________|________|________| NOT AT ALL SOMEWHAT COMPLETELY 10. How completely were you able to actively survey or search the environment using vision? |________|________|________|________|________|________|________| NOT AT ALL SOMEWHAT COMPLETELY 11. How well could you identify sounds? |________|________|________|________|________|________|________| NOT AT ALL SOMEWHAT COMPLETELY 12. How well could you localize sounds? |________|________|________|________|________|________|________| NOT AT ALL SOMEWHAT COMPLETELY 13. How well could you actively survey or search the virtual environment using touch? |________|________|________|________|________|________|________| NOT AT ALL SOMEWHAT COMPLETELY 14. How compelling was your sense of moving around inside the virtual environment? 192
|________|________|________|________|________|________|________| NOT MODERATELY VERY COMPELLING COMPELLING COMPELLING 15. How closely were you able to examine objects? |________|________|________|________|________|________|________| NOT AT ALL PRETTY VERY CLOSELY CLOSELY 16. How well could you examine objects from multiple viewpoints? |________|________|________|________|________|________|________| NOT AT ALL SOMEWHAT EXTENSIVELY 17. How well could you move or manipulate objects in the virtual environment? |________|________|________|________|________|________|________| NOT AT ALL SOMEWHAT EXTENSIVELY 18. How involved were you in the virtual environment experience? |________|________|________|________|________|________|________| NOT MILDLY COMPLETELY INVOLVED INVOLVED ENGROSSED 19. How much delay did you experience between your actions and expected outcomes? |________|________|________|________|________|________|________| NO DELAYS MODERATE LONG DELAYS DELAYS 20. How quickly did you adjust to the virtual environment experience? |________|________|________|________|________|________|________| NOT AT ALL SLOWLY LESS THAN ONE MINUTE 21. How proficient in moving and interacting with the virtual environment did you feel at the end of the experience? |________|________|________|________|________|________|________| NOT REASONABLY VERY 193
PROFICIENT
PROFICIENT
PROFICIENT
22. How much did the visual display quality interfere or distract you from performing assigned tasks or required activities? |________|________|________|________|________|________|________| NOT AT ALL INTERFERED PREVENTED SOMEWHAT TASK PERFORMANCE 23. How much did the control devices interfere with the performance of assigned tasks or with other activities? |________|________|________|________|________|________|________| NOT AT ALL INTERFERED INTERFERED SOMEWHAT GREATLY 24. How well could you concentrate on the assigned tasks or required activities rather than on the mechanisms used to perform those tasks or activities? |________|________|________|________|________|________|________| NOT AT ALL SOMEWHAT COMPLETELY 25. How completely were your senses engaged in this experience? |________|________|________|________|________|________|________| NOT MILDLY COMPLETELY ENGAGED ENGAGED ENGAGED 26. To what extent did events occurring outside the virtual environment distract from your experience in the virtual environment? |________|________|________|________|________|________|________| NOT AT ALL MODERATELY VERY MUCH 27. Overall, how much did you focus on using the display and control devices instead of the virtual experience and experimental tasks? |________|________|________|________|________|________|________| NOT AT ALL SOMEWHAT VERY MUCH 28. Were you involved in the experimental task to the extent that you lost track of time? |________|________|________|________|________|________|________| 194
NOT AT ALL
SOMEWHAT
COMPLETELY
29. How easy was it to identify objects through physical interaction; like touching an object, walking over a surface, or bumping into a wall or object? |________|________|________|________|________|________|________| IMPOSSIBLE MODERATELY VERY EASY DIFFICULT 30. Were there moments during the virtual environment experience when you felt completely focused on the task or environment? |________|________|________|________|________|________|________| NONE OCCASIONALLY FREQUENTLY 31. How easily did you adjust to the control devices used to interact with the virtual environment? |________|________|________|________|________|________|________| DIFFICULT MODERATE EASILY 32. Was the information provided through different senses in the virtual environment (e.g., vision, hearing, touch) consistent? |________|________|________|________|________|________|________| NOT SOMEWHAT VERY CONSISTENT CONSISTENT CONSISTENT
195
APPENDIX H: IMMERSIVE TENDENCIES QUESTIONNAIRE (ITQ)
196
IMMERSIVE TENDENCIES QUESTIONNAIRE (Witmer & Singer, Version 3.01, September 1996) Indicate your preferred answer by marking an "X" in the appropriate box of the seven point scale. Please consider the entire scale when making your responses, as the intermediate levels may apply. For example, if your response is once or twice, the second box from the left should be marked. If your response is many times but not extremely often, then the sixth (or second box from the right) should be marked. 1. Do you easily become deeply involved in movies or TV dramas? |________|________|________|________|________|________|________| NEVER OCCASIONALLY OFTEN 2. Do you ever become so involved in a television program or book that people have problems getting your attention? |________|________|________|________|________|________|________| NEVER OCCASIONALLY OFTEN 3. How mentally alert do you feel at the present time? |________|________|________|________|________|________|________| NOT ALERT MODERATELY FULLY ALERT 4. Do you ever become so involved in a movie that you are not aware of things happening around you? |________|________|________|________|________|________|________| NEVER OCCASIONALLY OFTEN 5. How frequently do you find yourself closely identifying with the characters in a story line? |________|________|________|________|________|________|________| NEVER OCCASIONALLY OFTEN 6. Do you ever become so involved in a video game that it is as if you are inside the game rather than moving a joystick and watching the screen? |________|________|________|________|________|________|________| NEVER OCCASIONALLY OFTEN 7. What kind of books do you read most frequently? (CIRCLE ONE ITEM ONLY!) Spy novels
Fantasies
Science fiction 197
Adventure novels
Romance novels
Historical novels
Westerns
Mysteries
Other fiction
Biographies
Autobiographies
Other non-fiction
8. How physically fit do you feel today? |________|________|________|________|________|________|________| NOT FIT MODERATELY EXTREMELY FIT FIT 9. How good are you at blocking out external distractions when you are involved in something? |________|________|________|________|________|________|________| NOT VERY SOMEWHAT VERY GOOD GOOD GOOD 10. When watching sports, do you ever become so involved in the game that you react as if you were one of the players? |________|________|________|________|________|________|________| NEVER OCCASIONALLY OFTEN 11. Do you ever become so involved in a daydream that you are not aware of things happening around you? |________|________|________|________|________|________|________| NEVER OCCASIONALLY OFTEN 12. Do you ever have dreams that are so real that you feel disoriented when you awake? |________|________|________|________|________|________|________| NEVER OCCASIONALLY OFTEN 13. When playing sports, do you become so involved in the game that you lose track of time? |________|________|________|________|________|________|________| NEVER OCCASIONALLY OFTEN 14. How well do you concentrate on enjoyable activities? 198
|________|________|________|________|________|________|________| NOT AT ALL MODERATELY VERY WELL WELL 15. How often do you play arcade or video games? (OFTEN should be taken to mean every day or every two days, on average.) |________|________|________|________|________|________|________| NEVER OCCASIONALLY OFTEN 16. Have you ever gotten excited during a chase or fight scene on TV or in the movies? |________|________|________|________|________|________|________| NEVER OCCASIONALLY OFTEN 17. Have you ever gotten scared by something happening on a TV show or in a movie? |________|________|________|________|________|________|________| NEVER OCCASIONALLY OFTEN 18. Have you ever remained apprehensive or fearful long after watching a scary movie? |________|________|________|________|________|________|________| NEVER OCCASIONALLY OFTEN 19. Do you ever become so involved in doing something that you lose all track of time? |________|________|________|________|________|________|________| NEVER OCCASIONALLY OFTEN 20. On average, how many books do you read for enjoyment in a month? |________|________|________|________|________|________|________| NONE ONE TWO THREE FOUR FIVE MORE 21. Do you ever get involved in projects or tasks, to the exclusion of other activities? |________|________|________|________|________|________|________| NEVER OCCASIONALLY OFTEN 22. How easily can you switch attention from the activity in which you are currently involved to a new and completely different activity?
199
|________|________|________|________|________|________|________| NOT SO FAIRLY QUITE EASILY EASILY EASILY 23. How often do you try new restaurants or new foods when presented with the opportunity? |________|________|________|________|________|________|________| NEVER OCCASIONALLY FREQUENTLY 24. How frequently do you volunteer to serve on committees, planning groups, or other civic or social groups? |________|________|________|________|________|________|________| NEVER SOMETIMES FREQUENTLY 25. How often do you try new things or seek out new experiences? |________|________|________|________|________|________|________| NEVER OCCASIONALLY OFTEN 26. Given the opportunity, would you travel to a country with a different culture and a different language? |________|________|________|________|________|________|________| NEVER MAYBE ABSOLUTELY 27. Do you go on carnival rides or participate in other leisure activities (horse back riding, bungee jumping, snow skiing, water sports) for the excitement of thrills that they provide? |________|________|________|________|________|________|________| NEVER OCCASIONALLY OFTEN 28. How well do you concentrate on disagreeable tasks? |________|________|________|________|________|________|________| NOT AT ALL MODERATELY VERY WELL WELL 29. How often do you play games on computers? |________|________|________|________|________|________|________| NOT AT ALL OCCASIONALLY FREQUENTLY
200
30. How many different video, computer, or arcade games have you become reasonably good at playing? |________|________|________|________|________|________|________| NONE ONE TWO THREE FOUR FIVE SIX OR MORE 31. Have you ever felt completely caught up in an experience, aware of everything going on and completely open to all of it? |________|________|________|________|________|________|________| NEVER OCCASIONALLY FREQUENTLY 32. Have you ever felt completely focused on something, so wrapped up in that one activity that nothing could distract you? |________|________|________|________|________|________|________| NOT AT ALL OCCASIONALLY FREQUENTLY 33. How frequently do you get emotionally involved (angry, sad, or happy) in news stories that you see, read, or hear? |________|________|________|________|________|________|________| NEVER OCCASIONALLY OFTEN 34. Are you easily distracted when involved in an activity or working on a task? |________|________|________|________|________|________|________| NEVER OCCASIONALLY OFTEN
201
APPENDIX I: MISSION AWARENESS RATING SCALE (MARS)
202
Participant #: ______________
Date ______________
Position (check one) ____ Team Leader
_____ Equipment Specialist
Treatment Condition: ___ L
___ D
___ L-TCT
___ D-TCT
Mission Awareness Rating Scale (MARS) Instructions. Please answer the following questions about the exercise you just completed. Your answers to these questions are important in helping us evaluate the effectiveness of this training exercise. Check the response that best applies to your experience. The first four questions deal with your ability to detect and understand important cues present during the exercise. 1. Please rate your ability to identify mission-critical cues in this exercise. ___ ___ ___ ___
very easy – able to identify all cues fairly easy – could identify most cues somewhat difficult – many cues hard to identify very difficult – had substantial problems identifying most cues
2. How well did you understand what was going on during the exercise? ___ ___ ___ ___
very well – fully understood the situation as it unfolded fairly well - understood most aspects of the situation somewhat poorly – had difficulty understanding much of the situation very poorly – the situation did not make sense to me
3. How well could you predict what was about to occur next in the exercise? ___ ___ ___ ___
very well – could predict with accuracy what was about to occur fairly well – could make accurate predictions most of the time somewhat poor – misunderstood the situation much of the time very poor – unable to predict what was about to occur
4. How aware were you of how to best achieve your goals during this exercise? ___ ___ ___ ___
very aware – knew how to achieve goals at all times fairly aware – knew most of the time how to achieve mission goals somewhat unaware – was not aware of how to achieve some goals very unaware – generally unaware of how to achieve goals
203
The last four questions ask how difficult it was for you to detect and understand important cues present during the exercise.
5. How difficult – in terms of mental effort required - was it for you to identify or detect mission-critical cues in the exercise? ___ ___ ___ ___
very easy – could identify relevant cues with little effort fairly easy – could identify relevant cues, but some effort required somewhat difficult - some effort was required to identify most cues very difficult – substantial effort required to identify relevant cues
6. How difficult – in terms of mental effort – was it to understand what was going on during the exercise? ___ ___ ___ ___
very easy – understood what was going on with little effort fairly easy – understood events with only moderate effort somewhat difficult – hard to comprehend some aspects of situation very difficult – hard to understand most or all aspects of situation
7. How difficult – in terms of mental effort – was it to predict what was about to happen during the exercise? ___ ___ ___ ___
very easy – little or no effort needed fairly easy – moderate effort required somewhat difficult – many projections required substantial effort very difficult – substantial effort required on most or all projections
8. How difficult – in terms of mental effort – was it to decide on how to best achieve mission goals during this exercise? ___ ___ ___ ___
very easy – little or no effort needed fairly easy – moderate effort required somewhat difficult – substantial effort needed on some decisions very difficult – most or all decisions required substantial effort
204
APPENDIX J: TEAM COMMUNICATION TRAINING SCRIPTS
205
6.3 TEAM COMMUNICATION TRAINING Pre-Brief: (Read to participant) For the next hour, you will learn how to communicate effectively when you are part of a team. Communication between team members is the most important part of performing complex tasks like the VE missions you will complete soon. Without effective communication, it is hard to coordinate actions or finish tasks quickly and accurately. Now that you have an idea of the types of tasks you and a teammate will perform in the VE missions, you are going to learn how to communicate with your teammate. Shortly, you will cover four different aspects or elements of communication that together are crucial to team performance. These are called Process, Information Exchange, Feedback, and Shared Models. For each element, you will first read a short description of the element. Next, you and I will practice the main points of the element by performing a simple task together. During this time, I will record how well you did and ways you could improve your communication performance. We will then discuss your performance and focus on what problems you had, if any, why you had problems, and then how to fix the problems. Do you have any questions at this point? If not, let’s begin with the first element of team communication called Process.
206
#1 Process: This first element of team communication focuses on the Process of communication, in other words how people communicate. When two people need to communicate in order to perform a complex task, at least four issues are important. First, they must speak clearly. This means talking at an adequate level of volume so that the other person does not have to strain to hear any words. Speaking clearly also requires clarity of speech such that each word is pronounced properly. Second, each person must speak concisely. In other words, to complete tasks more efficiently, each person should use the fewest possible number of words to adequately get the point across. This includes avoiding excess chatter or talking about things not directly related to the team’s task. Third, each person must speak accurately. That is, each person should use clear and unambiguous terms or terms and avoid slang to reduce miscommunication or confusion. Fourth, each person must use proper vocabulary for the team task. This requires that team members use the correct phrases and terms as laid out in the communication protocol for the task. To summarize, the four main parts of the Process element of communication are to speak Correctly, Concisely, Clearly, and with Proper Vocabulary.
207
#2 Information Exchange: The second team communication element is Information Exchange and concerns what people communicate. When communication is necessary to perform a complex team task, three issues are important. First, each person must gather all relevant information from the environment that relates to the team’s task. This requires constant attention to events or details that affect the task and that each team member should be aware of to perform at their best. Second, each person must spontaneously provide necessary information to his or her teammate. In other words, a team member should determine what information their partner needs and communicate that information immediately and without having to be asked. This reduces communication lags that in turn delay task performance. Third, each person must provide regular updates to their teammate. Offering regular assessments of the task situation and progress, such as elapsed time or the achievement of certain mission goals, allows both team members to develop an overall team awareness of the task. To summarize, the three main parts of the Information Exchange communication element are to gather all information, spontaneously provide necessary information, and provide regular updates.
208
#3 Feedback: The third team communication element is Feedback and concerns providing advice or judgments to a teammate. As two people work together on a complex task, it is important that each person rely on the other for impressions or comments about how each is doing. Put simply, each team member should look out for the other and tell them how they are doing; good or bad. There are two main parts to successful feedback between two persons. First, a person must ask relevant questions to their teammate. This might include asking how he or she is doing, if he/she has made any errors, and ways to improve performance. Second, when asked questions, a person must provide appropriate answers. This means offering responses that help the other teammate learn how he or she is doing and comments about errors and ways to improve performance. To summarize, the two main parts of the Feedback element of communication are asking relevant questions and providing appropriate answers.
209
#4 Shared Models: The fourth team communication element is Shared Models and refers to the similarity of team members’ perceptions of the task and the team’s performance. Team members must develop a common model or idea of how the team is doing in order to coordinate behaviors and perform effectively. In other words, each person needs to be on the “same page” as far as what the task requires, how to perform the task, and how well the team is performing the task. Developing shared models relies on communication between team members. This requires that each person express his or her thoughts and ideas about the task to their teammate. In addition, each person should ask their teammate for his or her thoughts and ideas about the task if specific information is not conveyed. This ensures that both teammates are operating from the same set of ideas with regard to the task. To summarize, the development of shared models of the task requires team members to express thoughts, ideas, and ask for his or her teammate’s thoughts and ideas regarding the task.
210
APPENDIX K: TCT CIRCUIT TASK DESCRIPTIONS
211
Project #1 Parts: • • • • • • • •
One 555 Integrated Circuit (IC) Resistor 1 (R1): 4.7k (Yellow-Violet-Red) Resistor 2 (R2): 10k (Brown-Black-Orange) Resistor 3 (R3): 1k (Brown-Black-Red) Electrolytic Capacitor (C1): 10 µf LED 1: Red LED 3 White wires 1 Red wire
Build: 1. Push the power switch to OFF 2. Insert the 555 IC across slot 3 (Pin 1 at F15) (ask how to find pin 1) 3. Connect I14 to F17 (White wire) 4. Connect G14 to H17 (White wire) 5. Connect F20 to V4 (+6v) (White wire) 6. Connect F13 to Ground (Red wire) 7. Insert R1 across G19 and V4 (+6v) 8. Insert R2 across G20 and H20 9. Insert R3 across D15 and V4 (+6v) 10. Insert LED 1 across D13 (Anode) and H13 (Cathode: wire below flat spot on rim of LED base) 11. Insert C1 across G11 (+) and F11 (-) Test: 1. Check the circuit for errors. 2. When you are sure all wires and components are installed correctly, push the power switch up (ON). 3. The LED should begin flashing several times per second.
212
Project #2: Parts: • • •
Resistor 1 (R1): 10k (Black-Brown-Orange) 1 Blue wire 1 Yellow wire
Build: 1. 2. 3. 4.
Push the power switch to OFF Insert R1 across springs 64 and 2 Connect spring 1 to ground (Blue wire) Connect a Yellow wire to spring 64
Test: 1. Push the power switch up (ON) 2. Imagine that the numbers on the meter’s scale have no decimal points, and that they indicate 0 to 10 volts. 3. Connect the free end of the Yellow “Probe” wire to +1.5v. 4. Record volts in table below 5. Repeat steps 3-5 for +3v, +4.5v, +6v, +7.5v, and +9v 6. Volt Location 1.5v
Voltmeter Reading
3v 4.5v 6v 7.5v 9v
213
Project # 3: Part 1: Parts: • •
6 Blue wires 4 White wires
214
1. 2. 3. 4. 5. 6. 7. 8. 9.
Build: 1. 2. 3. 4. 5. 6. 7.
Push the power switch to OFF Connect springs 12 and 40 (Blue wire) Connect springs 14 and 42 (Blue wire) Connect springs 16 and 43 (Blue wire) Connect springs 18 and 45 (Blue wire) Connect springs 41 and 44 (White wire) Connect springs 41 to V2 (+3v) (Blue wire) 8. Connect springs 11 and 13 (White wire) 9. Connect springs 13 and 15 (White wire) 10. Connect springs 15 and 17 (White wire) 11. Connect springs 17 to Ground (Blue wire) Test: 1. 2. 3. 4. 5.
Push the power switch to ON Push the DPDT switch down Verify that LEDs 2 and 4 glow Push the DPDT switch up Verify that LEDs 1 and 3 glow
Part 2: Build: Modify the circuit above: 1. Remove the white wire across springs 41 and 44 2. Connect spring 44 to V3 (+4.5v) (Blue wire) 3. Connect springs 20 and 47 (Blue wire) 4. Connect springs 22 and 49 (Blue wire) 5. Connect spring 46 to V2 (+3v) (Blue wire) 6. Connect spring 48 to V3 (+4.5v) (Blue wire) 7. Connect springs 17 and 19 (White wire) 8. Connect springs 19 and 21 (White wire) Test:
215
Push the power switch to ON Push the DPDT switch down Verify that LEDs 2 and 4 glow Push the DPDT switch up Verify that LEDs 1 and 3 glow Press S1 Verify that LED 5 glows Press S2 Verify that LED 6 glows
216
Project #4 Parts: • • • • • • • • • •
One TLC272 Integrated Circuit (IC) One 386 Integrated Circuit (IC) Resistor 1 (R1): 10k (Brown-Black-Orange) Resistor 2 (R2): 100 ohms (Brown-Black-Brown) Capacitor 1 (C1): 0.001 µf Capacitor 2 (C2): 470 µf One microphone 5 Blue wires 6 White wires 3 Red wires
Build: 1. Push the power switch to OFF 2. Insert 272 IC over slot 3 (Pin 1 at J15) 3. Insert 386 IC over slot 5 (Pin 1 at J25) 4. Insert R1 across L14 and J18 5. Insert R2 across L12 and Ground 6. Insert C1 across J12 and K12 7. Insert C2 across M28 (+) and S28 (-) 8. Connect M11 to Ground (White wire) 9. Connect J20 to V6 (+9v) (White wire) 10. Connect M21 to Ground (White wire) 11. Connect K21 to Ground (White wire) 12. Connect L30 to V6 (+9v) (White wire) 13. Connect spring 68 to Ground (Blue wire) 14. Connect spring 69 to S30 (Blue wire) 15. Connect spring 31 to J11 (Red wire) 16. Connect spring 32 to K11 (Red wire) 17. Connect spring 39 to Ground (Red wire) 18. Connect spring 38 to L21 (Blue wire) 19. Connect spring 37 to J13 (Blue wire) 20. Connect spring 40 to K14 (White wire) 21. Connect spring 43 to Ground (White wire) 22. Connect one Microphone lead to spring 41 23. Connect second Microphone lead to spring 44
217
Before testing: 1. Write down what you think you just built:
_________________________________ Test: 1. Rotate the knobs of both the 10k (R4) and 1m (R3) console potentiometers all the way to the left. 2. Push the DPDT switch up to connect the earphone (Microphone) to the preamplifier. 3. Push the power switch to ON
218
APPENDIX L: TEAM COMMUNICATION TRAINING QUIZ
219
6.3 Team Communication Training Quiz Please circle the best answer for the following questions based on the team communication training materials you just reviewed. 1. What are the main parts of the Process element of communication? A. Gathering all relevant information from environment; spontaneously providing information to teammate; providing regular updates to teammate B. Speaking clearly; speaking concisely; speaking accurately; using proper vocabulary C. Asking teammate relevant questions; providing appropriate answers to teammate D. Expressing thoughts about task to teammate; asking teammate for his/her thoughts about task 2. What are the main parts of the Information Exchange element of communication? A. Gathering all relevant information from environment; spontaneously providing information to teammate; providing regular updates to teammate B. Speaking clearly; speaking concisely; speaking accurately; using proper vocabulary C. Asking teammate relevant questions; providing appropriate answers to teammate D. Expressing thoughts about task to teammate; asking teammate for his/her thoughts about task 3. What are the main parts of the Feedback element of communication? A. Expressing thoughts about task to teammate; asking teammate for his/her thoughts about task B. Gathering all relevant information from environment; spontaneously providing information to teammate; providing regular updates to teammate C. Speaking clearly; speaking concisely; speaking accurately; using proper vocabulary D. Asking teammate relevant questions; providing appropriate answers to teammate 4. What are the main parts of the Shared Models element of communication? A. Asking teammate relevant questions; providing appropriate answers to teammate B. Expressing thoughts about task to teammate; asking teammate for his/her thoughts about task C. Gathering all relevant information from environment; spontaneously providing information to teammate; providing regular updates to teammate D. Speaking clearly; speaking concisely; speaking accurately; using proper vocabulary 5. If you and your teammate use each of the four communication elements when communicating during the upcoming VE missions, what will happen to the speed of your team’s performance? A. We will complete tasks more quickly because of the improved transfer of information B. We will complete tasks more slowly because of the added communication C. Using the communication elements will not affect our speed of performance D. Hard to tell how using the communication elements will affect our speed of performance 6. If you and your teammate use each of the four communication elements when communicating during the upcoming VE missions, what will happen to the accuracy of your team’s performance? A. We will complete tasks more accurately because of the improved transfer of information
220
B. We will complete tasks less accurately because of increased confusion C. Using the communication elements will not affect our accuracy of performance D. Hard to tell how using the communication elements will affect our accuracy of performance
221
APPENDIX M: IRB HUMAN SUBJECTS PERMISSION LETTER
222
223
LIST OF REFERENCES Achille, L. B., Schulze, K. G., & Schmidt-Nielsen, A. (1995). An analysis of communication and the use of military terms in navy team training. Military Psychology, 7(2), 95-107. Albertson, L. A. (1977). Telecommunications as a travel substitute: Some psychological, organizational, and social aspects. Journal of Communication, 27(2), 32-43. American Psychological Association (2001). Publication manual of the American Psychological Association (5th ed.). Washington, DC: American Psychological Association. Andrews, D. H., Waag, W. L., & Bell, H. H. (1992). Training technologies applied to team training: Military examples. In R. W. Swezey & E. Salas (Eds.), Teams: Their training and performance (pp. 283-327). Norwood, NJ: Ablex. Altarriba, J., & Forsythe, W. J. (1993). The role of cultural schemata in reading comprehension. In J. Altarriba (Ed.), Cognition and culture: A cross-cultural approach to cognitive psychology (pp. 145-155). Amsterdam, The Netherlands: Elsevier. Ayabe-Kanamura, S., Schicker, I., Laska, M., Hudson, R., Distel, H., Kobayakawa, T., & Saito, S. (1998). Differences in perception of everyday odors: A Japanese-German crosscultural study. Chemical Senses, 23(1), 31-38. Bakeman, R., & Helmreich, R. (1975). Cohesiveness and performance: Covariation and causality in an undersea environment. Journal of Experimental Social Psychology, 11, 478-489. Bales, R. F., & Strodtbeck, F. L. (1951). Phases in group problem solving. Journal of Abnormal and Social Psychology, 46, 485-495. Bannon, L. J., & Schmidt, K. (1991). CSCW: Four characters in search of a context. In J. M. Bowers, & S. D. Benford (Eds.), Studies in computer supported cooperative work (pp. 316). Amsterdam: The Netherlands: North-Holland. Barkhi, R., Jacob, V. S., & Pirkul, H. (1999). An experimental analysis of face to face versus computer mediated communication channels. Group Decision & Negotiation, 8(4), 325347. Baron, R. A. (1981). Olfaction and human social behavior: Effects of a pleasant scent on attraction and social perception. Personality and Social Psychology Bulletin, 7(4), 611616. Baron, R. A., & Byrne, D. (1994). Social psychology: Understanding human interaction (7th ed.). Boston: Allyn & Bacon.
224
Bartone, P. T., Johnsen, B. J., Eid, J., Brun, W., & Laberg, J. C. (2002). Factors influencing small-unit cohesion in Norwegian Navy officer cadets. Military Psychology, 14(1), 1-22. Beach, L. R. (1997). The psychology of decision making: People in organizations. Thousand Oaks, CA: Sage. Biocca, F., & Delaney, B. (1995). Immersive virtual environment technology. In F. Biocca & M. R. Levy (Eds.), Communication in the age of virtual reality (pp. 57-124). Hillsdale, NJ: Lawrence Erlbaum. Bohm, J. K., & Hendricks, B. (1997). Effects of interpersonal touch, degree of justification, and sex of participant on compliance with a request. Journal of Social Psychology, 137, 460469. Bolstad, C. A., & Endsley, M. R. (1999). Shared mental models and shared displays: An empirical evaluation of team performance. In Proceedings of the Human Factors and Ergonomics Society 43rd Annual Meeting (pp. 213-217). Santa Monica, CA: Human Factors and Ergonomics Society. Boone, K. S., Beitel, P., & Kuhlman, J. S. (1997). The effects of the win/loss record on cohesion. Journal of Sport Behavior, 20(2), 125-134. Borgatti, S., Everett, M. G., & Freeman, L. C. (1992). UCINET IV network analysis software. Columbia, SC: Analytic Technologies. Bos, N. D., Gergle, D., Olson, J. S., & Olson, G. M. (2001). Being there versus seeing there: Trust via video. In Proceedings of CHI 2001, Short papers. New York: ACM Press. Bowers, C. A., Jentsch, F., Salas, E., & Braun, C. C. (1998). Analyzing communication sequences for team training needs assessment. Human Factors, 40, 672-679. Brawley, L. R., Carron, A. V., & Widmeyer, W. N. (1987). Assessing the cohesion of teams: Validity of the Group Environment Questionnaire. Journal of Sport Psychology, 9, 275294. Burgoon, J. K., Manusov, V., Mineo, P., & Hale, J. L. (1985). Effects of gaze on hiring, credibility, attraction and relational message interpretation. Journal of Nonverbal Behavior, 9(3), 133-146. Butler, J. K., & Cantrell, R. S. (1984). A behavioral decision theory approach to modeling dyadic trust in superiors and subordinates. Psychological Reports, 55, 19-28. Cannon-Bowers, J. A., & Salas, E. (1997). A framework for developing team performance measures in training. In M. T. Brannick, E. Salas, & C. Prince (Eds.), Team performance
225
assessment and measurement: Theory, methods, and applications (pp. 45-62). Mahwah, NJ: Lawrence Erlbaum. Cannon-Bowers, J. A., Salas, E., & Converse, S. A. (1993). Shared mental models in expert team decision making. In N. J. Castellan, Jr. (Ed.), Current issues in individual and group decision making (pp. 221-246). Hillsdale, NJ: Lawrence Erlbaum. Cannon-Bowers, J. A., Tannenbam, S. I., Salas, E., & Volpe, C. E. (1995). Defining competencies and establishing team training requirements. In R. Guzzo & E. Salas (Eds.), Team effectiveness and decision making in organizations (pp. 333-380). San Francisco: Jossey-Bass. Carey, J. M., & Kacmar, C. J. (1997). The impact of communcation mode and task complexity on small group performance and member satisfaction. Computers in Human Behavior, 13(1), 23-49. Carless, S. A., & De Paola, C. (2000). The measurement of cohesion in work teams. Small Group Research, 31(1), 71-88. Carletta, J., Anderson, A. H., & McEwan, R. (2000). The effects of multimedia communication technology on non-collocated teams: A case study. Ergonomics, 43(8), 1237-1251. Carrol, M. (1993). Deitic and intrinsic orientation in spatial descriptions: A comparison between English and German. In J. Altarriba (Ed.), Cognition and culture: A cross-cultural approach to cognitive psychology (pp. 23-44). Amsterdam, The Netherlands: Elsevier. Carron, A. V. (1982). Cohesiveness in group sports: Interpretations and considerations. Journal of Sport Psychology, 4, 123-138. Carron, A. V., & Ball, J. R. (1977). Cause-effect characteristics of cohesiveness and participation motivation in intercollegiate hockey. International Review of Sport Psychology, 12, 4960. Carron, A. V., & Brawley. L. R. (2000). Cohesion: Conceptual and measurement issues. Small Group Research, 31, 89-106. Carron, A. V., Brawley, L. R., & Widmeyer, W. N. (1985). The Group Environment Questionnaire. London, Ontario: Author (Copy of GEQ received via email from A. V. Carron, material copyrighted). Carron, A. V., Widmeyer, W. N., & Brawley, L. R. (1985). The development of an instrument to assess cohesion in sport teams: The Group Environment Questionnaire. Journal of Sport Psychology, 7, 244-266.
226
Cartwrigth, D. (1968). The nature of group cohesiveness. In D. Cartwright & A. Zander (Eds.), Group dynamics: Research and theory (3rd ed.). New York: Harper and Row. Chapanis, A (1975). Interactive human communication. Scientific American, 232(3), 36-42. Chapanis, A., Ochsman, R. B., Parrish, R. N., & Weeks, G. D. (1972). Studies in interactive communication: I. the effects of four communication modes on the behavior of teams during cooperative problem-solving. Human Factors, 14, 487-509. Chapanis, A., & Overbey, C. M. (1974). Studies in interactive communication: III. Effects of similar and dissimilar communication channels and two interchange options on team problem solving. Perceptual and Motor Skills, 38, 343-374. Ciolek, T. M. (1982). Zones of co-presence in face-to-face interaction: Some observational data. Man-Environment Systems, 12(6), 223-242. Cohen, J. (1960). A coefficient of agreement for nominal scales. Educational and Psychological Measurement, 20, 37-46. Cohen, J. (1992). A power primer. Psychological Bulletin, 112, 155-159. Cohen, M. M. (2000). Perception of facial features and face-to-face communications in space. Aviation, Space, and Environmental Medicine, 71(9, Section II), A51-A57. Collyer, S. C., & Malecki, G. S. (1998). Tactical decision making under stress: History and overview. In J. A. Cannon-Bowers & E. Salas (Eds.), Making decisions under stress: Implications for individual and team training (pp. 3-15). Washington, DC: American Psychological Association. Columbine Review Commission (2001, May). The report of Governor Bill Owens’ Columbine Review Commission. Denver, CO: Author. Retrieved January 19, 2003 from http://www.state.co.us/columbine/ Commarford, P. M., Kring, J. P., & Singer, M. J. (2001). Investigating communication as a possible mediator of team performance in distributed environments. In Proceedings of the Human Factors and Ergonomics Society 45th Annual Meeting (pp. 1939-1942). Santa Monica, CA: Human Factors and Ergonomics Society. Cooke, N. J. (1999). Knowledge elicitation. In F. T. Durso (Ed.), Handbook of applied cognition (pp. 479-509). Chichester, England: John Wiley & Sons. Copeland, B. W., & Straub, W. F. (1995). Assessment of team cohesion: A Russian approach. Perceptual and Motor Skills, 81(2), 443-450.
227
Crusco, A. H., & Wetzel, C. G. (1984). The Midas touch: The effects of interpersonal touch on restaurant tipping. Personality and Social Psychology Bulletin, 10, 512-517. Dennis, A. R., Valacich, J. S., & Nunamaker, J. F. (1990). An experimental investigation of the effects of group size in an electronic meeting environment. IEEE Transactions on Systems, Man, & Cybernetics, 20(5), 1049-1057. Dickinson, T. L., & McIntyre, R. M. (1997). A conceptual framework for teamwork measurement. In M. T. Brannick, E. Salas, & C. Prince (Eds.), Team performance assessment and measurement: Theory, methods, and applications (pp. 19-43). Mahwah, NJ: Lawrence Erlbaum. Dirks, K. T. (2000). Trust in leadership and team performance: Evidence from NCAA basketball. Journal of Applied Psychology, 85(6), 1004-1012. Doherty-Sneddon, G., O'Malley, C., Garrod, S., & Anderson, A, Langton, S., & Bruce, V. (1997). Face-to-face and video-mediated communication: A comparison of dialogue structure and task performance. Journal of Experimental Psychology: Applied, 3(2), 105125. Driskell, J. E., & Salas, E. (1992). Can you study real times in contrived settings? The value of small group research to understanding teams. In R. S. Swezey & E. Salas (Eds.), Teams: Their training and performance (pp. 101-124). Norwood, NJ: Ablex. Drolet, A. L., & Morris, M. W. (2000). Rapport in conflict resolution: Accounting for how faceto-face contact fosters mutual cooperation in mixed- motive conflicts. Journal of Experimental Social Psychology, 36(1), 26-50. Duarte, D. L., & Snyder, N. L. (1999). Mastering virtual teams: Strategies, tools, and techniques that succeed. San Francisco: Jossey-Bass. Dubrovsky, V. J., Kiesler, S., & Sethna, B. N. (1991). The equalization phenomenon: Status effects in computer-mediated and face-to-face decision-making groups. HumanComputer Interaction, 6(2), 119-146. Duncan, S. (1972). Some signals and rules for taking speaking turns in conversations. Journal of Personality and Social Psychology, 23(2), 283-292. Duncan, S., & Niederehe, G. (1974). On signaling that it's your turn to speak. Journal of Experimental Social Psychology, 10(3), 234-247. Dwyer, D. J., Fowlkes, J. E., Oser, R. L., Salas, E., & Lane, N. E. (1997). Team performance measurement in distributed environments: The TARGETs methodology. In M. T. Brannick, E. Salas, & C. Prince (Eds.), Team performance assessment and measurement: Theory, methods, and applications (pp. 137-153). Mahwah, NJ: Lawrence Erlbaum. 228
Endsley, M. R., & Jones, W. J. (2001). A model of inter- and intrateam situation awareness: Implications for design, training, and measurement. In M. McNeese, E. Salas, & M. Endsley (Eds.), New trends in cooperative activities: Understanding system dynamics in complex environments (pp. 46-67). Santa Monica, CA: Human Factors and Ergonomics Society. Evans, A. W., III, Jentsch, F., Hitt, J. M., II., Bowers, C., & Salas, E. (2001). Mental model assessments: Is there a convergence among different methods? Proceedings of the 45th Annual Meeting of the Human Factors and Ergonomics Society (pp. 293-296). Santa Monica, CA: Human Factors and Ergonomics Society. Evans, C., & Dion, K. (1991). Group cohesion and performance: A meta-analysis. Small Group Research, 22, 175-186. Farmer, S. M., & Hyatt, C. W. (1994). Effects of task language demands and task complexity on computer-mediated work groups. Small Group Research, 25(3), 331-366. Festinger, L. (1950). Informal social communication. Psychological Review, 57, 271-282. Fiore, S. M., Salas, E., & Bowers, C. A. (2001). Attitudes, behaviors, and cognition in distributed teams: The effect of team opacity on process and performance. Proceedings of the 45th Annual Meeting of the Human Factors and Ergonomics Society (pp. 382-386). Santa Monica, CA: Human Factors and Ergonomics Society. Fiore, S. M., Salas, E., & Cannon-Bowers, J. A. (2001). Group dynamics and shared mental model development. In M. London (Ed.), How people evaluate others in organizations: Person perception and interpersonal judgment in Industrial/Organizational psychology (pp. 309-336). Mahwah, NJ: Lawrence Erlbaum. Fisher, K., & Fisher, M. D. (1998). The distributed mind: Achieving high performance through the collective intelligence of knowledge work teams. New York: AMACOM. Fleishman, E. A., & Zaccaro, S. J. (1992). Toward a taxonomy of team performance functions. In R. S. Swezey & E. Salas (Eds.), Teams: Their training and performance (pp. 31-56). Norwood, NJ: Ablex. Fleiss, J. L. (1981). Statistical methods for rates and proportions (2nd ed.). New York: Wiley & Sons. Fober, G. W., Dyer, J. L., & Salter, M. S. (1994). Measurement of performance at the Joint Readiness Training Center: Tools of assessment. In R. F. Holz, J. H. Hiller, & H. H. McFann (Eds.), Determinants of effective unit performance: Research on measuring and managing unit training readiness (pp. 39-70). Alexandria, VA: US Army Research Institute for the Behavioral and Social Sciences. 229
Forsyth, D. R. (1999). Group dynamics (3rd ed.). Belmont, CA: Brooks/Cole. Foushee, H. C. (1982). The role of communications, sociopsychological, and personality factors in the maintenance of crew coordination. Aviation, Space, and Environmental Medicine, 53, 1062-1066. Freitas, F. A., Myers, S. A., & Avtgis, T. A. (1998). Student perceptions of instructor immediacy in conventional and distributed learning classrooms. Communication Education, 47(4), 366-372. Fromme, D. K., Jaynes, W. E., Taylor, D. K., & Hanold, E. G. (1989). Nonverbal behavior and attitudes toward touch. Journal of Nonverbal Behavior, 13(1), 3-14. Gaddy, C. D., & Wachtel, J. A. (1992). Team skills training in nuclear power plant operations. In R. W. Swezey & E. Salas (Eds.), Teams: Their training and performance (pp. 379-396). Norwood, NJ: Ablex. Goodman, P. S., & Leyden, D. P. (1991). Familiarity and group productivity. Journal of Applied Psychology, 76, 578-586. Graham, J. A., & Argyle, M. (1975). A cross-cultural study of the communication of extra-verbal meaning by gestures. International Journal of Psychology, 10, 57-67. Green, S. B., & Salkind, N. J. (2003). Using SPSS for Windows and Macintosh: Analyzing and understanding data (3rd ed.). Upper Saddle River, NJ: Prentice Hall. Greenburg, J., & Baron, R. A. (1995). Behavior in organizations: Understanding and managing the human side of work. Englewood Cliffs, NJ: Prentice Hall. Gully, S. M., Devine, D. J., & Whitney, D. J. (1995). A meta-analysis of cohesion and performance: Effects of levels of analysis and task interdependence. Small Group Research, 26(4), 497-520. Hackman, J. R. (1992). Group influences on individuals in organizations. In M. Dunnette & L. M. Hough (Eds.), Handbook of industrial and organizational psychology (2nd ed., Vol. 3., pp. 199-267). Palo Alto, CA: Consulting Psychologists Press. Hammond, J., Harvey, C. M., & Koubek, R. J. (2000). Effect of communication medium on virtual design team’s workload. In Proceedings of the IEA 2000/HFES 2000 Congress (pp. 1-77—1-80). Santa Monica, CA: Human Factors and Ergonomics Society. Harkins, S. G., Latane, B., & Williams, K. (1980). Social loafing: Allocating effort or taking it easy? Journal of Experimental Social Psychology, 16(5), 457-465.
230
Harmon, J. (1998). Electronic meetings and intense group conflict: Effects of a policy-modeling performance support system and an audio communication support system on satisfaction and agreement. Group Decision and Negotiation, 7, 131-155. Hays, W. H. (1994). Statistics (5th ed.). Belmont, CA: Wadsworth. Haywood, M. (1998). Managing virtual teams: Practical techniques for high-technology project managers. Boston: Artech House. Heath, C., & Luff, P. (1991). Disembodied conduct: Communication through video in a multimedia office environment. In S. P. Robertson, G. M. Olson, and J. S. Olson (Eds.), Human factors in computing systems: Reaching through technology (CHI ’91 Conference Proceedings) (pp. 99-103). New Orleans, LA: Association for Computing Machinery’s Special Interest Group on Computer-Human Interaction (ACM SIGCHI). Hedlund, J., Ilgen, D. R., & Hollenbeck, J. R. (1998). Decision accuracy in computer-mediated versus face-to-face decision-making teams. Organizational Behavior and Human Decision Processes, 76(1), 30-47. Heinen, J. S., & Jacobson, E. (1976). A model of task group development in complex organizations and a strategy of implementation. Academy of Management Review, 1, 98111. Horn, D. B. (2001). Is seeing believing? Detecting deception in technologically mediated communication (PDF file). In Proceedings of CHI 2001, Short papers. New York: ACM Press. Hornik, J. (1991). Shopping time and purchasing behavior as a result of in-store tactile stimulation. Perceptual and Motor Skills, 73(3, Pt 1), 969-970. Howell, D. C. (1997). Statistical methods for psychology (4th ed.). Belmont, CA: Wadsworth. Janis, I. L. (1972). Victims of Group-Think. Boston: Houghton Mifflin. Jarvenpaa, S. L., & Leidner, D. E. (1999). Communication and trust in global virtual teams. Organization Science, 10(6), 791-815. Jentsch, F., Borjesson, W. I., Harper, M. E., Evans, A. W., III, Hitt, J. M., II, & Bowers, C. (2001). Psychometrics of Knowledge Structure Elicitation Methods. (Unpublished manuscript). Jones, G. R., & George, J. M. (1998). The experience and evolution of trust: Implications for cooperation and teamwork. Academy of Management Review, 23(3), 531-546.
231
Kanas, N., & Caldwell, B. (2000). Summary of research issues in personal, interpersonal, and group dynamics. Aviation, Space, and Environmental Medicine, 71(9, Sect 2), A26-A28. Kanfer, R. (1990). Motivation theory and industrial and organizational psychology. In M. Dunnette & L. M. Hough (Eds.), Handbook of industrial and organizational psychology (2nd ed., Vol. 1, pp. 75-170). Palo Alto, CA: Consulting Psychologists Press. Kanki, M. A., & Foushee, H. C. (1989). Communication as group performance mediator of aircrew performance. Aviation, Space, and Environmental Medicine, 60, 402-410. Kanki, M. A., Lozito, S., & Foushee, H. C. (1989). Communication indexes of crew coordination. Aviation, Space, and Environmental Medicine, 60(1), 56-60. Kaplan, M., Morgan, B. B., & Kring, J. P. (2000). Cultural ergonomics. In W. Karwowski (Ed.), International Encyclopedia of Ergonomics and Human Factors (pp. 31-34). London: Taylor & Francis. Kennedy, R. S., Lane, N. E., Berbaum, K. S., & Lilienthal, M. G. (1993). A simulator sickness questionnaire (SSQ): A new method for quantifying simulator sickness. International Journal of Aviation Psychology, 3(3), 203-220. Klein, G. (2001). Features of team coordination. In M. McNeese, E. Salas, & M. Endsley (Eds.), New trends in cooperative activities: Understanding system dynamics in complex environments (pp. 68-95). Santa Monica, CA: Human Factors and Ergonomics Society. Kleinke, C. L. (1980). Interaction between gaze and legitimacy of request on compliance in a field setting. Journal of Nonverbal Behavior, 5(1), 3-12. Kleinke, C. L. (1986). Gaze and eye contact: A research review. Psychological Bulletin, 100, 78100. Knerr, B. W., Lampton, D. R., Singer, M. J., Witmer, B. G., Goldberg, S. L., Parsons, K. J., & Parsons, J. (1998). Virtual environments for dismounted solider training and performance: Results, recommendations, and issues (ARI Tech Report No. 1089). Orlando, FL: US Army Research Institute for the Behavioral and Social Sciences: Simulator Systems Research Unit. Knouse, S. B., Smith, A., & Smith, P. (1998). Keeping "on task": An exploration of task cohesion in diverse military teams (DEOMI Research Series Pamphlet 98-1, ADA 359547). Patrick Air Force Base, FL: Defense Equal Opportunity Management Institute. Kotrlik, J. W., & Williams, H. A. (2003). The incorporation of effect size in information technology, learning, and performance research [Electronic version]. Information Technology, Learning, and Performance Journal, 21(1), 1-7.
232
Kraiger, K., & Wenzel, L. H. (1997). Conceptual development and empirical evaluation of measures of shared mental models as indicators of team effectiveness. In M. T. Brannick, E. Salas, & C. Prince (Eds.), Team performance assessment and measurement: Theory, methods, and applications (pp. 63-84). Mahwah, NJ: Lawrence Erlbaum. Krauss, R., M., Garlock, C., M., Bricker, P., D., & McMahon, L. E. (1977). The role of audible and visible back-channel responses in interpersonal communication. Journal of Personality and Social Psychology, 35(7), 523-529. Krauss, R. M., Morrel-Samuels, P., & Colasante, C. (1991). Do conversational hand gestures communicate? Journal of Personality and Social Psychology, 61, 743-754. Kring, J. P. (2001). Multicultural factors for international spaceflight. Journal of Human Performance in Extreme Environments, 5(2), 11-32. Kring, J. P., Commarford, P. M., & Singer, M. J. (2001). Personality and team performance in distributed virtual environments. In Proceedings of the Human Factors and Ergonomics Society 45th Annual Meeting (pp. 1943-1947). Santa Monica, CA: Human Factors and Ergonomics Society. Krueger, G. P., & Chapanis, A. (1980). Conferencing and teleconferencing in three communication modes as a function of the number of conferees. Ergonomics, 23(2), 103122. LaFrance, M., & Mayo, C. (1978). Cultural aspects of nonverbal communication. International Journal of Intercultural Relations, 2(1), 71-89. Landis, J., & Koch, G. G. (1977). The measurement of observer agreement for categorical data. Biometrics, 33, 159-174. Lampton, D. R., Kolasinski, E. M., Knerr, B. W., Bliss, J. P., Bailey, J. H., & Witmer, B. G., (1994). Side effects and aftereffects of immersion in virtual environments. In Proceedings of the Human Factors Society 38th Annual Meeting (pp. 1154-1157). Santa Monica, CA: Human Factors and Ergonomics Society. Lampton, D. R., & Parsons, J. B (2001). The Fully Immersive Team Training (FITT) research system: Design and implementation. Presence, 10(2), 129-141. Langfred, C. W. (1998). Is group cohesiveness a double-edged sword? An investigation of the effects of cohesiveness on performance. Small Group Research, 29, 124-143. Latane, B., & Darley, J. M. (1968). Group inhibition of bystander intervention in emergencies. Journal of Personality & Social Psychology, 10(3), 215-221.
233
Latane, B., Williams, K., & Harkins, S. (1979). Many hands make light the work: The causes and consequences of social loafing. Journal of Personality and Social Psychology, 37(6), 822-832. Levine, J. M., & McBurney, D. H. (1977). Causes and consequences of effluvia: Body odor awareness and controllability as determinants of interpersonal evaluation. Personality & Social Psychology Bulletin, 3(3), 442-445. Levine, T. R., & Hullett, C. R. (2002). Eta squared, partial eta squared, and misreporting of effect size in communication research. Human Communication Research, 28, 612-625. Li, H. Z. (1999). Communication information in conversations: A cross-cultural comparison. International Journal of Intercultural Relations, 23(3), 387-409. Lin, D-Y. M., & Su, Y-L. (1998). The effect of time pressure on expert system based training for emergency management. Behaviour and Information Technology, 17(4), 195-202. Marcus, P. M. (1962). Group cohesion and worker productivity: A dissenting view. Personnel Administration, 25(3), 44-48. Massaro, D. W., & Ellison, J. W. (1996). Perceptual recognition of facial affect: Cross-cultural comparisons. Memory and Cognition, 24(6), 812-822. Mathieu, J. E., Heffner, T. S., Goodwin, G. F., Salas, E., & Cannon-Bowers, J. A. (2000). The influence of shared mental models on team process and performance. Journal of Applied Psychology, 85, 273-283. McAllister, D. J. (1995). Affect- and cognition-based trust as foundations for interpersonal cooperation in organizations. Academy of Management Journal, 38, 24-59. McCauley, M. E., & Sharkey, T. J., (1992, Summer). Cybersickness: Perception of self-motion in virtual environments. Presence, 1(3), 311-318. McDaniel, E., & Andersen, P. A. (1998). International patterns of interpersonal tactile communication: A field study. Journal of Nonverbal Behavior, 22(1), 59-75. Meliza, L. L., Bessemer, D. W., & Hiller, J. H. (1994). Providing unit training feedback in the distributed interactive simulation environment. In R. F. Holz, J. H. Hiller, & H. H. McFann (Eds.), Determinants of effective unit performance: Research on measuring and managing unit training readiness (pp. 257-280). Alexandria, VA: US Army Research Institute for the Behavioral and Social Sciences. Mehrabian, A. (1972). Nonverbal communication. Chicago: Aldine-Atherton.
234
Mehrabian, A., & Wiener, M. (1967). Decoding of inconsistent communications. Journal of Personality and Social Psychology, 6, 109-114. Michaelsen, L. K., Watson, W. E., & Black, R. H. (1989). A realistic test of individual versus group consensus decision making. Journal of Applied Psychology, 74, 834-839. Miesing, P., & Preble, J. (1985). Group processes and performance in a complex business simulation. Small Group Behavior, 16, 325-338. Milgram, S. (1963). Behavioral study of obedience. Journal of Abnormal and Social Psychology, 67(4), 371-378. Milgram, S. (1965). Some conditions of obedience and disobedience to authority. Human Relations, 18(1), 57-76. Miller, D., Price, J. M., Entin, E., Rubineau, B., & Elliot, L. (2001). Does planning using groupware foster coordinated team performance? In Proceedings of the Human Factors and Ergonomics Society 45th Annual Meeting (pp. 390-394). Santa Monica, CA: Human Factors and Ergonomics Society. Minionis, D. P., Zaccaro, S. J., & Perez, R. (1995). Shared mental models, team coordination, and team performance. Paper presented at the 10th Annual Conference of the Society for Industrial/Organizational Psychology, Orlando, FL. Moorman, C., Deshpande, R., & Zaltman, G. (1993). Factors affecting trust in market research relationships. Journal of Marketing, 57, 81-101. Morgan, B. B., Jr., & Lassiter, D. L. (1992). Team composition and staffing. In R. S. Swezey & E. Salas (Eds.), Teams: Their training and performance (pp. 75-100). Norwood, NJ: Ablex. Morgan, B. B., Glickman, A. S., Woodward, E. A., Blaiwes, A. S., & Salas, E. (1986). Measurement of team behaviors in a Navy environment (Tech. Report TR-86-014). Orlando, FL: Naval Training Systems Center, Human Factors Division. Morgan, B. B. Jr., Salas, E., & Glickman, A. S. (1993). An analysis of team evolution and maturation. Journal of General Psychology, 120, 277-291. Morley, I. E., & Stephenson, G. M. (1969). Interpersonal and interparty exchange: A laboratory simulation of an industrial negotiation at the plant level. British Journal of Psychology, 60, 543-545. Morley, I. E., & Stephenson, G. M. (1970). Formality in experimental negotiations: A validation study. British Journal of Psychology, 6, 383-384.
235
Morrison, J. E., & Meliza, L. L. (1999). Foundations of the after action review process (ARI Special Report No. 42). Alexandria, VA: US Army Research Institute for Behavioral and Social Sciences. Mudrack, P. E. (1989). Group cohesiveness and productivity: A closer look. Human Relations, 9, 771-785. Muehlfelder, M. Klein, U. Simon, S. & Luczak, H. (1999). Teams without trust? Investigations in the influence of video-mediated communication on the origin of trust among cooperating persons. Behaviour and Information Technology, 18(5), 349-360. Mullen, B., & Copper, C. (1994). The relation between group cohesiveness and performance: An integration. Psychological Bulletin, 115, 210.227. Narayanan, V. K., & Nath, R. (1984). The influence of group cohesiveness on some changes induced by flexitime: A quasi-experiment. Journal of Applied Behavioral Science, 20, 37-49. Neuman, G. A., & Wright, J. (1999). Team effectiveness: Beyond skills and cognitive ability. Journal of Applied Psychology, 84, 376-389. Oetzel, J. G. (1998). Culturally homogeneous and heterogeneous groups: Explaining communication processes through individualism-collectivism and self-construal. International Journal of Intercultural Relations, 22(2), 135-161. Olson, J. S., Card, S. K., Landauer, T. K., & Olson, G. M. (1993). Computer-supported cooperative work: Research issues for the 90s. Behaviour and Information Technology, 12(2), 115-129. O'Malley, C., Langton, S., Anderson, A., & Doherty-Sneddon, G. (1996). Comparison of faceto-face and video-mediated interaction. Interacting with Computers, 8(2), 177-192. Orasanu, J. M. (1990). Shared mental models and crew decision making (CSL Report 46). Princeton, NJ: Cognitive Science Laboratory, Princeton University. Orasanu, J. M., & Fischer, U. (1992). Team cognition in the cockpit: Linguistic control of shared problem solving. In Proceedings of the 14th Annual Conference of the Cognitive Science Society. Hillsdale, NJ: Lawrence Earlbaum. Orasanu, J., Davison, J., & Fischer, U. (1997). What did he say? Culture and language barriers to efficient communication in global aviation. In R. S. Jensen (Ed.), Proceedings of the Ninth International Symposium on Aviation Psychology. Columbus, OH: The Ohio State University.
236
Orasanu, J., & Salas, EA. (1993). Team decision making in complex environments. In G. A. Klein, J. Orasanu, R. Calderwood, & C. E. Zsambok (Eds.), Decision making in action: Models and methods (pp. 327-345). Norwood, NJ: Ablex. Palmer, M. T. (1995). Interpersonal communication and virtual reality: Mediating interpersonal relationships. In F. Biocca & M. R. Levy (Eds.), Communication in the age of virtual reality (pp. 277-299). Hillsdale, NJ: Lawrence Earlbaum. Patterson, M. L., Powell, J. L., & Lenihan, M. G. (1986). Touch, compliance, and interpersonal affect. Journal of Nonverbal Behavior, 10(1), 41-50. Payne, J. W., Bettman, J. R., & Johnson, E. J. (1988). Adaptive strategy selection in decision making. Journal of Experimental Psychology: Learning, Memory, and Cognition, 14(3), 534-552. Porter, T. W., & Lilly, B. S. (1996). The effects of conflict, trust, and task commitment on project team performance. International Journal of Conflict Management, 7(4), 361-376. Prinzo, O. V. (1998). An analysis of voice communication in a simulated approach control environment (DOT/FAA/AM-97/17). Oklahoma City, OK: Civil Aeromedical Institute, Federal Aviation Administration. Reid, F. J. M., Malinek, V., Stott, C. J. T., & Evans, J. St. B. T. (1996). The messaging threshold in computer-mediated communication. Ergonomics, 39(8), 1017-1037. Remland, M. S., Jones, T. S., & Brinkman, H. (1995). Interpersonal distance, body orientation, and touch: Effects of culture, gender, and age. Journal of Social Psychology, 135(3), 281297. Rocco, E. (1998). Trust breaks down in electronic contexts but can be repaired by some initial face-to-face contact. In Proceedings of CHI ’98 (pp. 496-502). New York: ACM Press. Rocco, E., Finholt, T.A., Hofer, E.C., & Herbsleb, J.D. (2001, April). Out of sight, short of trust. Presentation at the Founding Conference of the European Academy of Management. Barcelona, Spain. Retrieved June 12, 2002 from http://intel.si.umich.edu/crew/technical_reports.htm#2001 Rocco, E., Finholt, T. A., Hofer, E. C., & Herbsleb, J. D. (2000). Designing as if trust mattered. Available: http://intel.si.umich.edu/crew/technical_reports.htm#2001. Salas, E., Dickinson, T. L., Converse, S. A., & Tannenbaum, S. I. (1992). Toward an understanding of team performance and training. In R. Swezey & E. Salas (Eds.), Teams: Their training and performance (pp. 2-29). Norwood, NJ: Ablex.
237
Sanders, M. S., & McCormick, E. J. (1993). Human factors in engineering and design (7th ed.). New York: McGraw Hill. Schachter, S. (1951). Deviation, rejection, and communication. Journal of Abnormal and Social Psychology, 46, 190-207. Scherwitz, L., & Helmreich, R. (1973). Interactive effects of eye contact and verbal content on interpersonal attraction in dyads. Journal of Personality and Social Psychology, 25, 6-14. Schudson, M. (1978). The ideal of conversation in the study of mass media. Communication Research, 5(3), 320-329. Schvaneveldt, R. W. (1990). Pathfinder associative networks: Studies in knowledge organization. Norwood, NJ: Ablex. Segal, L. D. (1994). Actions speak louder than words. In Proceedings of the Human Factors and Ergonomics Society 38th Annual Meeting (pp. 21-25). Santa Monica, CA: Human Factors and Ergonomics Society. Serfaty, D., Entin, E. E., & Johnston, J. H. (1988). Team coordination training. In J. A. CannonBowers & E. Salas (Eds.), Making decisions under stress: Implications for individual and team training (pp.221-245). Washington, DC: American Psychological Association. Sexton, J. B., Thomas, E. J., & Helmreich, R. L. (2000). Error, Stress, and Teamwork in Medicine and Aviation: Cross Sectional Surveys. British Medical Journal, 320, 745-749. Shavelson, R. J. (1996). Statistical reasoning for the behavioral sciences. Boston: Allyn & Bacon. Short, J. A. (1974). Effects of medium of communication on experimental negotiation. Human Relations, 27(3), 225-234. Short, J. A., Williams, E., & Christie, B. (1976). The social psychology of telecommunications. London: Wiley International. Siebold, G. L., & Kelly, D. R. (1988). Development of the Combat Platoon Cohesion Questionnaire (ARI Technical Report 817; ADA 204917). Alexandria, VA: US Army Research Institute for the Behavioral and Social Sciences. Singer, M. J., Commarford, P. M., & Kring, J. P. (2001, August). Presence in distributed virtual environments. Paper presented at the 9th International Conference on Human-Computer Interaction; HCI International 2001, New Orleans, LA.
238
Singer, M. J., Ehrlich, J., Allen, R. C. (1998). Effect of a body model on performance in a virtual environment search task. (Technical Report 1087, ADA 352 026). Alexandria, VA: U. S. Army Research Institute for the Behavioral and Social Sciences. Singer, M. J., Grant, S. G., Commarford, P. M., Kring, J. P., & Zavod, M. (2001). Team performance in distributed virtual environments (ARI Tech Report No. 1118). Orlando, FL: US Army Research Institute for the Behavioral and Social Sciences: Simulator Systems Research Unit. Singer, M. J., Grant, S. C., Commarford, P. Kring, J., & Zavod, M (2000, November). Training in distributed virtual environments. Paper presented at the Interservice/Industry Training Simulation and Education Conference (I/ITSEC), Orlando, FL. Smith, R. A., & Davis, S. F. (2003). The psychologist as detective: An introduction to conducting research in psychology. Upper Saddle River, NJ: Pearson. Smith, W., & Dowell, J. (2000). A case study of co-ordinative decision-making in disaster management. Ergonomics, 43, 1153-1166. Smith-Jentsch, K. A., Zeisig, R. L., Acton, B., & McPherson, J. A. (1998). Team dimensional training: A strategy for guided team self-correction. In J. A. Cannon-Bowers & E. Salas (Eds.), Making decisions under stress: Implications for individual and team training (pp. 271-297). Washington, DC: American Psychological Association. Spreitzer, G. M., Noble, D. S., Mishra, A. K., & Cooke, W. N. (1999). Predicting process improvement team performance in an automotive firm: Explicating the roles of trust and empowerment. In R. Wageman (Ed.), Research on managing groups and teams: Groups in context (Vol. 2) (pp. 71-92). Stamford, CT: JAI Press. Stansfield, S., Shawver, D., Sobel, A., Prasad, M., & Tapia, L. (2000). Design and implementation of a virtual reality system and its application to training medical first responders. Presence, 9(6), 524-556. Steiner, I. D. (1972). Group processes and productivity. New York: Academic Press. Stephenson, G. M., Ayling, K., & Rutter, D. R. (1976). The role of visual communication in social exchange. British Journal of Social and Clinical Psychology, 15, 113-120. Stogdill, R. M. (1972). Group productivity, drive, and cohesiveness. Organizational Behavior and Human Performance, 8, 26-43. Stout, R. J., Salas, E., & Fowlkes, J. E. (1997). Enhancing teamwork in complex environments through team training. Group Dynamics: Theory, Research, and Practice, 1(2), 169-182.
239
Stout, R. J., Cannon-Bowers, J. A., Salas, E., & Milanovich, D. M. (1999). Planning, shared mental models, and coordinated performance: An empirical link is established. Human Factors, 41, 61-71. Strupp, H. H., & Hausman, H. J. (1953). Some correlates of group productivity. American Psychologist, 8, 443-444. Swezey, R. W., & Salas, E. (1992). Guidelines for use in team-training development. In R. W. Swezey & E. Salas (Eds.), Teams: Their training and performance (pp. 219-245). Norwood, NJ: Ablex. Tabachnik, B. G., & Fidell, L. S. (1996). Using multivariate statistics (3rd ed.). New York: HarperCollins. Tannenbaum, S. I., Smith-Jentsch, K. A., & Behson, S. J. (1998). Training team leaders to facilitate team learning and performance. In J. A. Cannon-Bowers & E. Salas (Eds.), Making decisions under stress: Implications for individual and team training (pp. 247270). Washington, DC: American Psychological Association. Toquam, J. L., Macaulay, J. L., Westra, C. D., Fujita, Y., & Murphy, S. E. (1997). Assessments of nuclear power plant crew performance variability. In M. T. Brannick, E. Salas, & C. Prince (Eds.), Team performance assessment and measurement: Theory, methods, and applications (pp. 253-287). Mahwah, NJ: Lawrence Erlbaum. Tuckman, B. W. (1965). Developmental sequence in small groups. Psychological Bulletin, 63, 384-399. Tziner, A., & Vardi, Y. (1983). Ability as a moderator between cohesiveness and tank crew’s performance. Journal of Occupational Behavior, 4, 137-143. Urban, J. M., Weaver, J. L., Bowers, C. A., & Rhodenizer, L. (1996). Effects of workload and structure on team processes and performance: Implications for complex team decision making. Human Factors, 38, 300-310. Valacich, J. S., Wheeler, B. C., Mennecke, B. E., & Wachter, R. (1995). The effects of numerical and logical group size on computer-mediated idea generation. Organizational Behavior and Human Decision Processes, 62(3), 318-329. Valentine, M. E. (1980). The attenuating influence of gaze upon the bystander intervention effect. Journal of Social Psychology, 111(2), 197-203. Valentine, M. E., & Ehrlichman, H. (1979). Interpersonal gaze and helping behavior. Journal of Social Psychology, 107(2), 193-198.
240
Van Zelst, R. H. (1952). Sociometrically selected work teams increase production. Personnel Psychology, 5, 175-186. Weeks, G. D., & Chapanis, A. (1976). Cooperative versus conflictive problem solving in three telecommunication modes. Perceptual and Motor Skills, 42, 879-917. Weisband, S., & Atwater, L. (1999). Evaluating self and others in electronic and face-to-face groups. Journal of Applied Psychology, 84, 632-639. Wellens, A. R. (1987). Heart-rate changes in response to shifts in interpersonal gaze from liked and disliked others. Perceptual and Motor Skills, 64(2), 595-598. Wichman, H. (1970). Effects of isolation and communication on cooperation in a two-person game. Journal of Personality and Social Psychology, 16, 114-120. Williams, E. (1975). Coalition formation over telecommunications media. European Journal of Social Psychology, 5, 503-507. Williams, E. (1977). Experimental comparisons of face-to-face and mediated communication: A review. Psychological Bulletin, 84, 963-976. Williams, J. M., & Hacker, C. M. (1982). Causal relationships among cohesion, satisfaction, and performance in women’s intercollegiate field hockey teams. Journal of Sport Psychology, 4, 324-337. Wilson, C., & Williams, E. (1977). Watergate words: A naturalistic study of media and communication. Communication Research, 4, 169-178. Witmer, B. G., & Singer, M. J. (1994). Measuring immersion in virtual environments. (Technical Report 1014, ADA 286 183). Alexandria, VA: U. S. Army Research Institute for the Behavioral and Social Sciences. Witmer, B. G., & Singer, M. J. (1998, June). Measuring presence in virtual environments: A presence questionnaire. Presence, 7(3), 225-240. Witt, P. (2001). An experimental study of teachers’ verbal and nonverbal immediacy and students’ affective and cognitive learning. Communication Education, 50(4), 327-342. Wrzesniewski, A., McCauley, C., & Rozin, P. (1999). Odor and affect: Individual differences in the impact of odor on liking for places, things and people. Chemical Senses, 24(6), 713721. Xiao, Y., Mackenzie, C. F., & Patey, R. (1998). Team coordination and breakdowns in a real-life stressful environment. In Proceedings of the Human Factors and Ergonomics Society
241
42nd Annual Meeting (pp. 186-190). Santa Monica, CA: Human Factors and Ergonomics Society. Zaccaro, S. J. (1991). Nonequivalent associations between forms of cohesiveness and grouprelated outcomes: Evidence for multidimensionality. Journal of Social Psychology, 131(3), 387-399. Zaccaro, S. J., Gualtieri, J., & Minionis, D. (1995). Task cohesion as a facilitator of team decision making under temporal urgency. Military Psychology, 7(2), 77-93. Zaccaro, S. J., & Lowe, C. A. (1988). Cohesiveness and performance on an additive task: Evidence for multidimensionality. Journal of Social Psychology, 128(4), 547-558. Zaccaro, S. J., & McCoy, M. C. (1988). The effects of task and interpersonal cohesiveness on performance of a disjunctive group task. Journal of Applied Social Psychology, 18(10), 837-851. Zander, A., & Havelin, A. (1960). Social comparison and interpersonal attraction. Human Relations, 13, 21-32. Zheng, J., Bos, N.D., Olson, J.S., & Olson, G.M. (2001). Trust without touch: Jump-start trust with social chat. In Proceedings of CHI 2001, Short papers. New York: ACM Press.
242