Nan Du, Bin Wu, and Bai Wang. Beijing Key ... cation Call network) show that the algorithm is ..... Each kernel is regarded as a clustering center, and âki â K ...
Month 200X, Vol.21, No.X, pp.XX–XX
J. Comput. Sci. & Technol.
Community Detection in Complex Networks Nan Du, Bin Wu, and Bai Wang Beijing Key Laboratory of Intelligent Telecommunications Software and Multimedia, Beijing University of Posts and Telecommunications, China E-mail: {dunan, wubin, wangbai }@bupt.edu.cn Received May 9, 2007. Abstract
With the rapidly grown evidence that various systems in nature and society can be mod-
eled as complex networks, community detection in networks becomes a hot research topic in physics, sociology, computer society and etc. Although this investigation of community structures has motivated many diverse algorithms, most of them are unsuitable when dealing with large networks due to their computational cost. In this paper, we present a faster algorithm ComTector which is more efficient for the community detection in large complex networks based on the nature of overlapping cliques. This algorithm does not require any priori knowledge about the number or the original division of the communities. With respect to practical applications, ComTector is challenged with five different types of networks including the classic Zachary Karate Club, Scientific Collaboration Network, South Florida Free Word Association Network, Urban Traffic Network, North America Power Grid and the Telecommunication Call Network. Experimental results show that our algorithm can discover meaningful communities that meet both of the objective basis and our intuitions. Keywords
∗
complex networks, community detection, social network analysis
This work is supported by the National Science Foundation of China under grant number 60402011, and the
National Science and Technology Support Program of China under Grant No.2006BAH03B05.
2
1
J. Comput. Sci. & Technol., Month 200X, Vol.21, No.X
Introduction Recent researches indicate that a large body of
diverse systems in many different domains can be represented as complex networks[1,2,3,4]. Examples include the internet, the World Wide Web, social networks, citation networks and etc. In each case, the system is modeled as a large intricate web of connections among the massive entities they are made of, such as the physical connections between routers, hyper-links between web pages, friendships between people, and references among papers. Most of these networks are generally sparse in global yet dense in local. They have vertices in a group structure that the vertices within the groups have higher density of edges while vertices among groups have lower density of edges[5,6]. This kind of structure is called the community which is an important network property and can reveal many hidden features of the given networks. For instance, the communities in World Wide Web correspond to topics of interest. In social networks, individuals belong to the same community tend to have properties in common. Nowadays, community detection is also considered to be used for improving the search engine and detecting the terrorist organizations in the World Wide Web. Hence, community identification is a fundamental step not only for discovering what makes entities come together, but also for understanding the overall structural and functional properties of a large network[7]. A popular quantitative definition called Network Modularity Q, proposed by Girvan and Newman[8,9], is widely used as a quality metric for assessing the partitioning of a network into commu-
nities. The search for the largest modularity value is a N P -hard problem due to the fact that the space of all possible partitions grows faster than any power of the system size[10]. For this reason, many recent algorithms adopt various heuristic strategies to optimize this metric. However, as mentioned in [11], most actual networks are made of highly overlapping cohesive groups of nodes(cliques or k-cliques). As a result, when the network has highly overlapping cliques, most of the existing algorithms in general are inefficient due to their heuristic optimization strategies. Therefore, in this paper, we design an algorithm which is efficient for the community detection in large complex networks by using such overlapping nature of the cliques in real world scenarios. Given a large sparse graph, the running time of our algorithm is O(C ×T ri2 ), where C is the number of the detected communities and T ri is the number of the triangles in the given network for the worst case. The experiments on six real datasets(Zachary Karate Club, Scientific Collaboration Network, South Florida Free Word Association Network, Urban Traffic Network, North America Power Grid and the Telecommunication Call network ) show that the algorithm is able to generate communities of practical significance in the end. The rest of this paper is structured as follows: in section 2, we mainly review some related work. Section 3 describes the community detection algorithm in details. The experimental results and analysis are presented in section 4; and we conclude the paper in section 5.
Nan Du et al.:Community Detection in Complex Networks
2
Related Work There exist many algorithms for identifying com-
munities in literature. The spectral bisection methods[12,13] and the Kernighan-Lin[14] algorithm are early solutions to this problem in computer society. However, the major disadvantage of the spectral approach is that the bisection methods only bisect graph iteratively, which is unsuitable to general networks. For the Kernighan-Lin algorithm, it requires a priori knowledge about the sizes of the initial divisions[15]. In social network analysis (SNA), a group of algorithms focus on the discovery of the so-called cohesive sub-structures[5,6], including the cliques[16,17], n-cliques, n-clans, n-plexes[18], as well as the quasicliques[19,20,21]. These dense sub-structures often impose extra restrictions on the community definitions. For instance, the definition of n-clique requires that the distance between any pair of vertices should be no more than n, while in a quasi-clique the ratio of the number of each vertex’s neighbors to the number of all the vertices in the sub-structure is no less than a threshold value. Meanwhile, the average size of these sub-structures is always small, so people may get a great number of them, which actually hides the global organization of the network. Another widely used technique in SNA is the hierarchical clustering[22] which groups similar vertices into larger communities. Donetti and Munoz [23] have adopted such hierarchical clustering method by using the eigenvectors of the Laplacian matrix of the graph to measure the similarities among vertices. The complexity is determined by the com-
3
putation of all the eigenvectors, in O(n3 ) time for sparse matrices. While it does not require us to specify the size or number of the communities beforehand, this method does not know when to stop the agglomerative process for the best division of the network. In recent years, Girvan and Newman have introduced a divisive method[9,24] by iteratively cutting the edge with the greatest betweenness value, it can generate an optimized division of the network with O(m3 ) time complexity according to the optimized network. Radicchi has proposed a similar methodology with GN [25] by using the edgeclustering coefficient as a new metric with a smaller time complexity O(m2 ). To further improve the efficiency, Clauset, Newman and Moore have also proposed a fast clustering algorithm[26] with O(n log 2 n) time complexity on sparse graph which merges pairs of nodes to generate the maximal ∆Q iteratively until it becomes negative. Pascal Pons and Matthieu Latapy[27] have proposed another clustering algorithm by using the random walk method to evaluate the similarity among vertices. It uses Network Modularity as well to determine when to stop the agglomerative process and has O(n2 log n) time complexity. Other interesting algorithms include Jordi Duch and Alex Arenas’s extremal optimization method proposed in[10] with O(n2 log n) time complexity, Aaron Clauset’s method for finding local community structures in[28], the force-based incremental algorithm of Bo Yang and Da-You Liu in [29] which focuses on mining the community structure in a dynamic network, and the agent-based algorithm proposed by Ismail Gunes and Haluk Bingol in[30].
4
J. Comput. Sci. & Technol., Month 200X, Vol.21, No.X All these current algorithms are successful ap-
S 0 = S, then S is a maximal clique of G.
proaches for community discovery from different perspectives.
However, the actual complex net-
works are usually large sparse graphs with regions
Definition 2. For a given vertex v, N (v) = {u|(v, u) ∈ E(G)}, we call N (v) is the set of all neighbors of v.
consisting of overlapping cliques[11]. As a consequence, the betweenness based divisive algorithms will have very low computational efficiency while
S
Definition 3. Given set S ⊆ V (G), N |S = N (v i ) − S, v i ∈ S, N |S is the set of all neighbors
of S.
the fast agglomerative method[26] in general can
Definition 4. Let Com(G) be the set of all
not give a satisfactory division due to its local op-
components in G. The giant component is denoted
timization strategy. Therefore, we follow a different
by C G and M (C G ) is the set of all the maximal
track by presenting an algorithm which can gener-
cliques in C G . We use V M ⊆ V (G) to represent
ate a higher network modularity than the fast algo-
the set of all vertices covered by M (C G ).
rithm while performs more efficiently than the GN algorithm.
Definition 5. Given vertex v i ∈ V M , C i is the set of all maximal cliques that contain v i , and C = {C i |C i ⊆ M (C G )}. ∀C i , C j ∈ C, if
3
Community Detection Algorithm The basic idea of ComTector is to build up
communities around overlapping cliques. We regard overlapping maximal cliques as the clustering kernels and carry out an agglomerative process to
obtained fractional communities will be properly adjusted so as to prevent the network from being divided into too small pieces.
≥ f
which is a threshold to describe the extent to which C i and C j overlap, we call C j is contained by C i , denoted by C j < C i . If C i is not contained by any other element in C, C i is called the kernel of G and v i is the center of C i . Definition 6. Let K be the set of all kernels
associate the rest vertices to their closest kernels based on a proposed distance measure. Finally the
|C i ∩C j | |C j |
in G. V K = {v i |v i ∈ k j , k j ∈ K} is the set of all S vertices covered by K and I K = (k i ∩ k j ), k i , k j ∈ K, i 6= j is the union of all the vertices that any pair of elements in K has in common. Definition 7. For any given vertex v i , the
3.1
Problem Formulation
In this paper, we consider simple graphs only, i.e., the graphs without self-loops or multi-edges. Given graph G, V (G) and E(G) denote the sets of its vertices and edges respectively. Definition 1. Given set S ⊆ V (G), ∀u, v ∈
Freeman Relative Centrality[5] is defined as C RD = |N (v i )|/(n − 1). Definition 8. Given graph G, the centralP ization[5] of G is defined as GC = (C RDmax − C RD (v i ))/(n − 2).
3.2
Algorithm
S, u 6= v, such that (u, v) ∈ E, then S is a clique in G. If any other S 0 is a clique and S 0 ⊇ S iff
Since that most complex networks always have a giant component, we first use an efficient algorithm
Nan Du et al.:Community Detection in Complex Networks
5
Peamc[17] to enumerate all maximal cliques in this giant component. Because a maximal clique is a complete sub-graph, it can represent the closest relationship among different entities and thus is the densest community in the given network. For any v i ∈ V (G), C i is the set of all maximal cliques containing v i . ∀v i , v j ∈ V M , if
|C i ∩C j | |C j |
≥f
(f is an empirical value), which means all or most of v j ’s relationships are covered by those of v i , we say v j depends on v i and C j is contained by C i .
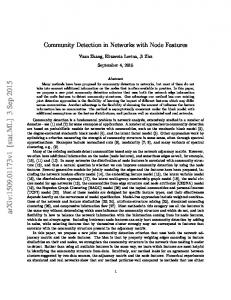
Figure 1: Overlapping Cliques
Otherwise, if C j is not contained by any other element of set C, then C j is called a kernel. From the above discussion, we can conclude that the larger the size of C i can be, the more likely
from C i n to get rid of unnecessary duplications. If C n is not empty, it is put in set K. The process continues iteratively until C becomes empty.
that a kernel it would become. Therefore, we re-
To make things more concrete, an illustrated
arrange all the elements of set C according to the
example is given as follows on the network shown
descending order of their sizes and delete those ele-
in Figure 1. Here, v 0 is contained in four maximal
ments whose sizes are smaller than 2, which means
cliques with C 0 = {{v 0 , v 1 , v 4 , v 5 }, {v 0 , v 1 , v 3 , v 4 },
if C i is going to be a kernel, v i must participate
{v 0 , v 2 , v 3 , v 4 }, {v 0 , v 4 , v 5 , v 6 }}. With respect to
in at least two closest relationships. Here, let C i 0
v 1 , it is involved in two maximal cliques with C 1 =
be the element of C with the largest size, C i 1 be
{{v 0 , v 1 , v 4 , v 5 }, {v 0 , v 1 , v 3 , v 4 }}. Since that C 1
the element of C whose size ranks second. . . C i n be
is contained by C 0 , C 1 is unable to be a kernel.
the element of C whose size ranks n and so on. K
Similarly,C 2 , C 3 , C 4 , C 5 are also contained by
is the set of all kernels. We first pick up C i 0 and
C 0 , and C 8 , C 9 , C 10 , C 11 are contained by C 7 .
remove those elements it contains from C. In the
Therefore, C 0 and C 7 are two different kernels with
next step, we delete each maximal clique that con-
v 0 , v 7 being as the centers respectively. The overall
tains the centers of the left elements in C from C i 0 .
process is depicted in algorithm 1.
If C i 0 is not empty, it is put in set K. Again, we
Starting from set K, we see that each element
will pick up the element with the largest size from
of K corresponds to the kernel of a possible com-
the rest elements of C, such as C i n , remove it from
munity in G. In fact, the purpose to generate set K
C, remove all the elements contained by C i n , and
is similar to that of the classic k-means algorithm
delete each maximal clique that includes the cen-
for finding the clustering center. Thus, people may
ters of the left elements in C from C i n . If there
argue that another very intuitive method to search
is any maximal clique that contains the centers of
for the kernels might depend on the degree of each
the elements in set K, it also needs to be deleted
vertex. It is possible for us to sort all the vertices
6
J. Comput. Sci. & Technol., Month 200X, Vol.21, No.X
according to the descending order of the vertex’s
a large community. In our experiments, we have
degree and treat the set of each vertex as well as
found that approximate 40 percent of the top 10
their neighbors as the element of set C to generate
elements in set C have their centers’ degrees also
the kernels. Even though this method seems to be
ranked top 10. Most vertices in the communities
simple and straightforward, doing so will not bring
of average size do not have large degrees. Let v k
us a good network modularity value.
be the center of the element in C with the smallest
Algorithm 1 FilterOutKernels(C,f) 1: K ⇐ ∅
size and v d be the vertex with the maximum degree. We have found that the proportion of the number
2: sort C by the descending order of |C i |
of vertex v whose degree is such that |N (v k )| ≤
3: {core stores the centers of the generated
|N (v)| ≤ |N (v d )| to the number of all the vertices
kernels} 4: core ⇐ ∅ 5: for C i ∈ C do
is 75% on average, which is far more than |C| and thus leads to a low efficiency for kernel generation. Therefore, whether a vertex would be included in a community actually depends on how closely its
6:
contained ⇐ C j , j 6= i, C j < C i
7:
independent ⇐ k, k 6= i, C k ≮ C i
8:
delete C i from C
the overlapping maximal cliques to find the possible
9:
C ⇐ C − contained
kernels.
10: 11: 12:
for s ∈ C i do if s ∩ (independent ∪ core) 6= ∅ then delete s from C i
neighboring vertices are connected with each other, which is another important motivation for us to use
The discovered communities form a complete partition of C G , and thus require every pair of elements in K should not have any vertex in common.
end if
As a result, pair-wise intersection among elements
14:
end for
of K will be performed and all the common vertices
15:
if C i 6= ∅ then
will be put in set I K . For each vertex v i ∈ I K ,
13:
16:
K ⇐ Ci
17:
end if
18:
core ← v i
19: end for 20: return K
The reason is that the vertices contained in communities do not necessarily have large degree.
we use a distance measure to identify which kernel in K is closest to v i . Based on C RD and GC , given vertex v i and sub-graph S G , we add v i to the closest S G and our distance measure is defined as Dv i = a0 · C RD (v i ) + a1 · (GC + (C RD (v i ) − C RDmax )), where a0 + a1 = 1, a0 , a1 ∈ (0, 1). This metric represents the distance between the given vertex and its closest kernel by taking full
A large vertex’s degree only indicates that the ver-
account of the following factors: C RD (v i ) directly
tex itself as a single entity has many connections
reflects the relative significance of vertex v i . The
with others, yet it does not mean it is involved in
larger C RD (v i ) can be, the more important vertex
Nan Du et al.:Community Detection in Complex Networks
7
v i would become. Gc and (C RD (v i ) − C RDmax )
kernels and will be marketed as old. As a result, ev-
are fine tuning factors. If a sub-graph has a high
ery kernel is now expanded. Again each new vertex
central tendency while the gap between the rela-
in set N |V E is added to a tentative set V E ’. Next
tive degree of vertex v i and the maximum one is
the vertices in V E ’ are also assigned to their clos-
small, v i can hold a more significant position. Ev-
est kernels and are marked as old. This process is
ery vertex in I K is assigned to its closest kernel in
repeated iteratively until the kernels can not be ex-
K, which is shown in Algorithm 2. In Figure 1, C 0
panded any more. Algorithm 3 describes the whole
and C 7 share v 5 . We regard CRD as the dominant
procedure.
factor, such that a0 = 0.8 and a1 = 0.2. Since that the distances of v 5 to C 0 and C 7 are 0.543 and
Algorithm 3 AssignVertex(K) 1: for v i ∈ V K do
0.271 accordingly, v 5 is thus assigned to C 0 and
2:
removed from C 7 .
3: end for
Algorithm 2 DeDuplication(K) 1: I K ⇐ ∅
4: V E
2: for k i ∈ K do
4:
for k j ∈ K, i < j do S I K ← I K (k i ∩ k j )
5:
end for
3:
6: end for 7: for v ∈ I K do 8:
v i is marked as old
S
9: end for
N (k i ) − V K
5: while V E 6= ∅ do
for v i ∈ V E do
6: 7:
assign v i to its closest kernel k i
8:
v i is marked as old end for
9:
V E ’← ∅, V E ’← vertices not marked as
10:
remove v from all the kernels except for the one having the maximum distance
← vertices not marked as old in
old in N |V E V E ← ∅, V E ← V E ’
11:
12: end while
Each kernel is regarded as a clustering center, and ∀k i ∈ K every vertex in V (C G ) − V K will be
3.3
Modularity Optimization
assigned to their closest kernel based on the corresponding value of the distance measure. This procedure is done by gradually expanding these kernels in K. We adopt a marking strategy to differentiate new vertices from old ones. In the first step, all vertices in V K are marked as old. In the second step, S every new vertex in the set N (k i ) − V K , k i ∈ K will be added to a tentative set V E . In the third step, all vertices in V E are assigned to their closest
When the clustering process is finished, all the obtained sub-structures constitute the original division of C G . We then adopt the Network Modularity Q to evaluate this original division. Based on our observations, there exist some extremely small communities in this division which are derived from the tiny kernels compared with others. The actual causes of such fractional kernels is
8
J. Comput. Sci. & Technol., Month 200X, Vol.21, No.X
that for a specific C i containing vertex v i , v i may
tained, we can use the amalgamation process of the
not be the true center of C i . In other words, al-
fast algorithm to increment Q0 by the largest ∆Q
though each maximal clique in set C i contains v i ,
until it becomes negative. Because this optimiza-
it may also include many centers of other kernels,
tion method is just like that of the fast algorithm,
so v i is not the expected core figure and is just a
it suffers from the resolution limit[31] problem as
normal entity which participates in the social cy-
well. With respect to the second method, the frac-
cles of other core figures. Consequently, while C i is
tional communities of the original division whose
able to become a kernel, it can not contain enough
sizes are below the average level will be merged
cliques of other elements in set C. However, every
with the rests. In our experiments, we have found
maximal clique which contains the centers of other
that the final modularity value obtained by this
kernels is deleted from C i . As a result, C i is re-
straightforward method is often close to that of the
duced to a rather small kernel. The communities
former with even less computational costs.
derived from these small kernels may partition the
3.4
network into too small pieces.
Performance Analysis
To address this problem, we propose two meth-
From the priori discussion, the enumeration of
ods to adjust the original division. In terms of the
all maximal cliques in G by using P eamc[17] will
first one, we adopt the basic idea from Newman’s
cost O(∆ × M C × T ri2 ) in the worst case on a sin-
fast algorithm to perform a local greedy optimiza-
gle processor, where ∆ is the maximal degree of G,
tion. Given the p × p symmetric matrix e whose
M C is the size of the maximum clique and T ri is
element eij is the fraction of all edges in the net-
the number of all triangles in G. For most complex
work that link vertices in community i to vertices X in community j, the row sums ai = eij repre-
networks, they are often large sparse graphs where
j=0
|V (G)| ≈ |E(G)|. In these networks, the size of
sent the fraction of edges that connect to vertices X in community i. Q is thus defined as (eii − ai 2 ).
the clique has a power-law distribution where the
We iteratively search for the changes ∆Q from
clustering coefficient property (which directly cor-
number of triangles is the most. By taking the high
the amalgamation of each pair of communities, choose responds to the existence of triangles) of complex the largest one, and perform the corresponding amal- networks into consideration, P eamc[17] can pergamation until ∆Q becomes negative. The modu-
form very efficiently (especially when |V (G)|/|E(G)| ≤
larity value of the original division is Q0 . Suppose
3). To find the kernel set K, we need to traverse
we first merge community i with j and the new
all the elements of C whose size is larger than 2,
community is denoted as (ij). We can have aij − a 2 + ai 2 + aj 2 i, j connected (ij ) ∆Q = 0 otherwise
which will cost O(M C × |C|2 ). The parameter f to
.
on our experiments, we suggest that it should be Once the initial values of ∆Q and ai are ob-
identify whether one element of C is contained by another influences the number of kernels. Based
larger than 0.3, although the changing of modu-
Nan Du et al.:Community Detection in Complex Networks
9
Table 1: Datasets used in our experiments Network
|V (G)|
|E(G)|
Zachary Karate Club
34
78
Scientific Collaboration
1667
4487
Word Association
10225
81330
U.T. of Beijing
4235
13846
U.T. of Shanghai
1967
4593
U.T. of Shenyang
954
2772
Power Grid
4941
6594
gorithm is first tested on the well-known Zachary
T.C. 1
512024
1021861
Karate Club[4][5], and then is challenged with Sci-
T.C. 2
845750
1544834
T.C. 3
2423807 5317183
Figure 2: Zachary Karate Club
entific Collaboration Network, South Florida Free Word Association Network [32], Urban Traffic Network (U.T.), and the North America Power Grid [1].
larity is not very sensitive to it. As for a0 , and a1 , the relative degree is regarded as the dominant factor, so these two coefficients are set to 0.8, and 0.2 accordingly. Since that V M − V K ≈ V (G), assigning the rest vertices in V M − V K will cost O(|K| × |V (G)| × I), where I is is the average times for the process to repeat until K is empty. In sparse graphs, we have |V (G)| ≈ |E(G)|, |C| < |V (G)|, |K| ≈ |C|, |V (G)| < T ri2 ¿ |V (G)|2 , and ∆ × M C < |K|. Let C denote the number of the communities in the original division. The adjustment phase using modularity optimization will cost O(C × log C). Because C ≈ |K| and I has the av-
Based on the experimental results, we will have a detailed discussion about the optimization of parameter f . In the end, our algorithm is further tested on the large Telecommunication Call networks (T.C.) to illustrate the global structural properties of complex networks. Table 1 shows the general description of our datasets. The building and organization of each network will be presented in the following sections. All experiments are done on a single PC (3.0GHz processor with 2Gbytes of main memory on Linux AS3 OS).
4.1
Zachary Karate Club
erage value of 6 according to the small-world prop-
Zachary Karate Club is one of the classic studies
erty, the overall cost will be O(C × T ri2 ) in the
in social network analysis. Over the course of two
worst case.
years in the early 1970s, Wayne Zachary observed social interactions between the members of a karate
4
Experimental Results In this section, we present a number of appli-
cations to which ComTector is applied. The al-
club in an American university. He built network of connections with 34 vertices and 78 edges among members of the club based on their social interactions.
10
J. Comput. Sci. & Technol., Month 200X, Vol.21, No.X
Table 2: Results on the Scientific Collaboration Network Scientific Collaboration Network Algorithm
Communities
Q
Time
GN
79
0.85
403s
Newman Fast
85
0.43
2.4s
ComTector
81
0.83
1s
By chance, a dispute arose during the course of
Figure 4: comfort community
his study between the club’s administrator and the karate teacher. As a result, the club split into two smaller communities with the administrator and the teacher being as the central persons accordingly. Figure 2 shows the detected two communities by our algorithm.
4.2
Scientific Collaboration Network
the vertices of the Core area, we come to the detailed description of each specific community. In this magnified picture, the color of each community is the same as that of the vertex in the Core area. The vertices in every community are the central persons being as the representatives of the research group. The solid lines among these vertices
The data of the collaboration network is obtained according to the 1990 published papers from the year 1998 to 2005 indexed by SCI, EI and ISTP in Beijing University of Posts and Telecommunications. Each author corresponds to a vertex of the network and there is an edge between two vertices if the two authors have collaborated in a paper. A great deal of work has gone into disambiguation of
show that the central persons of the given communities have collaborated together, while the dashed lines mean that the rest persons other than the central ones of the communities have once collaborated with each other. More specifically, the community with ”XiaoMin Ren” and ”YongQing Huang” are further enlarged to show the detailed internal structure.
similar names, so co-authorship relationships are relatively free of name resolution problems. The
4.3
top portion in Figure 3 gives the map of all the
tion Network
discovered 81 communities in Table 2. Each community in the Periphery area is an independent small component of the network, and the Core area corresponds to the giant component with each vertex being the representation of the corresponding community. By zooming onto
South Florida Free Word Associa-
The purpose of South Florida Free Word Association Network by Douglas L. Nelson and Cathy L. McEvoy[32] is to make the largest database of free word association ever collected in the United States available to interested researchers and schol-
Nan Du et al.:Community Detection in Complex Networks
Figure 3: All Discovered Communities in the Collaboration Network
11
12
J. Comput. Sci. & Technol., Month 200X, Vol.21, No.X
Table 3: Results on South Florida Free Word Association Network South Florida Free Word Association Network Algorithm
Communities
Q
Time
GN
n/a
n/a
> 2h
Newman Fast
68
0.16
356s
ComTector
75
0.25
99s
ars. More than 6,000 participants produced nearly three-quarters of a million responses to 5,019 stimulus words. Participants were asked to write the first word that came to mind that was meaningfully related or strongly associated to the presented word
Figure 5: Backbone of the Urban Traffic Net-
on the blank shown next to each item.
work in Beijing
For example, if given BOOK[
], they might
write READ on the blank next to it. This procedure is called a discrete association task because each participant is asked to produce only a single associate to each word. The network consists of 10225 vertices and 81330 edges. Each commu-
Table 4: Results on the Urban Traffic Network in Beijing, Shanghai, and Shenyang Urban Traffic Network in Beijing
nity corresponds to a group of semantically related
Algorithm
Communities
Q
Time
words. Figure 4 presents the community around
GN
54
0.83
>2h
”comfort”. Table 3 gives different results by the
Newman Fast
71
0.40
19s
ComTector
66
0.82
7s
three algorithms.
4.4
Urban Traffic Network
We build the urban traffic networks in three famous cities of China including Beijing, Shanghai and Shenyang. In this network, each vertex is a bus stop and there exists an edge between two vertices if they are neighboring in the same bus line. Experimental results on the three networks are given in Table 4. If we zoom out of each community and regard them as nodes, we will obtain a commu-
Urban Traffic Network in Shanghai GN
25
0.78 1560s
Newman Fast
28
0.36
6s
ComTector
14
0.74
1s
Urban Traffic Network in Shenyang GN
26
0.82
28s
Newman Fast
31
0.4
1s
ComTector
14
0.80
1s
Nan Du et al.:Community Detection in Complex Networks nity graph. In this graph, each vertex represents a particular community and there is an edge be-
13
Table 5: Results on North America Power Grid Network
tween two vertices if they have some vertices in common within the distance of one hop. By treat-
North America Power Grid Network
ing the reciprocal of the common vertices’ number
Algorithm
Communities
Q
Time
between the two ends of an edge as the weight,
GN
36
0.92 3122s
we calculate a minimal spanning tree in the com-
Newman Fast
63
0.45
143s
munity graph. This obtained spanning tree thus
ComTector
35
0.90
4s
represents the backbone of the given network. In our experiment, the 66 detected communities are numbered from 0 to 65 and the backbone of the urban traffic network in Beijing is shown in Figure 5, we see that the 66 communities in Beijing covers most of the traffic hubs in the city, which meets our common sense that the growth of a big city always develops a robust transport system.
4.5
North America Power Grid
We have also run ComTector on the raw data representing the topology of the Western States Power Grid of the United States, which was originally used by D. Watts and S. Strogatz to describe the collective dynamics of ’small-world’ networks. The whole network is an unweighted, undirected graph containing 4941 vertices and 6594 edges. The number of discovered communities are shown in Table 5.
4.6
Figure 6: Network Modularity Q Figure 6 shows this kind of relation in the Scientific Collaboration, Word Association, Urban Traffic Network, and Power Grid Network respectively. If f is too large, it will cut the network into
Parameter Optimization
In the algorithm, the possible values of parameter f affect the ultimate outcome of the partition. We adopt Newman’s Q modularity to evaluate the strength of the detected community structures. f determines the kernels’ number in the given network, which in turn has an influence on the Q value.
smaller pieces. For each community i, eii tends to be small and ai is relatively large, which further causes Q to decrease. As a result, in Figure 6, we see when f ∈ (0.3, 0.5), Q often reaches its maximum value on average, although the changing of Q is not very sensitive to f .
14
J. Comput. Sci. & Technol., Month 200X, Vol.21, No.X
4.7
Telecommunication Call Networks
The Telecommunication Call Networks are built from the datasets in a city and in a province within the period of one month from a Telecom Operator in China. We regard each subscriber as a vertex and two vertices will share an edge if the subscribers have once contacted with each other by their mobile phones. We have detected 28033 and
Figure 7: Backbone of the telecommunication call network 2 The Distribution of Community Size
5
2171 communities in the telecommunication call
10
network 1 and 2 with 0.60 and 0.64 Q modular4
10
neither GN nor N ewmanF ast can generate satisfactory results within the acceptable time. Looking at the large communities in the networks, we have
Community Number
ity accordingly within the period of 4200s, while
3
10
2
10
found that they often consists of people who have close spending power, similar ages or live in the
1
10
same areas. To some extent, these obtained com0
munity structures and these corresponding com-
10 0 10
1
10
2
10 Community Size
3
10
mon factors are useful clues for the Telecom Operator to design their client market policies. In ad-
Figure 8: Power-law distribution of the commu-
dition, by following what we do in the urban traffic
nity size
network to build the community graph, we can obtain the backbone of the large telecommunication call network, which is shown in Figure 7. The left part of Figure 7 is the core of the original network with 845750 vertices and 1544834 edges. It is obvious that all the massive vertices and edges are intertwined together, which is hard for us to read and analyze. By contrast, the backbone of this large network is presented in the right part, which gives us a direct sense about the global organization of the whole picture. One important property of the complex networks is that the distribution of the community size k appears to have
a power-law form P (k) ∼ k −α with some constant α. In our experiment, we run our algorithm on a very large telecommunication call network 3 which consists of 2423807 vertices and 5317183 edges with 139244 discovered communities. The experimental result shows that the telecommunication call network also exhibit such kind of property with an exponent α = 3.28, which is shown in Figure 8. We guess that this power-law distribution of the communities is possibly resulted from the formation and evolution of the complex network itself. This kind of connection will lead the direction of our future research.
4
10
Nan Du et al.:Community Detection in Complex Networks
5
Conclusion In this paper, we have followed a different track
by proposing a new method ComTector for the community detection in complex networks. Based on the overlapping nature of cliques in our real world, this algorithm can be applied to many large sparse graphs. It is very simple and intuitive to extract satisfactory results on networks whose community structures are known before. The method consists of two critical steps. In terms of the first step, we adopt a significantly efficient algorithm to enumerate all maximal cliques in the giant component of the given network. These clusters of the maximal cliques form the kernels of the potential
15
are obtained from diverse systems of different fields, they indeed have some similar structural properties in common. For the future work, we will continue our research by focusing on the evolution and prediction of the community structures as well as the backbone of the complex network by using time series analysis to have a deeper understanding of the network dynamics from both of the micro and macro perspectives. Moreover, we will extend our algorithms to find communities in bipartite networks, which could further improve existing collaborative recommendations based on the community wisdom.
References
communities. With respect to the second step, we use an agglomerative technique which iteratively add the left vertices in the giant component to their closest kernels. The clustering results will then be properly adjusted by merging the fractional communities to achieve a better Network Modularity, and the finally obtained community structures together with other components constitute the ultimate partition of the network. We have demonstrated the efficiency and utility of the algorithm with a number of practical examples. Experimental results on real-world networks show that the algorithm can extract meaningful communities that meet both of the objective facts and our intuitions. In addition, we also use ComTector to analyze networks whose structure is otherwise difficult to understand. These networks include the Scientific Collaboration, Word Association, Urban Traffic, Power Grid and Telecommunication Call network. Despite that these networks
[1] Watts, D.J. and Strogatz, S.H. Collective Dynamics of ’Small-World’ Networks. Nature, Vol393: 440–442. [2] Watts, D.J. Small Worlds:The Dynamics of Networks between Order and Randomness. Levin, S.A., Strogatz, S.H. (eds.), Princeton: Princeton University Press, 1999. [3] Boccaletti, S., Latora, V. and Moreno, Y. Complex Networks: Structure and Dynamics Physics Reports, Vol-424(Issue 4-5): 175–308. [4] Newman, M.E.J. The Structure and Function of Complex Networks. SIAM Review, Vol-45: 167–256. [5] Wasserman, S. and Faust, K. Social Network Analysis. Cambridge: Cambridge University Press, 1994. [6] Scott, J. Social Network Analysis: A Handbook. London: Sage Publications, 2002. [7] Milo, R., Itzkovitz, S., et al. Network Motifs:
16
J. Comput. Sci. & Technol., Month 200X, Vol.21, No.X Simple Building Blocks of Complex Networks.
Proc. PAKDD07 Workshops, Nan Jing, 2007,
Science, Vol-298:824–827.
pp.476–483.
[8] Newman, M.E.J. Modularity and community [19] Abello, J., Resende, M.G.C., and Sudarsky, S. structure in networks.PNAS, Vol-103: 8577.
et al. Massive Quasi-Clique Detection. In Proc.
[9] Girvan, M. and Newman, M.E.J. Community
the 5th Latin American Symposium on Theoret-
structure in social and biological networks PNAS, Vol-99:7821–7826.
ical Informatics, Mexico, 2002, pp.598–612 . [20] Pei, J., Jiang, D.X., and Zhang, A.D. et al.
[10] Duch, J. and Arenas, A. Community detection
On mining cross-graph quasi-cliques. In Proc.
in complex networks using extremal optimiza-
The 12th ACM SIGKDD, Philadelphia, 2006,
tion. Physical Review E, Vol-72: 027104.
pp.228–237.
[11] Palla, G., Dernyi, I., and Farkas, I. Uncovering [21] Zeng, Z., Wang, J., and Karypis, G. et al. Cothe Overlapping Community Structure of Com-
herent Closed Quasi-Clique Discovery from Large
plex Network in Nature and Society. Nature,
Dense Graph Databases. In Proc. The 12th
Vol-435:814–818.
ACM SIGKDD, Philadelphia, 2006, pp.797–802.
[12] Fiedler, M. Algebraic connectivity of graphs. [22] Han, J.W. and Kamber, M. Data Mining: ConCzechMath J, Vol-23: 298–305. [13] Pothen, A., Simon, H., and Liou K-P. Partition-
cepts and Techniques, 2nd ed. Morgan Kaufmann Publishers, 2006.
ing sparse matrices with eigenvectors of graphs. [23] Luca Donetti and Miguel A. Munoz Detecting SIAM J Matrix Anal App., Vol-11: 430–452. [14] Kernighan, B.W., and Lin, S. A efficient heuristic procedure for partitioning graphs. Bell System Technical Journal, Vol-49: 291–307. [15] Newman, M. E. J. Detecting community structure in networks. Eur. Phys. J. B, Vol-38: 321–330. [16] Bron, C., and Kerbosch, J. Finding all cliques of an undirected graph. Communications of the ACM , Vol-16: 575–577. [17] Du, N., Wu, B., and Wang, B. et al. A Parallel Algorithm for Enumerating All Maximal
Network Communities: a new systematic and efficient algorithm Journal of Statistical Mechanics, P100102. [24] Girvan, M. and Newman, M.E.J. Finding and evaluating community structure in networks. Physical Review E, Vol-69: 026113. [25] Radicchi, F., Castellano, C., Cecconi, F., Loreto, V., and Parisi, D. Defining and identifying communities in networks. PNAS, Vol-101: 2658. [26] Clauset, A., Newman, M.E.J. and Moore, C. Finding community structure in very large networks. Physical Review E, Vol-70: 066111.
Cliques in Complex Networks. In Proc. The [27] Pons, P. and Latapy, M. Computing Commu6th ICDM2006 Workshop, Hong Kong, 2006,
nities in Large Networks Using Random Walks.
pp.320–324.
In Proc. ISCIS2005, Istanbul, 2005, pp.284–
[18] Wu, B. and Pei,X. et al. A Parallel Algorithm
293.
for Enumerating all the Maximal k-plexes. In [28] Clauset, A. Finding local community structure
Nan Du et al.:Community Detection in Complex Networks in networks.Physical Review E, Vol-72: 026132. [29] Yang, B., and Liu, D.Y. Force-Based Incremental Algorithm for Mining Community Structure in Dynamic Network Journal of Computer Science and Technology, Vol-21: 393-400. [30] Gunes, I. and Bingol, H. Community Detection in Complex Networks Using Agents. CoRR, Vol: abs/cs/0610129. [31] Fortunato, S. and Barthelemy, M. Resolution limit in community detection. PNAS, Vol-104: 36-41, 2007. [32] http://w3.usf.edu/FreeAssociation/
17


![[inria-00492058, v1] Static community detection ... - Complex Networks](https://m.moam.info/img/260x300/inria-00492058-v1-static-community-detection-compl_59eae5901723ddae26000f3d.jpg)