Comp2Watch: Enhancing the Mobile Video Browsing Experience Yu-Ming Hsu
Ming-Kuang Tsai
Yen-Liang Lin
{leafwind, astralbeams, yenliang}@cmlab.csie.ntu.edu.tw
Winston H. Hsu
[email protected]
Communication & Multimedia Lab, National Taiwan University, Taipei, Taiwan
ABSTRACT The mobile devices have been widely spread and become frequently used equipment in daily life. Besides, watching videos on these devices has become a more and more popular activity. However, there are several challenges (e.g., small mobile screen size, low bandwidth, fragmented watching time) hindering mobile video watching: they either interrupt the watching process or limit users to browse many contents at the same time. Traditional video summarization techniques are suffering the small screen issue. Therefore, we propose a system, Comp2Watch which is pronounced like “come to watch”. It implies the meaning of “composing the frames into a collage” and “compressing the watching time”. It puts ROI factors into consideration in order to help users take a quick glance at videos. Also, we modify the cost function to incorporate the templates with variable aspect ratios. We also address the monotone layout problem caused by the limited space. The experimental results show that users can obtain clearer subject without losing many contexts.
Categories and Subject Descriptors H.5.1 [Information Systems]: Multimedia Information Systems
General Terms Algorithms, Experimentation, Human Factors
Keywords Mobile, Video, Summarization, Layout, Adaptation.
1. INTRODUCTION Smart phones have some significant progresses which enabled many things that used to be performed only on the computers. They have already changed the ways of our life. In fact, more and more people are watching videos on mobiles now, and the amount of people who watch videos on mobile devices has been growing rapidly during these past years. The latest report from Nielsen Company [8] shows that the number of Americans watching mobile video has grown more than 40% from 2009 Q4 to 2010 Q4, ending the year at nearly 25 million people. Not only has the popularity grown, the average time that users watching videos on mobile phones has also grown nearly 20% at the same time. At the end of 2010 Q4, people spent 4 hour 20 minutes per month on watching mobile videos in average. We mainly focus on smart phones instead of pad-like computers because they are pocket portable and therefore will be always at hand. However, to the best of our knowledge, there are at least three gaps in mobile video watching: Permission to make digital or hard copies of all or part of this work for personal or classroom use is granted without fee provided that copies are not made or distributed for profit or commercial advantage and that copies bear this notice and the full citation on the first page. To copy otherwise, or republish, to post on servers or to redistribute to lists, requires prior specific permission and/or a fee. IMMPD’11, November 29, 2011, Scottsdale, Arizona, USA. Copyright 2011 ACM 978-1-4503-0995-0/11/11...$10.00.
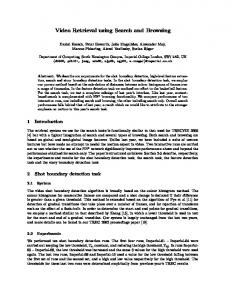
Figure 1. Illustration of baseline (left) and proposed method (right). Applying existing video summarization technique directly on mobile interface which has very limited space may results in some problem. Imagine that putting a huge collage of a video into a smart phone: low zoom level makes the frames unclear, while high zoom level images will occupy lots of spaces. 1. Fragment watching time: Users will not watch mobile videos if there are computers or televisions at hand, the most common situation is that when users have only a small chunk of time (e.g., while waiting for a bus, standing in line at a store, or during daily commute in subway). In these situations, users may not have enough time to watch a complete video, and once the watching process is paused, it will not be easy to get back to the time point where users leave last time. 2. Slow/unstable network: Although online video streaming sites (e.g., Youtube, TED) usually have buffer mechanism to ensure that their videos can be played instantly instead of users’ having to download the whole video clip before watching, users cannot get a quick glimpse of the main idea of the content/story until the video ends or has been played for a while. It is an expensive cost in terms of time and also network bandwidth. 3. The size of mobile display: In fact, the screen resolution of commercial smart phones (e.g., Sony Ericsson XPERIA X12: 854*480, HTC Desire HD: 800*480) has grown to near the resolution of PC’s LCD screens (e.g., XGA standard: 1024*768, WXGA standard: 1280*800). However, when it comes to physical screen size, the smart phones (e.g., Apple iPhone4: 3.5 inch, HTC Desire HD: 4.3 inch) are far behind from PC’s LCD screens (usually more than 20 inch). The comparison above means that smart phones have to put a relatively large content into a tiny space. The detailed illustrations are shown in Figure 2.
Figure 2. Illustration of screen resolution comparison (top) and screen size comparison (right). Mobile screens are in green color, and LCD screens are in blue color.
Figure 3. The ROIs in video frames in talk videos (left) and movie trailers (right). White rectangles indicate ROI boundaries.
2. RELATED WORK In addition, it is known that performing actions like pressing virtual buttons on a touch screen is somehow difficult [6]. It is not surprising that interacting with such screens (e.g., selecting, dragging, or clicking) can be very challenging especially when the content is too large so that it must be scaled down. To handle the first two gaps, we use a collage image composed by selected frames. The time orders of shots are preserved so that it can provide random access via finger click on the touch screen interface on mobiles. It is much more convenient than dragging the timeline beneath the video. Also, downloading a single image instead of the whole video can significantly reduce the network overhead, and taking a glance on the images can enable users to try to get the story in the video or help users to quickly filter out videos which they are not interested in. The advantages above come from the traditional video summarization techniques. However, the most important issue is the small screen property on such mobile platforms (see Figure 1). To bridge this last gap, our intuition is based on the ROI region in the image frame. Figure 3 shows examples of extracted ROI bounding boxes, and we have observed that cropping the ROI regions from the frames has the chance of saving spaces without losing much context information in average cases. The latter user study results support this observation, too. The key contributions of this paper are: 1.
To the best of our knowledge, Comp2Watch represents one of the first attempts that enables video summarization on mobile devices, thus presenting another experience on mobile video watching.
2.
We observed several gaps for mobile video watching and we use ROI extraction to deal with the most challenging one, thus enabling the templates with non-fixed ratio. And the result collage is more compact.
3.
We propose several measurements for Compactness and evaluate them in the quantitative experiments. For user study, we evaluate both Clearness and Context Loss. These experiments show the promising results of the proposed system.
Section 2 lists the related works and points out our differences from them, and the detailed description of our modified method is stated in section 3 and 4. Section 5 shows the experimental results, and section 6 gives a conclusion and possible future works.
We have surveyed some kinds of works which are related to our mobile video summarization. Previous works include automatic collage generation, video summarization based on unlimited space, and mobile photo summarization. Uchihashi, et al. [1] was the first work that attempted to propose a comic-like layout summarization on videos, and their key contributions are maintaining time order and enabling the variable frame size in accordance with the importance of a shot, and we use their work as our baseline. Although we do the similar process for video summarization, we not only transplant it to mobile environment, but also take a detailed observation to analyze what has been changed. In section 1, we described three gaps for mobile video summarization, and the first two gaps do not exist on PC environments, which are strong supports for video summarization on mobile devices; the last gap is the main impedance for such possibility, and we try to settle this problem by introducing ROI extraction. For collage generation, Rother, et al. [2], Lee, et al. [3] and Goferman, et al. [4] have proposed some of the most representative works. [2] formulates the whole procedure into an energy minimization problem, and they also use graph-cut and Poisson blending to assemble a smooth collage. [3] follows a similar process (i.e., image ranking, ROI selection, ROI packing, and finally image blending) to build a collage. The strength of [3] is that it can be run efficiently on a mobile phone processor. Recently, a work that can compose images with arbitrary ROI into a collage has been proposed [4], the result is more compact and interesting because the space can be filled up with arbitrary shapes, while [2] and [3] only handle rectangle ROIs. The main difference of our work from them is that their images have no time order like video shots, while our output collage must be time-ordered, and thus this layout problem cannot be solved by their approaches. Most importantly, they do not take the “smallness issue” (the third gap mentioned above) into consideration since a high-level view of the whole collage is enough for their application.
3. KEYFRAME SELECTION The main difference from [1] in this step is that we put ROI regions into consideration instead of presenting the whole image. Extracting ROI region can not only enable the flexibility on frame aspect ratio but also benefit the compactness on the whole composed image.
First, we apply shot boundary detection on the given videos and choose the middle frame for each shot as the image presentation of the corresponding shot. We then group these shot images by common hierarchical clustering method, using predefined distance threshold (Section 3.1). The importance of each shot will be computed in accordance with shot length, cluster size and ROI ratio to the whole image. Then the importance scores are quantized into certain level to represent the desired template sizes. Finally, we filter out shots that are less important or some shots that are similar within a short period (Section 3.2).
3.1 Shot Detection and Hierarchical Clustering
These importance score will be divided into certain levels during a rough quantization step in order to fit in the pre-defined templates (see Figure 4). During this step, some shots will be filtered out (i.e. set their level to zero) if they are not important enough, and others will be assigned sequentially, see Table 1. The importance level is quantized from the importance score, and it will be used in one of our cost functions, so we set the level equal to the size of its area of desired template. Table 1. The quantization step from importance score to corresponding level and template size, is the importance score of a shot (i.e. !" ), #$% is the average of highest φ importance score of whole video, here we set φ = 5.
For each video, the color histograms of full frames will be extracted for shot detection. We take a common adaptive threshold method: if two adjacent frames or a period of frames are measured to be very different, that will be a shot boundary.
Importance Score
Importance Level
Desires Template Size
I < 1/8 Max
0
N/A
After shot boundaries are detected, we take their middle frame to represent the corresponding shot and use them as a basic unit in the following steps. For simplicity, we refer to “shot images” as “shots” from now on.
1/8 Max < I < 2/8 Max
1
1*1
2/8 Max < I < 3/8 Max
2
1*2
3/8 Max < I < 4/8 Max
4
2*2
4/8 Max < I < 6/8 Max
6
2*3 or 3*2
Then a hierarchical clustering step is conducted. The idea of hierarchical clustering is to merge the two closet clusters iteratively. Here we use both color and PHOG [7] features to ensure that the grouped shots are similar not only in terms of color histogram, but also in edge distribution (i.e., shape).
6/8 Max < I
9
3*3
ROI is further detected for each shot using Harel’s work [5]. The ROI region will be cropped and adapted as the final collage representation. What’s more, ROI information plays an important role both on shot importance re-weighting and on layout optimization phase.
3.2 Importance Computation To utilize the space of output collage, the size of all shots must be differentiated by certain criteria. [1] has defined “importance” as “A shot is important if it is both long and rare.” Thus they formulate the importance as the length of a shot normalized by its cluster size to penalize the repeated but discontinuous nearduplicate shots. Therefore the importance of a shot belongs to cluster is given by: 1 = log (1) Where is the length of the shot , and (the proportion of shots from the video that are in cluster ) can be computed from previous clustering result by: =
∑
4. ROI PACKING The goal of layout packing algorithm is to put all shots into the given two dimensional space with corresponding size (i.e. importance) while preserving their time order. To achieve this goal, one heuristic way is to arrange those shots into a multilayered layout (i.e. the whole space is divided into row blocks, and these row blocks contain sub-templates arranged column by column). Unlike many well studied problems (e.g., bin-packing), such a layout optimization problem that has the above constraints is NPhard. In order to make the solution feasible, [1] proposed a “rowblock-exhaustive” approach (i.e. optimize each row block one by one). The algorithm is listed as follows: 1. 2. 3.
of
templates
Compute the cost of all combinations and find a combination (- that has the lowest cost by: ?@
:
,; < + > A
(4)
Where 3 is the number of shot in combination ( , 7 is the i’th shot frame, ; is the j’th template in sequence combination ( , > is the remaining space in current row, and cCD, E G is the cost function that measure the difference between the target shot frame image and the matched template. 4.
(3)
Where and Area are the pixels of the ROI area of shot and the whole pixels of shot , respectively.
Generate all possible combinations '( , (* , … , for current row block. 1 . = arg min 2 4 56789 3
(2)
is the total length of all shots in cluster , and is the total cluster number. However, we think the importance score should not only reflect the shot length and uniqueness, but also consider ROI propotion on the whole shot; that is, if a shot has a larger ROI region, it should be given a larger template to represent itself (i.e., higher importance score). Therefore we replace the importance by: =
Set the current row block to the top row and the starting shot & = 1.
5.
Apply it to current row block and move to the next row block. & is also increased by the length of the solution.
Repeat 2. until all frames are packed.
For more detailed information, please refer to [1].
The following three subsections describe the key changes we have made in this algorithm to guarantee that it can work well with the extracted ROIs even in an environment that has a limited space: 1.
We enable the templates with non-fixed aspect ratios since the ROI region is extracted.
2.
The cost function has been modified so that it considers not only the importance of a shot, but also its aspect ratio.
3.
Inter-row optimization has been introduced to eliminate the monotone layout combinations.
4.1 Non-fixed Aspect Ratio Templates Unlike the baseline approach, we try to enable more flexible templates instead of fixed aspect ratio templates (See Figure 4). It does not only change the appearance of output collage, but also fit the ROI content to the template as appropriate as it can be.
Our idea is to punish the repeated row sequence in the minimization step, if a row sequence appeared twice, its cost will be multiplied by a coefficient σ, and so on. The minimization criterion is then modified by: .
?@
1 arg min T2 4 56789 3
:
, ; < = > A ∗ U V: W
(6)
Where X is the number of times that a certain solution has appeared continuously. If a solution (i.e. template combination in a row) repeated many times, the algorithm above will tend to use another combination of templates, thus preventing the result collage from having a monotone layout.
5. EXPERIMENTS We collect a total of 32 videos (20 of them are talk videos in TED, 12 of them are popular movie trailers) for the following experiments. The talk dataset and the movie dataset have 156 shots and 42 shots in average, respectively. The talk videos are suitable for summarization on mobile because their duration is usually longer and thus needs random access to recover the watching process if it is interrupted. Additionally, talk videos usually have a clear subject (e.g., speaker, pictures on the slide) so we can extract meaningful and effective ROIs from them. We also include movie trailers that are much more challenging into our experiments in order to evaluate a general situation. Some example shots can be referred in Figure 3.
Figure 4. The templates used in baseline (left) and the templates used in proposed method (right). Such change demonstrates the possibility of non-fixed aspect ratio templates, and they can be extended easily. Given a shot and a template H, the cost function in [1] only measures the difference of size, that is, 8 IJ = |SizeCH N G|. Where O is the “importance level” we have mentioned in Table 1. However, it can be replaced by any measure of difference between the target shot and the available template.
4.2 The Cost Function
Our templates not only have various sizes, but also have various aspect ratios, to fit the shot into templates which have different aspect ratio, the shot ROI is first scaled along the short dimension, and then the ROI region must be extended along the other dimension to prevent distortion. Since we include those regions outside ROI, the unwanted areas will be counted (in pixels) into the cost. Given the scaled region P , the cost function is then modified as: α∗
8 IJ
= β ∗ AreaCH N
PG
(5)
Where α and β are predefined weights and they are fixed.
4.3 Inter-Row Optimization vs. Intra-Row Optimization The baseline approach can produce sufficient/diverse layout combinations on the media whose size (i.e. screen width) is large enough; however, for those mobile devices that have limited screen size, the generated solution (i.e. template combinations) usually lacks variety due to the limited solution space. Therefore, we introduce the inter-row optimization step into the original intra-row optimization.
5.1 Quantitative Evaluation We expect that the proposed method can represent more informative contents while the space consumption remains near to the baseline. Several measurements have been proposed to evaluate our result. First, “ROI Ratio” is defined by: `
_
YZ Y [ \
1 1 4 4 ] ^
a b[ a Y [ \
1 1 4 4 ] ^
(7)
Where ^ is the total number of frames in video , and ] is the total number of videos. Similarly, “Adapted ratio” is given by: `
And “Enlarged ratio” is given by: h3.
i a Y [ \
_
`
cdefgJd
_
1 1 4 4 5 . ] ^
(8)
(9)
5 . is the adjusted scale after adaptation of shot image . Finally “Collage size ratio” is given by: \.. i O Y [ \
`
\.. i 1 4 ] \.. i
jklfl8Jd me8J- ?J
(10)
me8J- ?J \.. i and \.. i are the output collage size generated by proposed method and baseline, respectively. The quantitative results are shown in Table 2. l--enJ
Table 2. Compactness Measurements Result. The first row represents the result of talk videos, and the second row is for the movie trailers. Dataset ROI ratio Talk Movie
36% 38%
Adapted ratio 52% 57%
Enlarged ratio 1.81 1.70
Four questions are listed below: Q1.
Clearness of both approaches.
Collage area ratio 109%
Q2.
The Context Loss in our approach.
Q3.
The impression of templates with non-fixed aspect ratios.
104%
Q4.
The overall rating.
For column 2 and column 3, statistics show that after ROI extraction, more than 60% of the area is cropped out. However, the ROI cannot be directly put into the collage without adaptation due to the aspect ratio. After the adapt step, nearly half of the space in both datasets has been saved. As for the last two columns, it shows that the content in the proposed method can give more clear subjects in the collage than the baseline while using the same space.
5.2 User Study The usability of a summarization system (especially on mobile) is relatively subjective, so we also conduct a user study that includes several aspects to evaluate the proposed method. We have invited 24 people: 15 of them are male, 9 of them are female. Their occupation distribution is: 6 undergraduates, 12 graduates, 4 PhD students, and 2 administrative stuffs. We provide two identical smart phones to conduct this user study: HTC desire with Android 2.2 platform whose resolution is 800*480.
Figure 6. Q1 - The comparison of clearness in bar chart. The first question asks user to evaluate the degree of clearness of the subject in the content, from 1 (not clear) to 4 (very clear). Figure 6 shows the average score among 24 users. The baseline got a score near the borderline, while our approach was scored between “Clear” and “Very clear”.
Figure 7. The result of Q2 in pie chart. The second question is about the loss of context information. Although the proposed method can enlarge the content, it also makes the context cropped, so we are curious about how serious it is. The result (see Figure 7) shows that over half of users think that the context information of proposed method has been affected slightly by cropping ROI, nearly 40% people think that it is not affected, and only 4% (i.e. one person) think that it is seriously affected. Note that the cropping process is harmful for context information in general. However, the effect is not noticeable when such an application is in some environment with a limited space. In comparison with baseline, even though it keeps all context information, it is usually too small to be recognized. Only in some cases (e.g., a big scene that can distinguish the position of the subject) the baseline can maintain enough context information. Figure 5. Illustration of user study. We provide 2 identical smart phones for users (left: baseline, right: proposed).
ROI from consecutive frames to make the ROI more robust, and so on).
6. CONCLUSIONS AND FUTURE WORK This paper proposes a way to treat the video summarization on mobile environment which has limited space. ROI extraction is introduced to make it possible to place the shots on the tiny templates, and several key changes have been proposed (Section 4.1, 4.2, and 4.3) to incorporate with the ROIs, thus improving the experience of watching videos on mobile devices.
Figure 8. The result of Q3 in pie chart. The third question is “Does changing aspect ratio affect your impression or does this arrangement make you uncomfortable?” We propose this question for we are concerned that users may want to stick with the original aspect ratio because they feel that all shots which have the fixed aspect ratio is much more like a video. Yet the result (see Figure 8) shows that nearly 80% people do not care about this issue.
Both the quantitative measure and the user study show that our method has a more clear result while using nearly the same space. The user study also shows that cropping out background (nonROI regions) will not affect the understandability much. The future works may include: Improve ROI extraction for our purpose as it mentioned in the last section, introduce image retargeting to be compared with cropping, and make the UI much more friendly (e.g., providing transcript if any, making the number of shot in a row manually adjustable). We think that these will make our work more robust and reliable.
7. REFERENCES [1] S. Uchihashi, J. Foote, A. Girgensohn, and J. Boreczky. Video Manga: generating semantically meaningful video summaries. In Proc. ACM Multimedia (MM), 1999. DOI= http://dx.doi.org/10.1145/319463.319654 [2] C. Rother, L. Bordeaux, Y. Hamadi, and A. Blake. AutoCollage. In Proc. ACM SIGGRAPH 2006. DOI= http://dx.doi.org/10.1145/1179352.1141965 [3] M. H. Lee, N. Singhal, S. Cho, and In Kyu Park. Mobile Photo Collage. In Computer Vision and Pattern Recognition Workshops (CVPRW), 2010. DOI= http://dx.doi.org/10.1109/CVPRW.2010.5543752 Figure 9. Q4 – Overall rating of both methods in pie chart. The last question asks users to give an overall score for both methods. Although our method gets more “Very good” than baseline (7:4) and also has fewer negative scores (0:4), there are two-thirds of people that think they are both good (See Figure 9). We have concluded some causes from users’ feedback: The movie trailers are more attractive than talk videos, but the ROI extraction cannot give a satisfactory result in many complicated scenes that are mostly from movies. On the other hand, although we can extract effective ROIs from talk videos, they usually have monotone scenes (e.g., a speaker stands in front of a simple background), so the extracted ROI regions are likely to lose the diversity of content (e.g., most of the frames are the face of the speaker). Moreover, the face of the speaker is cropped in some cases. That is why our method does not significantly outperform the baseline in overall rating. From users’ feedback, we think that both of the two cases mainly result from the ROI extraction step. The ROI extraction tool which we used is for general purpose and does not have any adjustment. Thus it can be further improved for the purpose of video summarization (e.g., applying face detection, extracting
[4] S. Goferman, A. Tal, and L. Zelnik-Manor. Puzzle-like Collage. In EUROGRAPHICS, 2010. [5] J. Harel, C. Koch, and P. Perona. Graph-Based Visual Saliency. In Proc. Neural Information Processing Systems (NIPS), 2006. [6] S.C. Lee and S. Zhai. The Performance of Touch Screen Soft Buttons. In Proc. ACM Conference on Human Factors in Computing Systems (CHI), pages 309–318, 2009. DOI= http://dx.doi.org/10.1145/1518701.1518750 [7] A. Bosch, A. Zisserman, and X. Munoz. Representing shape with a spatial pyramid kernel. In Proc. ACM international conference on image and video retrieval (CIVR), 2007. DOI= http://dx.doi.org/10.1145/1282280.1282340 [8] Nielsen Company. State of the Media - Mobile Usage Trends: Q3 and Q4 2010. http://blog.nielsen.com/nielsenwire/online_mobile/numberof-americans-watching-mobile-video-grows-more-than-40in-last-year/