substantially reduce the HIV death toll and new HIV in- fections. ..... (strategy 2) yielded a 27.7% decrease in deaths from HIV ..... Accessed November 2008. 44.
ORIGINAL INVESTIGATION
Comparative Effectiveness of HIV Testing and Treatment in Highly Endemic Regions Eran Bendavid, MD, MS; Margaret L. Brandeau, PhD; Robin Wood, MD; Douglas K. Owens, MD, MS
Background: Universal testing and treatment holds promise for reducing the burden of human immunodeficiency virus (HIV) in sub-Saharan Africa, but linkage from testing to treatment sites and retention in care are inadequate. Methods: We developed a simulation of the HIV epidemic and HIV disease progression in South Africa to compare the outcomes of the present HIV treatment campaign (status quo) with 4 HIV testing and treating strategies that increase access to antiretroviral therapy: (1) universal testing and treatment without changes in linkage to care and loss to follow-up; (2) universal testing and treatment with improved linkage to care; (3) universal testing and treatment with reduced loss to follow-up; and (4) comprehensive HIV care with universal testing and treatment, improved linkage to care, and reduced loss to follow-up. The main outcome measures were survival benefits, new HIV infections, and HIV prevalence.
Results: Compared with the status quo strategy, universaltestingandtreatment(1)wasassociatedwithamean(95% uncertainty bounds) life expectancy gain of 12.0 months (11.3-12.2 months), and 35.3% (32.7%-37.5%) fewer HIV infections over a 10-year time horizon. Improved linkage to care (2), prevention of loss to follow-up (3), and comprehensive HIV care (4) provided substantial additional benefits:lifeexpectancygainscomparedwiththestatusquostrategy were 16.1, 18.6, and 22.2 months, and new infections were 55.5%, 51.4%, and 73.2% lower, respectively. In sensitivity analysis, comprehensive HIV care reduced new infections by 69.7% to 76.7% under a broad set of assumptions. Conclusions: Universal testing and treatment with current levels of linkage to care and loss to follow-up could substantially reduce the HIV death toll and new HIV infections. However, increasing linkage to care and preventing loss to follow-up provides nearly twice the benefits of universal testing and treatment alone.
Arch Intern Med. 2010;170(15):1347-1354
T
Author Affiliations: Division of General Internal Medicine (Dr Bendavid), Center for Health Policy and the Center for Primary Care and Outcomes Research (Drs Bendavid and Owens), and Department of Management Science and Engineering (Dr Brandeau), Stanford University, Stanford, California; Desmond Tutu HIV Centre, Institute of Infectious Disease and Molecular Medicine, Faculty of Health Sciences, University of Cape Town, Cape Town, South Africa (Dr Wood); and Veterans Affairs Palo Alto Health Care System, Palo Alto, California (Dr Owens).
HE HUMAN IMMUNODEFI ciency virus (HIV) epidemic in many sub-Saharan African countries has stabilized in the past few years, with a few countries reporting reductions in incidence, prevalence, and mortality.1-3 However, the epidemic is still an unsustainable and disproportionate challenge to southern Africa, responsible for more than
See Invited Commentary at end of article 20% of adult mortality in some countries, an increasing number of orphans, and possible reversals in economic growth.1,4 Reducing the burden of the epidemic is a major goal of HIV testing and treatment programs, but difficulties in linking infected individuals to treatment sites and retaining them in care, low testing rates, and resource constraints challenge the capacity to achieve universal access.5-9 Recent studies suggest that universal testing and treatment may decrease HIV preva-
(REPRINTED) ARCH INTERN MED/ VOL 170 (NO. 15), AUG 9/23, 2010 1347
lence in highly endemic regions through reduced incidence (infected patients who receive treatment are less likely to infect others), while at the same time markedly reducing HIV mortality.10 This strategy has considerable appeal, and clinical trials looking at the effectiveness of early antiretroviral therapy (ART) for HIV prevention are currently under way.11 However, previous estimates of the benefits of universal testing and treatment did not take into account the poor linkage between testing and treatment sites and the high rates of attrition from care after treatment initiation. Among patients who receive a diagnosis of HIV infection in South Africa, one-third to two-thirds never return for follow-up care.12,13 In addition, many clinics report high rates of loss to follow-up (LTFU)—4% to 39% in a recent systematic review (after accounting for mortality following ART initiation).14 These factors are increasingly recognized as central barriers to scale-up of ART programs in sub-Saharan Africa. Given the limited resources for scaling up HIV testing and treatment in Africa,
WWW.ARCHINTERNMED.COM
©2010 American Medical Association. All rights reserved.
Downloaded From: http://archinte.jamanetwork.com/ on 02/25/2013
assessing the role of improving linkage to care and reducing loss to follow-up is critical. In this study, we assess the epidemiologic and health effects of 4 strategies to increase access to antiretroviral therapy: universal testing and treatment without substantial changes in rates of linkage to care and LTFU; universal testing and treatment with improved linkage to care; universal testing and treatment with reduced LTFU; and comprehensive HIV care with universal testing and treatment, improved linkage to care, and reduced LTFU. METHODS We developed a stochastic HIV disease and transmission model in an adult population similar to that in South Africa, where HIV transmission is predominantly heterosexual. We used the model to evaluate the relative effectiveness of different strategies for scaling up access to ART through expanded testing, improved linkage to care, earlier treatment initiation, and reduced rates of loss to follow-up. The model follows groups of uninfected and HIV-infected individuals over time, and aggregates individual health outcomes as well as epidemiologic measures of HIV burden, such as incidence and prevalence. We designed the model to reflect the current pace of scale-up in South Africa, including the rate of HIV testing, rate of linkage to care, treatment initiation thresholds, and rates of loss to follow-up. We describe the model structure, key assumptions, and the scale-up strategies.
MODEL STRUCTURE The model follows groups of 10 000 individuals representative of the population of South Africa by age, sex, HIV status, circumcision status, and number of sexual partners.15-18 Individuals enter the population at age 15 years and leave the population when they die from HIV or other causes. Baseline demographic parameters are shown in Table 1. The population is followed in 1-month intervals over a period of 10 years, and the health status of individuals is evaluated monthly based on their age, sex, HIV status, and HIV testing and treatment history. Risk factors for infection and disease progression are presented in Table 1 and a supplement (available at the authors’ Web site, http://healthpolicy.stanford .edu/publications/comparative_effectiveness_of_hiv_testing _and_treatment_strategies_in_highly_endemic_regions/ and on request).
HIV INFECTION Human immunodeficiency virus status in the initial time period of the model is determined by current estimates of ageand sex-specific HIV prevalence in South Africa. Individuals who are uninfected may become infected if they have at least 1 HIV-infected sexual partner. The number of sexual partnerships at any point in time is determined by estimates of concurrency in South Africa.20,38 The risk of infection per month is calculated based on the sex of the individual, the number of infected partners, and the viral load of any infected partners. The viral load of infected partners may be either suppressed or elevated, based on the distribution of viral loads in the population. Uninfected partners of individuals who recently seroconverted have a much higher risk of acquiring HIV infection. Risk of infection is reduced for men who are circumcised and for individuals who received HIV counseling. The magnitude of risk reduction is shown in Table 1.
HIV TESTING AND TREATMENT Infected individuals are identified through HIV testing or when they develop a severe opportunistic disease. Individuals who develop a severe opportunistic disease are linked to care and initiate treatment, even if they were lost to care between testing and treatment or lost to follow-up. We assumed that those who are identified through testing are referred to an HIV treatment facility, where they are followed prior to and after starting ART. The imperfect linkage between testing and treatment sites, the treatment initiation criteria, and the LTFU after treatment initiation are shown in Table 2. We assumed that individuals were monitored on average every 6 months for clinical symptoms of disease progression and with CD4 lymphocyte counts. All individuals in our population are eligible to be tested. In the status quo strategy, testing rates reflect the current mix of voluntary testing and counseling or health care provider– initiated testing, while the universal testing and treatment strategies assume that 90% of the population is tested and that individuals undergo testing every 2 years on average. In the status quo strategy, we assumed that 67% of individuals who tested positive for HIV are linked with an HIV treatment facility.39 Without targeting linkage, we assume that this rate of presentation to treatment sites remains unchanged. We used our previous work to model the progress of infected individuals.40,41 Individuals who are linked to a treatment program are monitored regularly to determine the appropriate timing for initiating ART. We assumed that individuals are monitored for clinical signs of advanced disease and CD4 lymphocyte counts to guide timing of treatment initiation. Timing of treatment initiation is a topic of substantial debate42; our status quo strategy estimates reflect current guidelines (Table 2). Finally, we tracked whether individuals remained in treatment over time. We estimated rates of LTFU based on clinical experience from Cape Town but considered the range of reported experience in southern Africa. Base-case estimates of each component of HIV care are shown in Table 2.
STRATEGIES FOR HIV CARE SCALE-UP We projected the course of the epidemic using the status quo strategy and 4 additional strategies of universal testing and treatment. The strategies (Table 2) are as follows: 1. Status quo strategy: The number of people tested for HIV, accessing treatment centers, and starting treatment continues to increase, but the pace of scale-up remains similar to that observed since 2007. 2. Universal testing and treatment: In this strategy, there is a shift from the current rate of testing, in which 18% of the adult population have been tested previously and about 10% of the adult population are tested per year, to a strategy in which 90% of the adult population are tested in the first 2 years, and individuals seek an additional HIV test every 2 years on average. About 67% of those who have positive HIV test results are linked to a treatment facility and start treatment with first-line ART within 6 months after their diagnosis; and about 20% of individuals who start treatment are lost to follow-up in the first year of treatment. Compared with the status quo strategy, this strategy illustrates the benefits of universal testing and treatment with the current approaches to patient linkage and retention in care. 3. Universal testing and treatment with improved linkage to care: This is the same as strategy 2, except that linkage to care is now 100%; that is, every individual who has a positive HIV test result is linked with a treatment facility and starts treatment within 6 months of diagnosis. Rates of LTFU are unchanged.
(REPRINTED) ARCH INTERN MED/ VOL 170 (NO. 15), AUG 9/23, 2010 1348
WWW.ARCHINTERNMED.COM
©2010 American Medical Association. All rights reserved.
Downloaded From: http://archinte.jamanetwork.com/ on 02/25/2013
Table 1. Parameter Estimates and Data Sources Variable
Base Estimate
Demographics Age distribution (% of population), mean (SD) 15-24 y 25-34 y 35-44 y ⬎44 y Age-specific population mortality rate Life expectancy if HIV-uninfected, y Male Female Partnership distribution (No. of annual sexual partners) 0 1 2 3 Proportion circumcised HIV transmission parameters Age-specific prevalence (mean for males and females), rate/sex act 15-24 y 25-34 y 35-44 y ⬎44 y Risk of infection per sex act, by log viral load, % ⬍2.7 copies/mL 2.7-3.48 copies/mL 3.49-4 copies/mL 4.01-4.48 copies/mL ⬎4.48 copies/mL Late-stage AIDS Acute infection Circumcision risk reduction Reduction in sexual activity with HIV counseling, % HIV disease parameters CD4 lymphocyte count in HIV-infected, untreated population, % 0-50 cells/µL 51-200 cells/µL 201-350 cells/µL 351-500 cells/µL ⬎500 cells/µL CD4 lymphocyte count in HIV-uninfected population, cells/µL Viral load in untreated (log10), mean (SD) Probability of changing to second-line ART, mo 12 24 Monthly HIV mortality without ART, by CD4 lymphocyte count, % 0-49 cells/µL 50-99 cells/µL 100-199 cells/µL 200-299 cells/µL 300-399 cells/µL 400-499 cells/µL ⱖ500 cells/µL Monthly HIV mortality with ART, by CD4 lymphocyte count, % 0-49 cells/µL 50-99 cells/µL 100-199 cells/µL 200-299 cells/µL 300-399 cells/µL 400-499 cells/µL ⱖ500 cells/µL
Monthly probability of developing opportunistic diseases by CD4 lymphocyte count, % Oral candidiasis Chronic diarrhea Esophageal candidiasis Wasting syndrome Severe bacterial infection Pulmonary TB Extrapulmonary TB PCP CMV Cryptococcal meningitis
Source US Census Bureau International Database15
33.7 22.3 16.5 29.5 From WHO life tables19
⬍50 Cells/µL
Variable
Range or SD, %
±5 ±5 ±5 ±5 WHO19 US Census Bureau International Database15
62.8 65.3
57.8-67.8 60.3-70.3
36 56 7 1 34
±10 ±10 ±1 ±0.5 17-68
Demographic and Health Survey20
Connolly et al21 Dorrington et al22
12.4 32.7 25.6 8.4
±4 ±4 ±4 ±4
0.0001 0.0011 0.0012 0.0014 0.0023 0.0043 0.0081 55 20
0-4x 0.5-2x 0.5-2x 0.5-2x 0.5-2x 0.5-4x 0.5-4x 40-70
Wawer et al,23 Gray et al,24 Quinn et al25
Auvert et al,26 Bailey et al,27 Gray et al28 Kamb et al29 Williams et al,30 Auvert et al31
10.4 27.2 26.1 17.7 18.6 1000 4.8 (0.85)
±4 ±4 ±4 ±4 ±4 Williams et al30 Badri et al32,33 Orrell et al34
5.4 8.6
5-20 8-30
4.8 1.9 1.5 1.2 1.0 0.8 0.5
0.5-2x 0.5-2x 0.5-2x 0.5-2x 0.5-2x 0.5-2x 0.5-2x
3.2 1.1 0.4 0.2 0.2 0.2 0.1
0.5-2x 0.5-2x 0.5-2x 0.5-2x 0.5-2x 0.5-2x 0.5-2x
51-200 Cells/µL
201-350 Cells/µL
Badri et al36
Lawn et al37
⬎350 Cells/µL
Source Holmes et al35
3.50 2.00 1.46 1.29 1.15 1.15 0.98 0.67 0.52 0.52
2.04 0.49 0.34 0.23 0.04 0.71 0.47 0.05 0.07 0.05
1.26 0.18 0.09 0.02 0.03 0.47 0.18 0.02 0.02 0.00
0.57 0.00 0.06 0.00 0.00 0.11 0.05 0.00 0.00 0.00
Abbreviations: ART, antiretroviral therapy; CMV, cytomegalovirus; HIV, human immunodeficiency virus; PCP, Pneumocystis carinii pneumonia; TB, tuberculosis; x, the range in multiples of the base estimate; WHO, World Health Organization. SI conversion factor: To convert lymphocytes to ⫻109/L, multiply by 0.001.
(REPRINTED) ARCH INTERN MED/ VOL 170 (NO. 15), AUG 9/23, 2010 1349
WWW.ARCHINTERNMED.COM
©2010 American Medical Association. All rights reserved.
Downloaded From: http://archinte.jamanetwork.com/ on 02/25/2013
Table 2. HIV Testing and Treatment Strategies
Scale-up Strategy a
Rate of Testing
Status quo strategy
10% of the population tested per year, with infected individuals twice as likely to seek testing as uninfected individuals; retesting no sooner than every 3 y 90% of the population tested in the first 2 y, and retested every 2 y on average 90% of the population tested in the first 2 y, and retested every 2 y on average 90% of the population tested in the first 2 y, and retested every 2 y on average 90% of the population tested in the first 2 y, and retested every 2 y on average
Test and treat (test and treat)
Test, improve linkage, and treat (test and link and treat) Test, treat, and prevent LTFU (test and treat and LTFU) Comprehensive scale-up
Likelihood of Connection to Care
Criteria for Treatment Initiation
67% of individuals who have a positive HIV test result are monitored for treatment initiation
CD4 lymphocyte count of 200 cells/µL or an AIDS-defining illness
20% of individuals who start treatment are lost to follow-up in the first year of treatment, and treatment stops 3 mo after LTFU
Same as status quo strategy
Within 6 mo after HIV diagnosis
Same as status quo strategy
100% of individuals who have a positive HIV test result are monitored for treatment eligibility Same as status quo strategy
Within 6 mo after HIV diagnosis
Same as status quo strategy
Within 6 mo after HIV diagnosis
No living patients are lost to follow-up in the first year after treatment initiation
Within 6 mo after HIV diagnosis
No living patients are lost to follow-up in the first year after treatment initiation
100% of individuals who have a positive HIV test result are monitored for treatment eligibility
Rate of LTFU
Abbreviations: HIV, human immunodeficiency virus; LTFU, loss to follow-up. SI conversion factor: To convert lymphocytes to ⫻109/L, multiply by 0.001. a The parenthetical label refers to the way the strategy is referenced in Table 3 and Table 4 and the Figures.
4. Universal testing and treatment with prevention of LTFU: This is the same as strategy 2, except that retention in care is 100%. As with strategy 2, 33% of individuals with positive HIV test results are not linked with treatment facilities. 5. Universal testing, improved linkage to care, early treatment, and prevention of LTFU (comprehensive): This includes universal testing, improved linkage to care, early treatment, and prevention of LTFU as noted for strategies 2 to 4. While perfect linkage and retention in care are not likely to be possible, this strategy is illustrative of the maximal benefits of a universal testing and treatment approach.
OUTCOMES MEASURED We measured 2 primary outcomes: gains in life expectancy and reduction in new HIV infections at the end of 10 years compared with the status quo strategy. The former is a measure of health benefits for individuals, whereas the latter is an important determinant of the burden of disease. While the benefits of scaling up HIV care apply most directly to the infected population, the benefits spill over to the uninfected population through reduced HIV transmission. Thus, we measured the gains in life expectancy across the entire population. We estimated 4 other important epidemiologic and health outcomes: reduction in HIV-related deaths, HIV death rates, adult HIV prevalence, and population growth. Life expectancy gains are reported using a 3% discount rate.
SENSITIVITY ANALYSIS Recognizing the challenges in achieving 100% linkage and retention in care, we varied the rates from the status quo levels to perfect linkage and retention and report the results in percentage of improvement over universal testing and treatment without changes to linkage or retention in care. For example, improving linkage from 67% to 90% may provide a 25% greater
improvement in life expectancy compared with universal testing and treatment without improvements in linkage. In probabilistic sensitivity analysis we varied all parameters simultaneously (detailed in the supplement). We drew each input parameter from a random distribution (normal, beta, gamma, or uniform) and repeated the analysis 1000 times. We report the results of this analysis as a 95% uncertainty bound around our estimates. These bounds are reported throughout the “Results” section and in the Tables and Figures. RESULTS
In the status quo strategy, we estimate that the prevalence of HIV in South African adults will decrease from 18.0% to 17.2% over the next decade. This is consistent with current epidemiologic projections and recent trends.43 We estimate the HIV-specific mortality rate in the first year of our analysis to be 1140 deaths per 100 000 individuals older than 15 years, consistent with World Health Organization estimates from vital registration data and demographic projections.22,44 MORTALITY BENEFITS OF TESTING AND TREATMENT STRATEGIES Compared with the status quo strategy, universal testing and treatment alone (strategy 2) was associated with a per-person gain in life expectancy of 12.0 (11.3-12.2) months averaged over the entire population. Universal testing and treatment with improved linkage to care (strategy 3) and prevention of LTFU (strategy 4) were associated with greater life expectancy gains: 16.1 and 18.6 months per person over the entire population, respec-
(REPRINTED) ARCH INTERN MED/ VOL 170 (NO. 15), AUG 9/23, 2010 1350
WWW.ARCHINTERNMED.COM
©2010 American Medical Association. All rights reserved.
Downloaded From: http://archinte.jamanetwork.com/ on 02/25/2013
Table 3. Mortality Benefits of HIV Testing and Treatment Strategies
Scale-up Strategy Status quo strategy Test and treat Test and link and treat Test and treat and LTFU Comprehensive scale-up
Life Gained, per Person, Mo a,b
Reduction in HIV Deaths, % a,b
HIV Death Rate, per 1000 Person-years a
Comparator 12.0 (11.3-12.2) 16.1 (15.4-16.2) 18.6 (17.0-18.9) 22.2 (21.8-22.5)
Comparator 27.7 (24.5-28.3) 43.3 (39.5-45.0) 45.1 (41.2-46.7) 61.6 (58.0-64.8)
11.4 (9.5-12.9) 8.0 (6.6-9.5) 6.2 (5.1-7.5) 6.0 (4.9-7.3) 4.2 (3.2-5.1)
Abbreviations: HIV, human immunodeficiency virus; LTFU, loss to follow-up. a Numbers in parentheses represent 95% uncertainty bounds. b Gains in life expectancy and reduction in deaths among HIV-positive population are compared with the status quo strategy.
19
5000
18 17
HIV Prevalence, %
HIV Deaths, 1000s
4000
3000
2000
1000
16 15 14
Strategy: Status quo Test and treat Test and treat and LTFU Test and link and treat Comprehensive
13 12 11
0 Status Quo
Test and Treat
Test and Link and Treat
Test and Treat and LTFU
Comprehensive
10 0
1
2
3
4
5
6
7
8
9
10
Years
Strategy
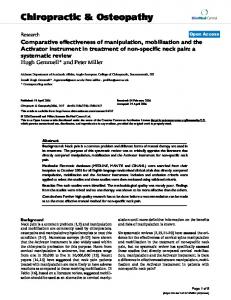
Figure 1. Estimated deaths from human immunodeficiency virus (HIV) over 10 years in South Africa for different HIV testing and treatment strategies. A comparison of the total number of HIV-related deaths over 10 years, by strategy, scaled to South Africa. The error bars represent the 95% confidence bounds from the probabilistic sensitivity analysis. LTFU indicates loss to follow-up.
tively, while comprehensive HIV care (strategy 5) was associated with an average life expectancy gain of 22.2 months per person. Two related events account for the gains in life-years: a decrease in HIV mortality from improved case detection and care, and an increase in the size of the population owing to the decreased mortality in the population of childbearing age. At the end of 10 years, we estimate that the comprehensive strategy resulted in 61.6% fewer deaths from HIV compared with the status quo strategy and an HIV death rate of 415 (318515) per 100 000 person-years, 63.5% lower than the status quo strategy. Universal testing and treatment alone (strategy 2) yielded a 27.7% decrease in deaths from HIV and an HIV mortality rate of 802 (664-948) per 100 000 person-years. The mortality benefits are summarized in Table 3 and Figure 1.
Figure 2. Projected human immunodeficiency virus (HIV) prevalence in South Africa for different HIV testing and treatment strategies. LTFU indicates loss to follow-up.
reduction in deaths may increase the opportunity for individuals to infect others and may increase prevalence, which is in turn a determinant of infection. We estimate the number of new infections in the adult South African population over the next 10 years to be 4.5 (3.8-5.1) million in the status quo strategy, and 1.2 (0.9-1.6) million in a comprehensive strategy, a 73.2% reduction. The decrease in new infections led to reductions in adult HIV prevalence compared with the status quo strategy of 1.6%, 2.5%, 1.9%, and 3.4% with universal testing and treatment alone, universal testing and treatment with improved linkage, universal testing and treatment with reduced LTFU, and the comprehensive strategy, respectively, at the end of 10 years. The reduction in new infections and HIV deaths, especially among individuals of childbearing age, was associated with an increase in the size of the population. We estimated 11.5% population growth over 10 years in the status quo strategy (about 1.1% per year), and 15.2% with universal testing and treatment alone (strategy 2). Figure 2 and Table 4 show the transmission and demographic benefits.
TRANSMISSION BENEFITS OF TESTING AND TREATMENT STRATEGIES
SENSITIVITY ANALYSES
While scaling up HIV care is likely to improve survival of HIV-infected individuals, the effect on HIV transmission and prevalence is less obvious. Increasing treatment coverage may reduce infectivity per coital act. However, the longer survival of HIV-infected individuals and
Figure 3 shows the sensitivity of our results to gradually improving linkage to care and reducing LTFU. The figure shows that even relatively modest improvements in linkage to care and prevention of LTFU provide substantial mortality and prevention benefits. A 10% higher
(REPRINTED) ARCH INTERN MED/ VOL 170 (NO. 15), AUG 9/23, 2010 1351
WWW.ARCHINTERNMED.COM
©2010 American Medical Association. All rights reserved.
Downloaded From: http://archinte.jamanetwork.com/ on 02/25/2013
Table 4. Transmission and Epidemiologic Benefits of HIV Testing and Treatment Strategies a Scale-up Strategy
Reduction in New HIV Infections b
Final Projected Prevalence
Population Growth b,c
Comparator 35.3 (32.7-37.5) 55.5 (51.8-58.2) 51.4 (48.0-54.2) 73.2 (69.7-76.7)
17.2 (17.0-17.5) 15.6 (15.5-15.7) 14.7 (14.6-14.8) 15.3 (15.2-15.4) 13.8 (13.7-14.0)
Comparator 3.7 (3.6-3.9) 5.5 (5.4-5.7) 6.2 (6.0-6.4) 8.2 (7.9-8.3)
Status quo strategy Test and treat Test and link and treat Test and treat and LTFU Comprehensive scale-up
Abbreviations: HIV, human immunodeficiency virus; LTFU, loss to follow-up. a Data are presented as percentage (95% uncertainty bounds). b Population growth represents the growth above the population growth in the status quo strategy (eg, 3.7 means that population growth under such a strategy is 3.7% greater than in the status quo strategy). c Reduction in new HIV infections and growth in population size are compared with the status quo strategy.
A
B Rate of Linkage to Care, % 70
74
77
80
84
87
Rate of Linkage to Care, % 90
93
97
90 Comprehensive Test and treat and LTFU Test and link and treat
80 70
67 42
70
74
18
16
77
80
84
87
90
93
97
100
9 35 8
60
7
50
6
40
5
30
4
20
3
10
2
Absolute, mo
Relative, %
100 10
Additional Reduction, %
67
28 21 14 7
1
0 20
18
16
14
12
10
8
6
4
2
0
0
20
14
Rate of LTFU, %
12
10
8
6
4
2
0
Rate of LTFU, %
Figure 3. Sensitivity analysis of the mortality benefits and reduction in transmission from gradual improvements in linkage to care and prevention of loss to follow-up (LTFU). A, The mortality benefits; B, the reduction in new human immunodeficiency virus (HIV) infections. Each line represents the benefit compared with universal testing and treatment alone. The relative benefits for improved linkage range over 67% to 100% linkage, and for LTFU from 20% to 0% loss. The comprehensive strategy represents simultaneous improvements in linkage and prevention of LTFU. For example, universal testing and treatment with improved linkage to 80% results in a gain of about 2.5 months of life expectancy, or 15% improvement, over universal testing and treatment alone.
linkage and 6% reduction in LTFU (67%-77% and 20%14%, respectively) are associated with life expectancy improvements that are 30% higher than with universal testing and treatment alone. Similar improvements in linkage and prevention of LTFU are associated with 36% fewer HIV infections compared with universal testing and treatment alone. We performed 2-way sensitivity analysis on rates of testing and treatment initiation threshold, which showed that as long as treatment is initiated early, substantial reductions in prevalence and new infections can be accomplished with testing rates as low as 30% to 40% of the population. These results are discussed in the supplement. COMMENT
Our comparative evaluation of the mortality and transmission benefits of scaling up HIV testing and treatment in sub-Saharan Africa provides several important insights. First, universal testing and early treatment alone have important health and epidemiologic benefits, but we estimate that they provide about half of the benefits of a comprehensive scale-up strategy that also includes
improved linkage to care and prevention of loss to followup. Second, the mortality and transmission benefits of scaling up HIV testing and treatment have implications for population growth. Finally, we estimate that even under a strategy of comprehensive HIV care it will take longer than a decade to substantially reduce the burden of South Africa’s widespread epidemic. Our results support the notion that universal testing and treatment have significant mortality benefits in South Africa. Recent estimates from South Africa suggest that ART may prolong life expectancy of infected individuals by 12.5 years.45 We estimate that a comprehensive HIV testing, treatment, and care strategy will increase the average life expectancy of the entire population by 22 months compared with the status quo strategy. From 1990 to 2006, life expectancy in South Africa declined by about 12 years. Scaling up HIV testing and treatment may go a considerable way toward reversing that trend.19 Although a comprehensive plan with perfect linkage and full retention in care is not realistic, it provides an important bound for the possible benefits. However, over a decade, the benefits of universal testing and treatment alone are much lower than the ben-
(REPRINTED) ARCH INTERN MED/ VOL 170 (NO. 15), AUG 9/23, 2010 1352
WWW.ARCHINTERNMED.COM
©2010 American Medical Association. All rights reserved.
Downloaded From: http://archinte.jamanetwork.com/ on 02/25/2013
efits of universal testing and treatment with improved linkage to care and prevention of loss to follow-up. This underscores the role of increasing the number of people who initiate treatment early: each individual who starts treatment early decreases the number of downstream infections by more than 1. Insights from mathematical epidemiology suggest that, in the absence of ART, each individual infected with HIV transmits the infection to more than 1 person, on average, over his or her lifetime. Thus, the benefits of long-term effective ART are multiplied, and so are the losses from having individuals forego ART because of poor linkage to care or LTFU. Despite all these benefits, we find that even under the comprehensive strategy of HIV care, the burden of disease over the next decade is expected to remain substantial. Some researchers suggest that it would take as long as 50 years to reduce HIV prevalence in South Africa to below 1%.10 Our estimates, which include a detailed microsimulation of HIV disease and treatment, demographic changes, and multiple transmission risk factors, agree with these estimates: we show a nearly linear decrease in prevalence of 4.2% over a decade, suggesting that it would take more than 4 decades at the estimated rate of decline to decrease prevalence to around 1%. Our estimates of benefits rely on several important assumptions. Most important, we assumed that HIV transmission risk is reduced for individuals receiving ART. Although much evidence supports this phenomenon, to our knowledge it has not been verified in a major clinical trial to date.46,47 We made several assumptions about the benefits of treatment in South Africa that affect our estimates of the longevity benefits of ART but do not change the comparative effectiveness of the strategies we examined. We also assumed no behavioral risk modification with decreasing disease burden; for example, as HIV mortality and prevalence drop, individuals may perceive the disease as less threatening and increase risk behaviors, such as multiple concurrent partnerships.48 However, we had no basis for assuming the type or extent of behavior risk modification. Finally, we assumed that the fertility rate will remain stable (ie, the number of children per woman will not change over the next decade). A decrease in the fertility rate may slow the decline in prevalence, because the growth in population size will slow down while the number of infected individuals may not change appreciably. Our analysis uses a detailed epidemiologic simulation model to estimate the mortality and transmission benefits of HIV testing, treatment, and care in South Africa and quantifies the comparative effectiveness of alternative strategies for universal testing and treatment. We find that scaling up all aspects of HIV care nearly doubles the benefits of universal testing and treatment alone. An economic and operational evaluation of these strategies would further help in clarifying priorities. Accepted for Publication: February 10, 2010. Correspondence: Eran Bendavid, MD, MS, Division of General Internal Medicine, Stanford University, 117 Encina Commons, Stanford, CA 94305-8526 (ebd@stanford .edu). Author Contributions: Study concept and design: Bendavid, Wood, and Owens. Acquisition of data: Bendavid.
Analysis and interpretation of data: Brandeau and Owens. Drafting of the manuscript: Bendavid and Owens. Critical revision of the manuscript for important intellectual content: Brandeau and Wood. Statistical analysis: Bendavid and Owens. Obtained funding: Owens. Study supervision: Brandeau, Wood, and Owens. Modeling expertise: Brandeau. Financial Disclosure: None reported. Funding/Support: This research is supported in part by the National Institute of Allergy and Infectious Diseases (K01-AI084582), the Department of Veterans Affairs, and the National Institute on Drug Abuse (R01 DA15612). Role of the Sponsors: The funding agencies had no part in the design and conduct of the study; collection, management, analysis, and interpretation of the data; or in the preparation, review, or approval of the manuscript. REFERENCES 1. UNAIDS. Report on the Global AIDS Epidemic. Geneva, Switzerland: Joint United Nations Programme on HIV/AIDS; 2008. 2. UNAIDS. AIDS Epidemic Update. Geneva, Switzerland: Joint United Nations Programme on HIV/AIDS; 2007. 3. Gregson S, Garnett GP, Nyamukapa CA, et al. HIV decline associated with behavior change in eastern Zimbabwe. Science. 2006;311(5761):664-666. 4. Dixon S, McDonald S, Roberts J. The impact of HIV and AIDS on Africa’s economic development. BMJ. 2002;324(7331):232-234. 5. UNAIDS/World Health Organization. Towards Universal Access: Scaling Up Priority HIV/AIDS Interventions in the Health Sector: Progress Report. Geneva, Switzerland: UNAIDS/World Health Organization; 2009. 6. UNAIDS. Financial Resources Required to Achieve Universal Access to HIV Prevention, Treatment, Care and Support. Geneva, Switzerland: UNAIDS; 2007. 7. UNAIDS/World Health Organization. Guidance on Provider-Initiated HIV Testing and Counselling in Health Facilities. Geneva, Switzerland: UNAIDS/World Health Organization; 2007. 8. Stringer JS, Zulu I, Levy J, et al. Rapid scale-up of antiretroviral therapy at primary care sites in Zambia: feasibility and early outcomes. JAMA. 2006;296 (7):782-793. 9. Brinkhof M, Pujades-Rodriguez M, Egger M. Mortality of patients lost to follow-up in antiretroviral treatment programmes in resource-limited settings: systematic review and meta-analysis. PLoS ONE. 2009;4(6):e5790. 10. Granich RM, Gilks C, Dye C, De Cock K, Williams B. Universal voluntary HIV testing with immediate antiretroviral therapy as a strategy for elimination of HIV transmission: a mathematical model. Lancet. 2009;373(9657):48-57. 11. A randomized trial to evaluate the effectiveness of antiretroviral therapy plus HIV primary care versus HIV primary care alone to prevent the sexual transmission of HIV-1 in serodiscordant couples. HIV Prevention Trials Web site. http://www .hptn.org/research_studies/HPTN052.asp. Accessed June 12, 2009. 12. Bassett IV, Giddy J, Wang B, et al. Routine, voluntary HIV testing in Durban, South Africa: correlates of HIV infection. HIV Med. 2008;9(10):863-867. 13. Bassett I, Regan S, Chetty S, et al. Who starts ART in Durban, South Africa? not everyone who should [abstract WEAD102]. Conference of International AIDS Society; July 19-22, 2009; Cape Town, South Africa. 14. Rosen S, Fox MP, Gill CJ. Patient retention in antiretroviral therapy programs in sub-Saharan Africa: a systematic review. PLoS Med. 2007;4(10):e298. 15. US Census Bureau International Data Base. US Census Bureau Web site. http: //www.census.gov/ipc/www/idb/tables.html. Accessed July 15, 2009. 16. Shisana O, Rehle T, Simbayi L, et al. South African National HIV Prevalence, Incidence, Behaviour and Communication Survey: A Turning Tide Among Teenagers? Cape Town, South Africa: HSRC Press; 2008. 17. Parker W, Makhubele B, Ntlabati P, Connolly C. Concurrent Sexual Partnerships Amongst Young Adults in South Africa: Challenges for HIV Prevention Communication. Johannesburg, South Africa: CADRE; 2007. 18. Williams BG, Lloyd-Smith JO, Gouws E, et al. The potential impact of male circumcision on HIV in sub-Saharan Africa. PLoS Med. 2006;3(7):e262. 19. World Health Organization life tables for WHO member states. World Health Organization Web site. http://www.who.int/whosis/database/life_tables/life_tables .cfm. Accessed July 15, 2009,. 20. Demographic and Health Survey, ORC Macro. http://www.measuredhs.com. Accessed May 1, 2010. 21. Connolly C, Simbayi L, Shanmugam R, Nqeketo A. Male circumcision and its re-
(REPRINTED) ARCH INTERN MED/ VOL 170 (NO. 15), AUG 9/23, 2010 1353
WWW.ARCHINTERNMED.COM
©2010 American Medical Association. All rights reserved.
Downloaded From: http://archinte.jamanetwork.com/ on 02/25/2013
22.
23.
24.
25.
26.
27.
28. 29.
30.
31.
32.
33.
34.
lationship to HIV infection in South Africa: results from a national survey in 2002. S Afr Med J. 2009;98(10):789-794. Dorrington R, Johnson L, Bradshaw D, Daniel T. The Demographic Impact of HIV/AIDS in South Africa: National and Provincial Indicators for 2006. Cape Town, South Africa: Centre for Actuarial Research, South African Medical Research Council and Actuarial Society of South Africa; 2006. Wawer MJ, Gray RH, Sewankambo NK, et al. Rates of HIV-1 transmission per coital act, by stage of HIV-1 infection, in Rakai, Uganda. J Infect Dis. 2005; 191(9):1403-1409. Gray RH, Wawer MJ, Brookmeyer R, et al; Rakai Project Team. Probability of HIV-1 transmission per coital act in monogamous, heterosexual, HIV-1discordant couples in Rakai, Uganda. Lancet. 2001;357(9263):1149-1153. Quinn TC, Wawer MJ, Sewankambo N, et al; Rakai Project Study Group. Viral load and heterosexual transmission of human immunodeficiency virus type 1. N Engl J Med. 2000;342(13):921-929. Auvert B, Taljaard D, Lagarde E, Sobngwi-Tambekou J, Sitta R, Puren A. Randomized, controlled intervention trial of male circumcision for reduction of HIV infection risk: the ANRS 1265 Trial. PLoS Med. 2005;2(11):e298. Bailey RC, Moses S, Parker CB, et al. Male circumcision for HIV prevention in young men in Kisumu, Kenya: a randomised controlled trial. Lancet. 2007; 369(9562):643-656. Gray RH, Kigozi G, Serwadda D, et al. Male circumcision for HIV prevention in men in Rakai, Uganda: a randomised trial. Lancet. 2007;369(9562):657-666. Kamb ML, Fishbein M, Douglas JM Jr, et al; Project RESPECT Study Group. Efficacy of risk-reduction counseling to prevent human immunodeficiency virus and sexually transmitted diseases: a randomized controlled trial. JAMA. 1998; 280(13):1161-1167. Williams BG, Korenromp E, Gouws E, Schmid G, Auvert B, Dye C. HIV infection, antiretroviral therapy, and CD4⫹ cell count distributions in African populations. J Infect Dis. 2006;194(10):1450-1458. Auvert B, Males S, Puren A, Taljaard D, Caraël M, Williams B. Can highly active antiretroviral therapy reduce the spread of HIV? a study in a township of South Africa. J Acquir Immune Defic Syndr. 2004;36(1):613-621. Badri M, Lawn SD, Wood R. Utility of CD4 cell counts for early prediction of virological failure during antiretroviral therapy in a resource-limited setting. BMC Infect Dis. 2008;8:89. Badri M, Cleary S, Maartens G, et al. When to initiate highly active antiretroviral therapy in sub-Saharan Africa? a South African cost-effectiveness study. Antivir Ther. 2006;11(1):63-72. Orrell C, Harling G, Lawn SD, et al. Conservation of first-line antiretroviral treatment regimen where therapeutic options are limited. Antivir Ther. 2007;12 (1):83-88.
35. Holmes CB, Wood R, Badri M, et al. CD4 decline and incidence of opportunistic infections in Cape Town, South Africa: implications for prophylaxis and treatment. J Acquir Immune Defic Syndr. 2006;42(4):464-469. 36. Badri M, Lawn SD, Wood R. Short-term risk of AIDS or death in people infected with HIV-1 before antiretroviral therapy in South Africa: a longitudinal study. Lancet. 2006;368(9543):1254-1259. 37. Lawn SD, Little F, Bekker L, et al. Changing mortality risk associated with CD4 cell response to antiretroviral therapy in South Africa. AIDS. 2009;23(3):335342. 38. Pettifor AE, Rees HV, Kleinschmidt I, et al. Young people’s sexual health in South Africa: HIV prevalence and sexual behaviors from a nationally representative household survey. AIDS. 2005;19(14):1525-1534. 39. April M, Walensky R, Chang Y, et al. Trends in HIV testing rates and outcomes in a South African community, 2001-2006: implications for expanded screening policies. In: Conference on Retroviruses and Opportunistic Infections; February 8-11, 2009; Montreal, Quebec, Canada. 40. Bendavid E, Young SD, Katzenstein DA, Bayoumi AM, Sanders GM, Owens DK. Cost-effectiveness of HIV monitoring strategies in resource-limited settings: a Southern African analysis. Arch Intern Med. 2008;168(17):1910-1918. 41. Bendavid E, Wood R, Katzenstein DA, Bayoumi AM, Owens DK. Expanding antiretroviral options in resource-limited settings-a cost-effectiveness analysis. J Acquir Immune Defic Syndr. 2009;52(1):106-113. 42. De Cock KM. Plenary talk. HIV Implementers’ Meeting; June 10, 2009; Windhoek, Namibia. 43. 2008 Report on the global AIDS epidemic: epidemiology information. Joint United Nations Programme on AIDS Web site. http://www.unaids.org/en/KnowledgeCentre /HIVData/GlobalReport/2008/2008_Global_report.asp. Accessed November 2008. 44. WHO Mortality Database. http://www.who.int/healthinfo/morttables/en/. Accessed June 29, 2009. 45. Walensky R, Wolf L, Wood R, et al. When to start antiretroviral therapy in resourcelimited settings. Ann Intern Med. 2009;151(3):157-166. 46. Vernazza P, Hirschel B, Bernasconi E, Flepp M. HIV-positive individuals without additional sexually transmitted diseases (STD) and on effective anti-retroviral therapy are sexually non-infectious. Bulletin des Me´decins Suisses. 2008;89 (5):165-169. 47. Reynolds S, Makumbi F, Kagaayi J, et al. ART reduced the rate of sexual transmission of HIV among HIV-discordant couples in rural Rakai, Uganda. Presented at: Conference on Retroviruses and Opportunistic Infections; February 8-11, 2009; Montreal, Quebec, Canada. 48. Cassell MM, Halperin DT, Shelton JD, Stanton D. Risk compensation: the Achilles’ heel of innovations in HIV prevention? BMJ. 2006;332(7541):605-607.
INVITED COMMENTARY
“A Bird in the Hand . . . ” A Commentary on the Test and Treat Approach for HIV
T
he “test and treat” strategy captured the attention of the HIV world this past year. The premise of this approach is quite simple. Identify and treat most persons living with HIV in a community with antiretroviral therapy, and HIV rates will eventually decrease because lower HIV RNA levels are associated with reduced rates of HIV transmission. Modeling of this approach was put forward by Blower et al1 and Montaner et al2 years ago with little fanfare. However, when Granich et al3 modeled this approach for the South African epidemic and predicted millions of lives saved and transition from an endemic to an elimination phase, a global debate was launched.
The debate is a good one. The South African model is a thought experiment that stimulates a number of key questions. Is it really feasible to test all adults in South Africa yearly? Is it ethical? Are assumptions about the effect of antiretroviral therapy on HIV transmission rates correct? Would risky behavior increase with more widespread use of antiretroviral therapy? Can South Africa afford to do this? Should we consider this strategy in the United States? Will an epidemic of HIV drug resistance explode with this tactic? The exercise of creating a road map for a test and treat strategy for a country such as South Africa shines the headlights on the potholes. One area that clearly needs im-
(REPRINTED) ARCH INTERN MED/ VOL 170 (NO. 15), AUG 9/23, 2010 1354
WWW.ARCHINTERNMED.COM
©2010 American Medical Association. All rights reserved.
Downloaded From: http://archinte.jamanetwork.com/ on 02/25/2013