molecules Article
Comparative Studies of Interactions between Fluorodihydroquinazolin Derivatives and Human Serum Albumin with Fluorescence Spectroscopy Yi Wang 1,2 , Meiqing Zhu 1 , Feng Liu 2 , Xiangwei Wu 1 , Dandan Pan 1 , Jia Liu 1,3 , Shisuo Fan 1 , Zhen Wang 1 , Jun Tang 1 , Risong Na 1,3 , Qing X. Li 4 , Rimao Hua 1, * and Shangzhong Liu 2, * 1
2 3
4
*
Department of Science of Pesticides, School of Resources and Environment, Anhui Agricultural University, No. 130 Changjiang West Road, Hefei 230036, China;
[email protected] (Y.W.);
[email protected] (M.Z.);
[email protected] (X.W.);
[email protected] (D.P.);
[email protected] (J.L.);
[email protected] (S.F.);
[email protected] (Z.W.);
[email protected] (J.T.);
[email protected] (R.N.) Department of Applied Chemistry, China Agricultural University, No. 2 Yuanmingyuan West Road, Beijing 100193, China;
[email protected] Collaborative Innovation Center of Henan Grain Crops, National Key Laboratory of Wheat and Maize Crop Science, College of Plant Protection, Henan Agricultural University, Wenhua Road No. 95, Zhengzhou 450002, China Department of Molecular Biosciences and Bioengineering, University of Hawaii, 1955 East-West Road, Honolulu, HI 96822, USA;
[email protected] Correspondence:
[email protected] (R.H.);
[email protected] (S.L.); Tel./Fax: +86-551-6578-6320 (R.H.); +86-10-6273-1010 (S.L.)
Academic Editor: Bela Torok Received: 9 September 2016; Accepted: 12 October 2016; Published: 14 October 2016
Abstract: In the present study, 3-(fluorobenzylideneamino)-6-chloro-1-(3,3-dimethylbutanoyl)-phenyl2,3-dihydroquinazolin-4(1H)-one (FDQL) derivatives have been designed and synthesized to study the interaction between fluorine substituted dihydroquinazoline derivatives with human serum albumin (HSA) using fluorescence, circular dichroism and Fourier transform infrared spectroscopy. The results indicated that the FDQL could bind to HSA, induce conformation and the secondary structure changes of HSA, and quench the intrinsic fluorescence of HSA through a static quenching mechanism. The thermodynamic parameters, ∆H, ∆S, and ∆G, calculated at different temperatures, revealed that the binding was through spontaneous and hydrophobic forces and thus played major roles in the association. Based on the number of binding sites, it was considered that one molecule of FDQL could bind to a single site of HSA. Site marker competition experiments indicated that the reactive site of HSA to FDQL mainly located in site II (subdomain IIIA). The substitution by fluorine in the benzene ring could increase the interactions between FDQL and HSA to some extent in the proper temperature range through hydrophobic effect, and the substitution at meta-position enhanced the affinity greater than that at para- and ortho-positions. Keywords: synthesis; fluorine; fluorescence quenching; human serum albumin; FDQL
1. Introduction Human serum albumin (HSA) is the most abundant plasma protein in the circulatory system of the human body and contains 585 amino acids. HSA plays a key function in physiological and pharmacological processes. For example, HSA can transport several endogenous and exogenous compounds, like fatty acids, nutrients, steroids, certain metal ions, hormones and drugs, and also significantly affect their biological activity in pharmacology through altering their pharmacokinetic
Molecules 2016, 21, 1373; doi:10.3390/molecules21101373
www.mdpi.com/journal/molecules
Molecules 2016, 21, 1373
2 of 14
properties [1–7]. Binding of drugs to plasma proteins may strongly influence their distribution and elimination [8], for instance, many drug candidates were rendered ineffective due to their unusually high binding affinity to HSA [9–14]. Therefore, investigation of the binding interaction between drugs and HSA is of importance in pharmacology and pharmacodynamics. Molecules 2016, 21, 1373 2 of 14 Heterocyclic structures play a pivotal role in many pharmaceutical, agrochemical, and veterinary elimination [8], for instance, many drug candidates rendered ineffective due tohave their been unusually products, like quinazolines. An increasing numberwere of quinazoline derivatives reported high binding affinity to HSA [9–14]. Therefore, investigation of the binding interaction between drugs to possess antibacterial [15], anticancer [16], antitubercular [17], anti-HIV [18], antifungal [19], and HSA is of importance in pharmacology and pharmacodynamics. analgesic [20], anti-inflammatory [21], anticonvulsant [22], antiparkinson [23], anthelmintic [24], Heterocyclic structures play a pivotal role in many pharmaceutical, agrochemical, and veterinary anti-histaminic [25], and antihypertensive Much attention been products, like quinazolines. An increasingactivities number of[26]. quinazoline derivativeshas have beenfocused reportedon to their structures and bioactivity. Little information is, however, available on the interactions of quinazolines possess antibacterial [15], anticancer [16], antitubercular [17], anti-HIV [18], antifungal [19], analgesic with HSA. Fluorine substituents have often been introduced in[23], developing pharmaceutical products [20], anti-inflammatory [21], anticonvulsant [22], antiparkinson anthelmintic [24], anti-histaminic [25], and antihypertensive [26]. Much attention has been focused on their structures and and agrochemicals to improveactivities the biological activity and metabolism. However, it is hard to estimate bioactivity. Little information is, however, available onathe interactions of quinazolines with designing. HSA. whether the compounds are effective with introducing fluorine substituent by molecule Fluorine substituents often been introduced developing pharmaceutical products and Especially because there ishave no information about the in impact of fluorine substituent position on the agrochemicals to improve the biological activity and metabolism. However, it is hard to estimate interactions between quinazoline derivatives and HSA. whether the compounds are effective with introducing a fluorine substituent by molecule designing. We have previously reported the impact of halogen substituents on the interactions between Especially because there is no information about the impact of fluorine substituent position on the quinazoline derivatives and HSA [27]. In the present study, new 6-chloro-1-(3,3-dimethylbutanoyl)interactions between quinazoline derivatives and HSA. 3-(fluorobenzylideneamino)-phenyl-2,3-dihydroquinazolin-4(1H)-one derivatives (3b–d) We have previously reported the impact of halogen substituents on(FDQL) the interactions between (Scheme 1) were designed their binding interactions to HSA at three temperatures quinazoline derivativesand andsynthesized, HSA [27]. In and the present study, new 6-chloro-1-(3,3-dimethylbutanoyl)were 3-(fluorobenzylideneamino)-phenyl-2,3-dihydroquinazolin-4(1H)-one investigated via fluorescence spectroscopy. The obtained information about the (3b–d) molecular (FDQL) derivatives (Scheme 1) were designed and synthesized, and their binding interactions to HSA at three temperatures interactions, including quenching mechanism, binding mode, binding sites, binding constants, were investigated via fluorescence spectroscopy.ofThe obtained information about the molecularof its thermodynamic parameters, and conformation HSA may offer a better understanding interactions, mechanism, binding substituent sites, bindingonconstants, biological actionincluding in vivo. quenching The influence of the binding positionmode, of fluorine FDQL-HSA thermodynamic parameters, and conformation of HSA may offer a better understanding of its biological interactions was studied under simulated physiological conditions using 3-(benzylideneamino)action in vivo. The influence of the position of fluorine substituent on FDQL-HSA interactions was 6-chloro-1-(3,3-dimethyl-butanoyl)-2-phenyl-2,3-dihydroquinazolin-4(1H)-one as a reference compound. studied under simulated physiological conditions using 3-(benzylideneamino)-6-chloro-1-(3,3-dimethylThe results provide a quantitative understanding of fluorine substitution effects on FDQL-HSA butanoyl)-2-phenyl-2,3-dihydroquinazolin-4(1H)-one as a reference compound. The results provide a interactions to some extent, which couldsubstitution be useful for further design ofinteractions potential biologically active quantitative understanding of fluorine effects on FDQL-HSA to some extent, quinazolinone derivatives. which could be useful for further design of potential biologically active quinazolinone derivatives.
Scheme 1. Synthetic route of 6-Chloro-3-fluorobenzylideneamino-2-phenyl-2,3-dihydroquinazolinScheme 1. Synthetic route of 6-Chloro-3-fluorobenzylideneamino-2-phenyl-2,3-dihydroquinazolin4(1H)-one (FDQL). R = H (3a), (3b),m-F m-F(3c), (3c), o-F o-F (3d). meta; o, ortho; andand F, fluorine. 4(1H)-one (FDQL). R = H (3a), p-Fp-F (3b), (3d).p,p,para; para;m,m, meta; o, ortho; F, fluorine.
2. Results and Discussion
2. Results and Discussion 2.1. Synthesis
2.1. Synthesis
In the previous work, the introduction of t-butylacetyl moieties on quinazolines improved their
In the previous the introduction of t-butylacetyl moieties on quinazolines binding to HSA towork, some extent through hydrophobic action [27]. Thus, based on 3a that wasimproved previously their binding to HSA some extent through hydrophobic Thus, basedofonfluorine 3a thatsubstituents was previously reported, wetodesigned and synthesized compounds action 3b–d to[27]. study the impact on the interactions of HSA and quinazolines. These new compounds have been characterized with NMR and HRMS spectra (see Supplementary Materials).
Molecules 2016, 21, 1373
3 of 14
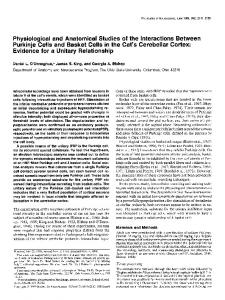
reported, we designed and synthesized compounds 3b–d to study the impact of fluorine substituents on the interactions of HSA and quinazolines. These new compounds have been characterized with NMR and HRMS spectra (see Supplementary Materials). Molecules 2016, 21, 1373 3 of 14 2.2. Fluorescence Quenching Mechanism 2.2. Fluorescence Quenching Mechanism The effect ofof FDQL spectraof ofHSA HSAwas wasfirst firsttested tested with a fluorescence The effect FDQLon onthe thefluorescence fluorescenceemission emission spectra with a fluorescence spectrophotometer, in Figure Figure1.1.This Thisfigure figureclearly clearlydisplays displays that spectrophotometer,and andobtained obtaineddata datawere were plotted plotted in that thethe fluorescence intensity of HSA consistently decreased in the presence of increasing concentration fluorescence intensity of HSA consistently decreased in the presence of increasing concentration of of FDQL due toto fluorescence formationbetween betweenFDQL FDQLand and HSA. FDQL due fluorescencequenching quenchingby byFDQL, FDQL, and and aa complex complex formation HSA.
Figure Fluorescence quenching of of HSA at different concentrations of FDQL at 298 K; ex = Figure 1. 1.Fluorescence quenchingspectra spectra HSA at different concentrations of FDQL at λ298 K; −6 M; C(FDQL)/(×10−6 M), (a–i) 0.000, 1.333, 2.667, 4.000, 5.333, 6.667, 8.000, 280 nm; C(HSA) = 1.0 × 10 − 6 − 6 λex = 280 nm; C(HSA) = 1.0 × 10 M; C(FDQL)/(×10 M), (a–i) 0.000, 1.333, 2.667, 4.000, 5.333, 6.667, 9.333, and 10.667 respectively. 8.000, 9.333, and 10.667 respectively.
In general, the fluorescence of HSA could be dynamically or statically quenched by an organic In general, of HSA could be dynamically statically quenched by an organic compound. Asthe to fluorescence which one works herein, some variable testsorabout temperature, viscosity, and compound. As to were whichemployed one works some variable tests about and lifetime measure andherein, the Stern-Volmer Equations (1) [28]temperature, were used to viscosity, analyze the lifetime measure were employed and the Stern-Volmer Equation of (1)HSA [28] by were used to analyze the data data for determining the mechanism of quenching fluorescence FDQL. for determining the mechanism of quenching fluorescence of HSA by FDQL. F0/F = 1 + KSV [Q] = 1 + Kqτ0 [Q] (1)
F0 /F = 1 + KSVof[Q] = 1without + Kqτ0and [Q] with the quencher, respectively,(1) where F0 and F are the fluorescence intensities HSA KSV is the linear Stern-Volmer quenching constant, Kq is the bimolecular quenching constant, [Q] is where F0 and F are the fluorescence of HSA without and with the quencher, respectively, the concentration of the quencher, τintensities 0 is the average lifetime of the biomolecule in the absence of the KSV is the linear quenching constant, is thewere bimolecular quenching constant, quencher (τ0 = Stern-Volmer 10−8 s−1) [29]. The Stern-Volmer plotKq curves linear with high values, and [Q] the is calculated K SV and Kq at the corresponding temperatures were listed in Table 1. the concentration of the quencher, τ0 is the average lifetime of the biomolecule in the absence of the −8 −1 ) [29]. It is(τ known Stern-Volmer plots indicate onecurves type ofwere quenching predominant, quencher The Stern-Volmer plot linearmechanism with highasvalues, and the 0 = 10thatslinear either static dynamic in Table 1, the valueswere of Kqlisted at different temperatures were much calculated KSVorand Kq at[30]. the Moreover, corresponding temperatures in Table 1. higher the limiting diffusion rate constantplots of biomolecules (kd ≈type 2.0 × of 1010quenching M−1·s−1) [31–34], which It isthan known that linear Stern-Volmer indicate one mechanism revealed static quenching via forming a complex. as predominant, either static or dynamic [30]. Moreover, in Table 1, the values of Kq at different temperatures were much higher than the limiting diffusion rate constant of biomolecules (kd ≈ 2.0 × 10¹⁰ M−1 ·s−1 ) [31–34], which revealed static quenching via forming a complex.
Molecules 2016, 21, 1373
4 of 14
Table 2016, 1. Stern-Volmer quenching constants for interactions of FDQL with HSA at different temperatures. Molecules 21, 1373 4 of 14 −1 interactions 12 M−1 ·s−1 ) Compound T (K)quenching Ra KSVconstants (×104 Mfor ) Kq (×of 10FDQL SD b Table 1. Stern-Volmer with HSA at different temperatures.
2.77 T (K) KSV (×104 M−1) Kq (×10122.77 M−1·s−1) R a0.99916SD b 0.00605 2.98 2.98 0.99898 0.00677 298 2.77 2.77 0.99916 0.00605 3.23 3.23 0.99919 0.00513 R=H 307 2.98 2.98 0.99898 0.00677 298 3.11 3.11 0.99931 316 3.23 3.23 0.99919 0.005130.00451 R = p-F 307 3.25 3.25 0.99933 0.00466 298 3.11 0.99931 0.004510.00453 316 3.523.11 3.52 0.99946 R = p-F 307 3.25 3.25 0.99933 0.00466 298 3.24 3.24 0.99941 0.00436 316 3.52 3.52 0.99946 0.00453 307 3.44 3.44 0.99889 0.00633 R = m-F 298 3.24 0.99941 0.004360.00553 316 3.633.24 3.63 0.99924 R = m-F 307 3.44 3.44 0.99889 0.00633 298 3.30 3.30 0.99973 0.00299 316 3.63 3.63 0.99924 0.005530.00449 307 3.36 3.36 0.99942 R = o-F 298 3.30 0.99973 0.002990.00573 316 3.403.30 3.40 0.99907 307 3.36 3.36 0.99942 0.00449 aRR=iso-F b the correlation coefficient. SD is the standard deviation for the KSV values. 316 3.40 3.40 0.99907 0.00573 R=H
298 Compound 307 316
R is the correlation coefficient. SD is constant the standard for the between KSV values.FDQL and HSA For a complex formation process, the affinity Ka deviation of the binding was analyzed by modified Stern-Volmer Equation (2) [35–37]: For a complex formation process, the affinity constant Ka of the binding between FDQL and HSA was analyzed by modified Stern-Volmer Equation (2) [35–37]: F0 /(F0 − F) = f a − 1 ·Ka −1 ·[Q]−1 + f a −1 (2) F0/(F0 − F) = fa−1·Ka−1·[Q]−1 + fa−1 (2) where f a represents the fraction of accessible fluorescence and Ka is the effective quenching constant. where fa represents the fraction of accessible fluorescence and Ka is the effective quenching constant. F0 /(F0 − F) is linear with the reciprocal value of the quencher concentration [Q], and the slope equals F0/(F0 − F) is linear with the reciprocal value of the quencher concentration [Q], and the slope equals to the value of f a −1 −1 ·K −1 . According to the modified Stern-Volmer Equation, data were calculated to to the value of fa ·Ka a−1. According to the modified Stern-Volmer Equation, data were calculated to obtain the linear plots at different temperatures shown in Figure 2. The corresponding values of Ka obtain the linear plots at different temperatures shown in Figure 2. The corresponding values of Ka in Table 2 showed that the affinity substitutionby byfluorine fluorineatom atomonon the in Table 2 showed that the affinityconstants constantsall allincreased increased after after substitution the benzene ring. benzene ring. a
b
Figure 2. Modified Stern-Volmer plots of FDQL-HSA systems. Figure 2. Modified Stern-Volmer plots of FDQL-HSA systems.
Molecules 2016, 21, 1373
5 of 14
Table 2. Thermodynamic parameters of FDQL-HSA binding systems at different temperatures. Compound
T (K)
Ka (×104 M−1 )
Ra
∆H (kJ·mol−1 )
∆G (kJ·mol−1 )
∆S (J·mol−1 ·K−1 )
R=H
298 307 316
2.16 2.34 2.54
0.99949 0.99969 0.99963
7.14
−24.72 −25.68 −26.65
106.92
R = p-F
298 307 316
2.33 2.59 2.85
0.99945 0.99967 0.99967
8.83
−24.92 −25.93 −26.95
113.24
R = m-F
298 307 316
2.73 2.92 3.10
0.99979 0.99960 0.99967
5.49
−25.31 −26.24 −27.17
103.36
R = o-F
298 307 316
2.46 2.58 2.72
0.99956 0.99949 0.99912
4.50
−25.04 −25.93 −26.83
99.13
a
R is the correlation coefficient.
2.3. Binding Sites and Identification of Binding Sites on HSA For the static quenching process, the number of binding sites can be obtained on the double-logarithmic equation [38–40] lg[(F0 − F)/F] = lgKb + nlg[Q]
(3)
where F0 and F are the fluorescence intensities without and with the ligand, and Kb and n are the binding constant and the number of binding sites, respectively. According to Equation (3), the number of binding sites n can be determined on the slope of a straight line produced by the plots of lg[(F0 − F)/F] versus log[Q]. The data shown in Table 3 demonstrated a good linear relationship and n approximates to 1, indicating that only one site in HSA is reactive to FDQL. Table 3. Binding numbers of FDQL to HSA. Compound
T (K)
n
Ra
SD b
R=H
298 307 316
0.99314 0.98423 0.97492
0.99945 0.99947 0.99928
0.01088 0.01059 0.01220
R = p-F
298 307 316
0.97047 0.98121 0.98160
0.99914 0.99942 0.99947
0.01329 0.01100 0.01054
R = m-F
298 307 316
0.98976 1.00621 0.99960
0.99949 0.99926 0.99942
0.01043 0.01276 0.01126
R = o-F
298 307 316
0.94907 0.97208 0.98093
0.99959 0.99936 0.99884
0.00895 0.01150 0.01562
a
R is the correlation coefficient.
b
SD is the standard deviation for the n values.
HSA is a globular protein composed of three homologous α-helical domains (I–III), and each domain contains two subdomains (A and B). The principal regions of ligand binding sites on HSA locate in hydrophobic cavities in subdomains IIA and IIIA [41]. Sjöholm et al. [42] reported that phenylbutazone (PB), flufenamic acid (FA), and digitoxin (Dig) bind subdomain IIA (site I), subdomain IIIA (site II), and site III, respectively, which were used in the present study as the site markers in competitive experiments to identify the binding sites of FDQL on HSA. The fluorescence quenching data in the presence of site markers were analyzed with the modified Stern-Volmer Equation, and
Molecules 2016, 21, 1373
6 of 14
the values of binding constants listed in Table 4 showed a remarkable decrease after the addition of FA, but relatively small changes after the addition of PB and Dig. Therefore, FDQL would be mainly bound to HSA in site II (subdomain IIIA). Table 4. Effects of the site probe on the binding constants of FDQL to HSA. Compound
Site Marker
Ka (×104 M−1 )
Ra
SD b
R=H
Blank PB FA Dig
2.16 1.88 1.04 2.18
0.99949 0.99962 0.99948 0.99938
0.26651 0.27020 0.25962 0.24163
R = p-F
Blank PB FA Dig
2.33 2.44 2.10 2.43
0.99945 0.99960 0.99976 0.99954
0.23559 0.23309 0.22148 0.20943
R = m-F
Blank PB FA Dig
2.73 2.08 1.65 2.78
0.99979 0.99931 0.99969 0.99955
0.14653 0.26689 0.26159 0.18883
R = o-F
Blank PB FA Dig
2.46 2.25 1.72 2.54
0.99956 0.99922 0.99972 0.99914
0.18871 0.25466 0.22793 0.24946
a
R is the correlation coefficient.
b
SD is the standard deviation for the Ka values.
2.4. Thermodynamic Parameters and Binding Modes The interaction forces between ligands and biomolecules include probably electrostatic interactions, multiple hydrogen bonds, van der Waals force, hydrophobic and steric contacts, and so on [43]. Generally, the signs and magnitudes of the thermodynamic parameters enthalpy change (∆H) and entropy change (∆S) can account for the main forces involved in the binding process. If ∆H does not vary significantly in the temperature range studied, both ∆H and ∆S can be evaluated from the Van0 t Hoff equation: lnKa = −∆H/RT + ∆S/R
(4)
where Ka is analogous to the associative binding constants at the corresponding temperature and R is the gas constant. To elucidate the interaction between FDQL and HSA, the thermodynamic parameters were calculated from the Van0 t Hoff plots (Figure 3). ∆H was calculated from the slope of the Van0 t Hoff relationship. The free energy change (∆G) was then estimated from the following equation: ∆G = ∆H − T∆S
(5)
The negative signs for free energy (∆G) of the FDQL-HSA systems indicated that the interaction processes were spontaneous (Table 2). The signs for ∆H and ∆S of the binding reaction were both found to be positive, which indicated that the binding was mainly entropy-derived and the enthalpy was unfavorable for it, according Ross and Subramanian [44]. Thus, the hydrophobic forces played a major role in the binding process of FDQL to HSA. With use of 3-(benzylideneamino)-6-chloro-1-(3,3-dimethylbutanoyl)-2-phenyl-2,3-dihydro quinazolin-4(1H)-one as a reference compound, the changes of ∆H and ∆S (∆∆H and ∆∆S, respectively) were compared and studied after incorporating different fluorine substituent positions in the benzene ring. The signs of ∆∆H and ∆∆S listed in Table 5 showed that the binding affinity was enhanced by hydrophobic interaction after incorporating para-fluoro atoms, but by van der Waals force after
Molecules 2016, 21, 1373
7 of 14
incorporating meta-fluoro and ortho-fluoro atoms upon on the thermodynamic law summarized by Molecules 21, 1373 7 of 14 Ross and2016, Subramanian.
0 t Hoff Figure 3. 3. Van Van′t Hoff plots plots for for FDQL-HSA FDQL-HSA systems. systems. Figure
Table5. 5. The The values values of of ∆∆H ΔΔH and and ∆∆S ΔΔS in in FDQL-HSA FDQL-HSA systems. systems. Table
Compound R = p-F R = p-F R = m-F R = m-F R = o-F R = o-F
Compound
ΔΔH (kJ·mol−1−)1 ΔΔS (J·mol−1·K−1) −1 −1 ∆∆H (kJ·mol ) ∆∆S (J·mol ·K ) 1.69 6.32 1.69 6.32 −1.65 −3.56 −1.65 −3.56 −2.64 −7.79 −7.79 −2.64
In addition, the data at the corresponding temperature in Table 6 displayed the ΔG changes Inof addition, the of data at the corresponding temperature Table displayed ∆G changes (ΔΔG) interactions FDQL-HSA after incorporating fluorineinatom on6the benzenethe ring. The values (∆∆G) of interactions of FDQL-HSA after incorporating fluorine atom on the benzene ring. The values showed that the ΔΔG changed only slightly as the temperature changed, and the negative sign of showed that thethat ∆∆G changed only slightly as the temperature changed,the andbinding the negative of ΔΔG indicated incorporation of substitution fluorine atom increased affinitysign in the ∆∆G indicated that incorporation of substitution fluorine atom increased the binding affinity in the FDQL-HSA systems. Furthermore, it was found that the meta-fluoro substitution enhanced the FDQL-HSA systems. it was found that the meta-fluoro substitution enhanced the affinity affinity more greatly Furthermore, than that of para-fluoro and ortho-fluoro substitution. more greatly than that of para-fluoro and ortho-fluoro substitution. Table 6. Values of ΔΔG at corresponding temperature in FDQL-HSA systems. Table 6. Values of ∆∆G at corresponding temperature in FDQL-HSA systems. T (K) R = p-F R = m-F R = o-F R = p-F R = m-F R= o-F 298T (K) −0.20 −0.59 −0.32 ΔΔG (kJ·mol−1) 307 298 −0.25−0.20 −0.56 −0.25 −0.59 −0.32 316 307 −0.30−0.25 −0.52 −0.56 −−0.18 0.25 ∆∆G (kJ·mol−1 ) 316
−0.30
−0.52
−0.18
2.5. HSA Conformational Change by CD and FT-IR Measurements 2.5. HSA Conformational Change by CD FT-IR Measurements Currently, CD spectroscopy is aand sensitive technique to provide some information about the secondary structure of proteins. In order to explore any molecular changes of HSA Currently, CD spectroscopy is a sensitive technique to provideconformation some information about the occurring in the binding process, the Far-UV measurements for HSA in the absence and presence secondary structure of proteins. In order to CD explore any molecular conformation changes of HSA of FDQL in were in thethe range of 200–260 nm. The CD spectra of HSA andand FDQL-HSA occurring the carried bindingout process, Far-UV CD measurements for HSA in the absence presence complex Figure 4 which twonm. negative bands in theof UV region 208 nm and of FDQL were wereshown carriedinout in the rangeexhibited of 200–260 The CD spectra HSA andatFDQL-HSA 222 nm, showing characteristic of proteinbands [45]. The intensities of the complex were shown in Figureof4α-helix which structure exhibitedunits two negative in the UV region atnegative 208 nm bands increased with the addition of FDQL without a change in the position and shape of peak. and 222 nm, showing characteristic of α-helix structure units of protein [45]. The intensities of The the calculated results of the fractions ofaddition α-Helix, of β-sheet, Random structures were listed negative bands increased with the FDQLβ-Turn, withoutand a change in Coil the position and shape of in Table 7. These results indicated that the structure of HSA after addition of FDQLs is still peak. The calculated results of the fractions of α-Helix, β-sheet, β-Turn, and Random Coil structures predominantly α-helix. Overall, FDQL-HSA complex forms inofthe solution and the of binding were listed in Table 7. These results indicated that the structure HSA after addition FDQLsprocess is still can induce some secondary structure change complex of HSA. forms in the solution and the binding process predominantly α-helix. Overall, FDQL-HSA can induce some secondary structure change of HSA.
Molecules 2016, 21, 1373 Molecules 2016, 21, 1373
8 of 14
Molecules 2016, 21, 1373
8 of 14
8 of 14
Figure 4. Far-UV CD spectra of the FDQL–HSA system: CHSA = 1 μM and 1 μM HSA + 2 μM FDQL. Figure 4. Far-UV CD spectra of the FDQL–HSA system: CHSA = 1 µM and 1 µM HSA + 2 µM FDQL. Table 7. Conformation changes of the secondary structure HSA with andHSA without FDQL. Figure 4. Far-UV CD spectra of the FDQL–HSA system: CHSA = of 1 μM and 1 μM + 2 μM FDQL. Table 7. Conformation changes of the secondary structure of HSA with and without FDQL.
Secondary Structure (%)
Table 7. Conformation Samplechanges of the secondary structure of HSA with and without FDQL. Secondary Structure (%) α-Helix β-Sheet β-Turn Random Coil Sample Secondary Structure (%) HSA 38.8 23.6 11.0 β-Turn 26.6 Random Coil β-Sheet Sample α-Helix
β-Sheet β-Turn Random 22.7 14.2 27.2 Coil 26.6 23.6 11.0 23.6 11.0 26.6 17.6 17.0 28.6 22.7 14.2 27.2 22.7 14.2 16.3 19.7 28.9 17.6 17.0 27.2 28.6 16.3 19.7 28.6 28.9 17.6 17.0 23.9 12.5 25.5 23.9 12.5 28.9 25.5 16.3 19.7 HSA +was 3d (1:2) 38.0to confirm 23.9 the CD 12.5 FT-IR spectroscopy performed results, and25.5 structural changes of HSA after binding with FDQL were observed with FT-IR (Figure 5). According to the literature [46], FT-IR spectroscopy was performed to confirm the CD results, and structural changes of the HSA −1 reveal FT-IR spectroscopy was performed to confirm the CD results, and structural changes of HSAthe FT-IR spectra for HSA monitored over a range of 1700–1500 cm the presence of two bands, after binding with FDQL were observed with FT-IR (Figure 5). According to the literature [46], −1, mainly −1 after binding with (1700–1600 FDQL werecm observed with FT-IR (Figure According to the (1600–1500 literature [46], the the spectra amide Ifor band C=O and5). the band cmbands, ,a −1amide FT-IR HSA monitored over a range of stretch) 1700–1500 cm revealIIthe presence of two −1 FT-IR spectracoupled for HSAwith monitored over a mode), range ofwhich 1700–1500 cm reveal presencestructure of two bands, C-N stretch N-H −bending are related to thethe secondary of the 1 − 1, a the amide I band (1700–1600 cm −1, mainly C=O stretch) and the amide II band (1600–1500 cm −1, to the amide I band (1700–1600 cm to , mainly C=O stretch) and amide II shifted band (1600–1500 a protein. After addition of FDQLs HSA, the peak position ofthe amide I was from 1652 cm cm−1 C-N stretch coupled with N-H bending mode), which are related to the secondary structure of the −1 to 1513 −1. In addition, C-N coupled bending mode), arecm related to the secondary structure of the 1621 stretch cm−1, and amide with II wasN-H moved from 1541 cmwhich the intensity of the amide −1 to protein. After addition of FDQLs to HSA, the peak position of amide I was shifted from 1652 cm −1 to protein. After addition of FDQLs to HSA, the peak position of amide I was shifted from 1652 cm I and −amide II band decreased and the peak shape changed, indicating that FDQLs interacted with 1 − 1 − 1 1621 cmcm−1, ,and amide II was movedfrom from 1541 cm 1513 to 1513 cm . In addition, the intensity of the 1621 andC-N amide II wasinmoved cm−1 tosubunits. cm−1These . In addition, the intensity the amide the C=O and groups the protein 1541 structural observations jointly of support that amide amide II band decreased and the shape peak shape changed, indicating that FDQLs interacted IFDQLs andI and amide IIinduce band decreased and the peak changed, indicating that FDQLs interacted with could conformational changes in HSA during the binding process, which agreed with with the C=O and C-N groups in the protein structural subunits. These observations jointly support the and groups in the protein structural subunits. These observations jointly support that the C=O results of C-N CD experiments. that FDQLs could induce conformational changes in HSA during the binding process, which with agreed FDQLs could induce conformational changes in HSA during the binding process, which agreed with results of CD experiments. thethe results of CD experiments. HSA + 3a (1:2)
α-Helix 35.8
HSA 38.8 + 3b (1:2) 35.838.8 36.8 HSA + 3aHSA (1:2)HSA HSA + 3a (1:2) 35.8 HSA + 3c HSA + 3b (1:2) 36.8 35.1 HSA + 3cHSA (1:2) + 3b (1:2) HSA + 3d (1:2) 35.136.8 38.0 HSA + 3dHSA (1:2)+ 3c (1:2) 38.035.1
Figure 5. FTIR spectra of free HSA (10 μM) and the FDQL-HSA complex ([FDQL] = 20 μM). Figure 5. FTIR spectra of free HSA (10 μM) and the FDQL-HSA complex ([FDQL] = 20 μM). Figure 5. FTIR spectra of free HSA (10 µM) and the FDQL-HSA complex ([FDQL] = 20 µM).
Molecules 2016, 21, 1373
9 of 14
3. Experimental Section 3.1. General Methods and Materials Melting points were measured with a Fisher-Johns melting point apparatus (Cole-Parmer Co., Shanghai, China) without correction. Nuclear magnetic resonance (NMR) spectra were recorded with a 400-MHz spectrometer (Bruker, Billerica, MA, USA) and 600-MHz spectrometer (Agilent Technologies, Inc., Santa Clara, CA, USA) using tetramethylsilane (TMS) as an internal standard. IR spectra were recorded on a Bruker Tensor 27 (Bruker Optics GmbH, Ettlingen, Germany) in KBr pellets in the range 4000–400 cm−1 . Mass spectra were recorded using an HPLC-1100/TOF MS high resolution mass spectrometer (Agilent Technologies). All fluorescence spectra were measured on a Cary Eclipse fluorescence spectrophotometer (Agilent Technologies) equipped with a thermostat bath. Quartz cuvettes with a 1-cm path length and 3-mL volume were used for all measurements. All pH measurements were completed with a PHS-25 digital pH meter (Shanghai REX Instrument Factory, Shanghai, China). HSA (≥99.9, fatty-acid free), purchased from Sigma-Aldrich (St. Louis, MO, USA), was used without further purification. PB, FA, and Dig were of analytical grade, and purchased from the National Institute for Control of Pharmaceutical and Bioproducts (Beijing, China), and the stock solutions were prepared in absolute ethanol. All other commercial reagents were used as obtained from Sigma-Aldrich, Alfa Aesar (Ward Hill, MA, USA), and J&K (Beijing, China). Flash column chromatography with silica gel was used to purify the crude products. 3.2. Fluorescence Titration Experiments All HSA solutions were prepared in buffer solution (0.1 M Tris base and 0.1 M NaCl at pH 7.4), and the HSA stock solutions were kept in the dark at 4 ◦ C. The solution (3.0 mL) containing 1.0 × 10⁻⁶ M HSA was titrated by successive additions of 8.0 × 10⁻⁴ M ethanol stock solution of FDQL (the final concentration is 1.333–10.667 × 10⁻⁶ M). Titrations were done manually by using trace syringes, and the fluorescence intensity was measured (excitation at 280 nm and emission at 337 nm). All experiments were conducted at three temperatures (298, 307, and 316 K). 3.3. Site Marker Competitive Experiments Binding location studies between FDQL and HSA in the presence of three site makers (phenylbutazone, flufenamic acid, digitoxin) were measured according to the fluorescence titration methods. The concentration of HSA and site makers were all stabilized at 1.0 × 10⁻⁶ M. The solution of FDQL was then gradually added to the phenylbutazone-HSA, flufenamic acid-HSA, or digitoxin-HSA mixtures, and the fluorescence intensity was recorded (λex 280 nm and λem 337 nm). 3.4. Circular Dichroism Spectra Studies The CD measurements were performed on a Jasco-810 spectropolarimeter (Jasco, Japan) at 298 K with a thermostatically controlled cell holder attached to a NeslabRTE-110 water bath with an accuracy of ±0.1 ◦ C. The instrument was sufficiently purged with 99.9% dry nitrogen gas and calibrated with D -10-camphorsulfonicacid before starting the apparatus. Each spectrum was performed with the use of a quartz cuvette of 0.1 cm path length and taken at wavelengths between 200 and 260 nm with 1 nm step resolution and the average of five successive scans recorded at a speed of 50 nm·min−1 and response time of 1 s. All observed CD spectra were baselines subtracted for buffer and the secondary structure was computed using the Jasco standard spectra analysis software package. 3.5. Fourier Transform Infrared (FT-IR) Measurements FT-IR measurements were carried out at room temperature on a Thermo Scientific Nicolet iS50 FTIR spectrometer (Thermo, Tewksbury, MA, USA) equipped with a germanium attenuated total reflection (ATR) accessory. All spectra were taken via 32 scans with a resolution of 4 cm−1 .
Molecules 2016, 21, 1373
10 of 14
The FT-IR spectra of HSA in the absence and presence of FDQL were first collected in the range of 500 cm−1 –4000 cm−1 and the absorbance of the buffer solution (Tris-HCl buffer solution at pH 7.40) was then subtracted. 3.6. Synthesis of (un)Substituted Phenyl-2,3-dihydroquinazolin-4(1H)-one Derivatives FDQL 3a–d Compound 1 and compounds 2a–d were prepared according to the reported methods [47,48]. Their properties were as follows: 2-Amino-5-chlorobenzohydrazide (1): white crystals, yield 85%; m.p. 139.6–140.5 ◦ C; 1 H-NMR (400 MHz, DMSO-d6 ) δ 9.60 (s, 1H), 7.48 (d, J = 2.5 Hz, 1H), 7.16 (dd, J = 8.8, 2.5 Hz, 1H), 6.74 (d, J = 8.8 Hz, 1H), 6.46 (s, 2H), 4.42 (s, 2H). 3-(Benzylideneamino)-6-chloro-2-phenyl-2,3-dihydroquinazolin-4(1H)-one (2a): light yellow solid, yield 75.3%; m.p. 193.5–194.5 ◦ C; 1 H-NMR (400 MHz, Chloroform-d) δ 9.16 (s, 1H), 7.86 (d, J = 2.4 Hz, 1H), 7.61–7.52 (m, 2H), 7.40–7.34 (m, 2H), 7.33–7.22 (m, 6H), 7.21–7.17 (m, 1H), 6.58 (d, J = 8.6 Hz, 1H), 6.21 (s, 1H), 4.82 (s, 1H). 6-Chloro-3-(2-fluorobenzylideneamino)-2-phenyl-2,3-dihydroquinazolin-4(1H)-one (2b): light yellow crystal, yield 63.7%; m.p. 193.3–194.1 ◦ C; 1 H-NMR (400 MHz, Chloroform-d) δ 9.25 (d, J = 1.2 Hz, 1H), 7.85 (d, J = 2.5 Hz, 1H), 7.39–7.32 (m, 2H), 7.29 (d, J = 2.1 Hz, 1H), 7.28–7.23 (m, 5H), 7.19 (d, J = 1.8 Hz, 1H), 7.02–6.96 (m, 1H), 6.59 (d, J = 8.6 Hz, 1H), 6.20 (s, 1H), 4.82 (s, 1H). 6-Chloro-3-(3-fluorobenzylideneamino)-2-phenyl-2,3-dihydroquinazolin-4(1H)-one (2c): light yellow crystal, yield 60.5%; m.p. 204.3–206.1 ◦ C; 1 H-NMR (400 MHz, Chloroform-d) δ 9.13 (s, 1H), 7.91–7.80 (m, 1H), 7.61–7.49 (m, 2H), 7.42–7.30 (m, 2H), 7.31–7.23 (m, 3H), 7.21–7.16 (m, 1H), 7.00–6.92 (m, 2H), 6.64–6.53 (m, 1H), 6.23–6.15 (m, 1H), 4.88–4.77 (m, 1H). 6-Chloro-3-(4-fluorobenzylideneamino)-2-phenyl-2,3-dihydroquinazolin-4(1H)-one (2d): white crystal, yield 65.3%; m.p. 200.1–202.0 ◦ C; 1 H-NMR (400 MHz, Chloroform-d) δ 9.32 (s, 1H), 7.90–7.85 (m, 1H), 7.73 (td, J = 7.5, 1.8 Hz, 1H), 7.38–7.31 (m, 2H), 7.28–7.24 (m, 4H), 7.20–7.16 (m, 2H), 7.05–6.95 (m, 2H), 6.58 (d, J = 8.6 Hz, 1H), 6.23 (d, J = 1.9 Hz, 1H), 4.86 (s, 1H). For the preparation of compounds 3a–d, the corresponding compound 2 (3 mmol) in anhydrous tetrahydrofuran (30 mL) was cooled to 0 ◦ C with an ice bath, and sodium hydride (3.6 mmol) was added. The mixture was stirred for 0.5 h at 0 ◦ C followed by another 1.0 h at room temperature. tert-Butylacetyl chloride (3.6 mmol) in anhydrous tetrahydrofuran (5 mL) was added slowly at 0 ◦ C in 0.5 h, and then the mixture was stirred again at room temperature overnight. The solvent was removed under vacuum, and the residue was then purified by flash chromatography using hexane and ethyl acetate (v/v = 6:1) as the eluent to obtain the title compounds. 3-(Benzylideneamino)-6-chloro-1-(3,3-dimethylbutanoyl)-2-phenyl-2,3-dihydroquinazolin-4(1H)-one (3a): white solid, yield 49.5%; m.p. 149.5–150.8 ◦ C; 1 H-NMR (600 MHz, DMSO-d6 ) δ 9.17 (s, 1H), 7.81 (m, 4H), 7.61 (s, 2H), 7.52–7.41 (m, 3H), 7.33–7.13 (m, 5H), 2.67 (s, 2H), 0.95 (s, 9H); 13 C-NMR (151 MHz, DMSO-d6 ) δ 171.56, 158.59, 152.50, 136.82, 136.54, 134.42, 133.39, 131.45, 130.95, 129.34, 129.27, 129.02, 128.16, 128.01, 127.57, 126.33, 125.90, 44.73, 32.14, 29.86; HRMS: m/z calc for C27 H26 ClN3 O2 [M + H]+ 460.1786, found 460.1776 6-Chloro-1-(3,3-dimethylbutanoyl)-3-(2-fluorobenzylideneamino)-2-phenyl-2,3-dihydroquinazolin-4(1H)-one (3b): white solid, yield 53.3%; m.p. 172.2–173.0 ◦ C; 1 H-NMR (600 MHz, DMSO-d6 ) δ 9.17 (s, 1H), 7.96–7.66 (m, 4H), 7.61 (s, 2H), 7.52–7.38 (m, 1H), 7.37–7.11 (m, 6H), 2.79–2.57 (m, 2H), 0.95 (s, 9H); 13 C-NMR (151 MHz, DMSO-d ) δ 171.56, 158.55, 136.83, 130.50, 130.44, 129.36, 129.28, 129.03, 128.17, 6 126.33, 125.85, 116.55, 116.40, 44.72, 39.76, 32.14, 29.86; IR (v·cm−1 ): 3677.1, 2958.4, 1891.5, 1670.9, 1603.8, 1511.2, 1371.9, 1315.9, 1233.3, 1164.6, 839.6, 768.9, 755.1, 700.0, 594.9, 540.1; HRMS: m/z calc for C27 H25 ClFN3 O2 [M + H]+ 478.1692, found 478.1680.
Molecules 2016, 21, 1373
11 of 14
6-Chloro-1-(3,3-dimethylbutanoyl)-3-(3-fluorobenzylideneamino)-2-phenyl-2,3-dihydroquinazolin-4(1H)-one (3c): white solid, yield 50.9%; m.p. 114.2–116.0 ◦ C; 1 H-NMR (600 MHz, DMSO-d6 ) δ 9.20 (s, 1H), 7.81 (s, 2H), 7.71–7.55 (m, 4H), 7.54–7.44 (m, 1H), 7.38–7.10 (m, 6H), 2.67 (m, 2H), 0.95 (s, 9H); 13 C-NMR (151 MHz, DMSO-d6 ) δ 171.56, 158.69, 150.38, 137.05, 136.87, 133.51, 131.46, 131.41, 129.32, 129.28, 129.04, 128.15, 128.05, 127.61, 126.31, 125.77, 124.54, 118.20, 118.06, 114.09, 113.94, 47.77, 44.73, 32.13, 29.85; IR (v·cm−1 ): 3430.0, 2957.5, 1693.5, 1668.1, 1479.5, 1421.4, 1359.6, 1278.3, 1232.0, 1146.0, 755.9, 704.9, 542.2; HRMS: m/z calc for C27 H25 ClFN3 O2 [M + H]+ 478.1692, found 478.1677. 6-Chloro-1-(3,3-dimethylbutanoyl)-3-(4-fluorobenzylideneamino)-2-phenyl-2,3-dihydroquinazolin-4(1H)-one (3d): white solid, yield 56.3%; m.p. 148.0–149.1 ◦ C; 1 H-NMR (600 MHz, DMSO-d6 ) δ 9.56 (s, 1H), 7.99–7.86 (m, 1H), 7.84–7.66 (m, 2H), 7.62 (s, 2H), 7.54 (m, 1H), 7.47 (m, 1H), 7.34–7.15 (m, 6H), 2.67 (s, 2H), 0.96 (s, 9H); 13 C-NMR (151 MHz, DMSO-d6 ) δ 171.57, 162.43, 160.76, 159.08, 158.58, 145.92, 136.78, 134.42, 133.54, 131.46, 129.35, 129.31, 129.27, 129.07, 128.16, 128.02, 127.59, 127.12, 126.33, 126.27, 125.77, 125.51, 125.49, 122.05, 116.71, 116.57, 44.73, 32.10, 29.86, 29.82; IR (v·cm−1 ): 3423.2, 2962.9, 1670.1, 1481.4, 1431.8, 1359.8, 1125.8, 830.8, 755.8, 596.9; HRMS: m/z calc for C27 H25 ClFN3 O2 [M + H]+ 478.1692, found 478.1682. 4. Concluding Remarks In summary, interactions of four FDQLs with HSA have been studied with fluorescence spectroscopy, CD, and FT-IR experiments. The experimental results indicated that the FDQL could bind to HSA in the site II (subdomain IIIA), induce conformation and the secondary structure changes of HSA and quench the intrinsic fluorescence of HSA through a static quenching mechanism. The quenching of HSA fluorescence takes place with 1:1 complex formation between FDQL and HSA. In the complex formation between HSA and FDQL, hydrophobic forces play a significant role. The studies of the FDQL-HSA interactions showed that substitution of a fluorine atom on the benzene ring could enhance the binding affinity through the steric and hydrophobic effects; specifically, meta-fluoro substitution enhanced the binding affinity most greatly by hydrophobic interaction. This study has provided some valuable information for further research into the rational design of this series of compounds. As the functions of the same substituent in aromatic compounds are relatively consistent and stable, the obtained results about varying fluorine substitution positions are hopefully valuable for guiding molecular design and modification of benzene rings. Supplementary Materials: Supplementary materials can be accessed at: http://www.mdpi.com/1420-3049/21/ 10/1373/s1. Acknowledgments: This work was performed in part by the National High Technology Research and Development Program of China (2013AA102804B), the National Natural Science Foundation of China (NSFC) (No. 31601657, 31272062, 31572033 and 21602043), the Anhui Agricultural University Youth Fund Project (2014zr003, yj2015-25), the Performance Project of Key laboratory of Anhui Province (1506c085006), the Natural Science Foundation of Anhui Province of China (1408085MKL36), and the Foundation for the Excellent Youth Scholars of Anhui Province (2013SQRL016ZD). Author Contributions: This research was carried on by all authors. Y. Wang, R. Hua, and S. Liu designed the theme of the study as well as manuscript preparation. M. Zhu, F. Liu, X. Wu, D. Pan, J. Liu, S. Fan, Z. Wang, J. Tang, and R. Na participated in the synthesis of compounds and fluorescence experiments. Q.X. Li contributed to data interpretation and manuscript revision. Conflicts of Interest: The authors declare no conflict of interest.
References 1.
2.
Kandagal, P.B.; Ashoka, S.; Seetharamappa, J.; Shaikh, S.M.T.; Jadegoud, Y.; Ijare, O.B. Study of the interaction of an anticancer drug with human and bovine serum albumin: Spectroscopic approach. J. Pharm. Biomed. Anal. 2006, 41, 393–399. [CrossRef] [PubMed] Wu, S.; Liu, Y.; Liu, S. Spectroscopic studies on the interaction of human serum albumin and water-soluble carboxyl carbon nanotubes. Spectrosc. Spect. Anal. 2016, 36, 1109–1115.
Molecules 2016, 21, 1373
3.
4.
5.
6.
7. 8.
9. 10.
11.
12.
13.
14. 15.
16. 17. 18. 19.
20.
21.
12 of 14
Ma, X.; Yan, J.; Xu, K.; Guo, L.; Li, H. Binding mechanism of trans-n-caffeoyltyramine and human serum albumin: Investigation by multi-spectroscopy and docking simulation. Bioorg. Chem. 2016, 66, 102–110. [CrossRef] [PubMed] Rohacova, J.; Marin, M.L.; Miranda, M.A. Complexes between fluorescent cholic acid derivatives and human serum albumin. A photophysical approach to investigate the binding behavior. J. Phys. Chem. B 2010, 114, 4710–4716. [CrossRef] [PubMed] Housaindokht, M.R.; Rouhbakhsh Zaeri, Z.; Bahrololoom, M.; Chamani, J.; Bozorgmehr, M.R. Investigation of the behavior of hsa upon binding to amlodipine and propranolol: Spectroscopic and molecular modeling approaches. Spectrochim. Acta A Mol. Biomol. Spectrosc. 2012, 85, 79–84. [CrossRef] [PubMed] Ding, F.; Zhang, L.; Diao, J.; Li, X.; Ma, L.; Sun, Y. Human serum albumin stability and toxicity of anthraquinone dye alizarin complexone: An albumin-dye model. Ecotoxicol. Environ. Saf. 2012, 79, 238–246. [CrossRef] [PubMed] Ding, F.; Peng, W. Biophysical evaluation of protein structural flexibility for ligand biorecognition in solid solution. Phys. Chem. Chem. Phys. 2016, 18, 6595–6606. [CrossRef] [PubMed] Alam, P.; Abdelhameed, A.S.; Rajpoot, R.K.; Khan, R.H. Interplay of multiple interaction forces: Binding of tyrosine kinase inhibitor nintedanib with human serum albumin. J. Photochem. Photobiol. B 2016, 157, 70–76. [CrossRef] [PubMed] Liu, X.; Du, Y. Study on the binding of chiral drug duloxetine hydrochloride to human serum albumin. Eur. J. Med. Chem. 2010, 45, 4043–4049. [CrossRef] [PubMed] Abdollahpour, N.; Asoodeh, A.; Saberi, M.R.; Chamani, J. Separate and simultaneous binding effects of aspirin and amlodipine to human serum albumin based on fluorescence spectroscopic and molecular modeling characterizations: A mechanistic insight for determining usage drugs doses. J. Lumin. 2011, 131, 1885–1899. [CrossRef] Wang, T.; Xiang, B.; Wang, Y.; Chen, C.; Dong, Y.; Fang, H.; Wang, M. Spectroscopic investigation on the binding of bioactive pyridazinone derivative to human serum albumin and molecular modeling. Colloids Surf. B Biointerfaces 2008, 65, 113–119. [CrossRef] [PubMed] Gao, W.; Li, N.; Chen, G.; Xu, Y.; Chen, Y.; Hu, S.; Hu, Z. Binding studies of costunolide and dehydrocostuslactone with hsa by spectroscopy and atomic force microscopy. J. Lumin. 2011, 131, 2063–2071. [CrossRef] Bijari, N.; Shokoohinia, Y.; Ashrafi-Kooshk, M.R.; Ranjbar, S.; Parvaneh, S.; Moieni-Arya, M.; Khodarahmi, R. Spectroscopic study of interaction between osthole and human serum albumin: Identification of possible binding site of the compound. J. Lumin. 2013, 143, 328–336. [CrossRef] Afrin, S.; Riyazuddeen; Rabbani, G.; Khan, R.H. Spectroscopic and calorimetric studies of interaction of methimazole with human serum albumin. J. Lumin. 2014, 151, 219–223. [CrossRef] Mabkhot, Y.N.; Al-Har, M.S.; Barakat, A.; Aldawsari, F.D.; Aldalbahi, A.; Ul-Haq, Z. Synthesis, anti-microbial and molecular docking studies of quinazolin-4(3H)-one derivatives. Molecules 2014, 19, 8725–8739. [CrossRef] [PubMed] Ghorab, M.M.; Alsaid, M.S.; Al-Dosari, M.S.; El-Gazzar, M.G.; Parvez, M.K. Design, synthesis and anticancer evaluation of novel quinazoline-sulfonamide hybrids. Molecules 2016, 21, 189. [CrossRef] [PubMed] Yadav, R.R.; Khan, S.I.; Singh, S.; Khan, I.A.; Vishwakarma, R.A.; Bharate, S.B. Synthesis, antimalarial and antitubercular activities of meridianin derivatives. Eur. J. Med. Chem. 2015, 98, 160–169. [CrossRef] [PubMed] Wang, Z.; Wang, M.; Yao, X.; Li, Y.; Tan, J.; Wang, L.; Qiao, W.; Geng, Y.; Liu, Y.; Wang, Q. Design, synthesis and antiviral activity of novel quinazolinones. Eur. J. Med. Chem. 2012, 53, 275–282. [CrossRef] [PubMed] Farghaly, T.A.R.; Edrees, M.M.; Mosselhi, M.A. Synthesis, tautomeric structure and antimicrobial activity of 3-arylhydrazono-4-phenyl-[1,2,4]-triazepino[2,3-a]quinazoline-2,7(1h)-diones. Molecules 2012, 17, 8483–8493. [CrossRef] [PubMed] Abdel-Aziz, A.A.M.; Abou-Zeid, L.A.; ElTahir, K.E.H.; Mohamed, M.A.; Abu El-Enin, M.A.; El-Azab, A.S. Design, synthesis of 2,3-disubstituted 4(3H)-quinazolinone derivatives as anti-inflammatory and analgesic agents: Cox-1/2 inhibitory activities and molecular docking studies. Bioorg. Med. Chem. 2016, 24, 3818–3828. [CrossRef] [PubMed] Abdel-Aziz, A.A.M.; Abou-Zeid, L.A.; El Tahir, K.E.H.; Ayyad, R.R.; El-Sayed, M.A.A.; El-Azab, A.S. Synthesis, anti-inflammatory, analgesic, cox-1/2 inhibitory activities and molecular docking studies of substituted 2-mercapto-4(3H)-quinazolinones. Eur. J. Med. Chem. 2016, 121, 410–421. [CrossRef] [PubMed]
Molecules 2016, 21, 1373
22. 23.
24. 25.
26. 27.
28. 29. 30. 31. 32.
33. 34.
35.
36.
37. 38. 39.
40.
41. 42.
13 of 14
Georgey, H.; Abdel-Gawad, N.; Abbas, S. Synthesis and anticonvulsant activity of some quinazolin-4-(3H)-one derivatives. Molecules 2008, 13, 2557–2569. [CrossRef] [PubMed] Khattab, S.N.; Haiba, N.S.; Asal, A.M.; Bekhit, A.A.; Amer, A.; Abdel-Rahman, H.M.; El-Faham, A. Synthesis and evaluation of quinazoline amino acid derivatives as mono amine oxidase (mao) inhibitors. Bioorg. Med. Chem. 2015, 23, 3574–3585. [CrossRef] [PubMed] Dahiya, R.; Kumar, A.; Yadav, R. Synthesis and biological activity of peptide derivatives of iodoquinazolinones/nitroimidazoles. Molecules 2008, 13, 958–976. [CrossRef] [PubMed] Alagarsamy, V.; Sharma, H.K.; Parthiban, P.; Singh, J.C.H.; Murugan, S.T.; Solomon, V.R. Cheminform abstract: 4-(3-Methoxyphenyl)-1-substituted-4H-[1,2,4]triazolo [4,3-a]quinazolin-5-ones: New class of h 1-antihistaminic agents. Cheminform 2009, 40, 5–9. [CrossRef] Bandurco, V.T.; Wong, E.M.; Levine, S.D.; Hajos, Z.G. Antihypertensive pyrrolo[1,2-c]quinazolines and pyrrolo[1,2-c]quinazolinones. J. Med. Chem. 1981, 24, 1455–1460. [CrossRef] [PubMed] Liu, F.; Wang, Y.; Lv, C.; Wang, L.; Ou, J.; Wang, M.; Liu, S. Impact of halogen substituents on interactions between 2-phenyl-2,3-dihydroqulinazolin-4(1H)-one derivatives and human serum albumin. Molecules 2012, 17, 2000. [CrossRef] [PubMed] Lakowicz, J.R. (Ed.) Mechanisms and dynamics of fluorescence quenching. In Principles of Fluorescence Spectroscopy; Springer: Boston, MA, USA, 2006; pp. 331–351. Lakowicz, J.R.; Weber, G. Quenching of fluorescence by oxygen. Probe for structural fluctuations in macromolecules. Biochemistry 1973, 12, 4161–4170. [CrossRef] [PubMed] Papadopoulou, A.; Green, R.J.; Frazier, R.A. Interaction of flavonoids with bovine serum albumin: A fluorescence quenching study. J. Agric. Food Chem. 2005, 53, 158–163. [CrossRef] [PubMed] Ware, W.R. Oxygen quenching of fluorescence in solution: An experimental study of the diffusion process. J. Phys. Chem. 1962, 66, 316–320. [CrossRef] Chaves, O.A.; Amorim, A.P.O.; Castro, L.H.E.; Sant0 Anna, C.M.R.; de Oliveira, M.C.C.; Cesarin-Sobrinho, D.; Netto-Ferreira, J.C.; Ferreira, A.B.B. Fluorescence and docking studies of the interaction between human serum albumin and pheophytin. Molecules 2015, 20, 19526–19539. [CrossRef] [PubMed] Cacita, N.; Nikolaou, S. Studying the interaction between trinuclear ruthenium complexes and human serum albumin by means of fluorescence quenching. J. Lumin. 2016, 169, 115–120. [CrossRef] Cheng, X.; Fan, X.; Jiang, F.; Liu, Y.; Lei, K. Resonance energy transfer, ph-induced folded states and the molecular interaction of human serum albumin and icariin. Luminescence 2015, 30, 1026–1033. [CrossRef] [PubMed] Niu, M.; Hong, M.; Chang, G.; Li, X.; Li, Z. A comparative study of cytotoxicity and interaction with DNA/protein of five transition metal complexes with schiff base ligands. J. Photochem. Photobiol. B 2015, 148, 232–341. [CrossRef] [PubMed] Zhang, W.; Zhang, Q.; Wang, F.; Yuan, L.; Xu, Z.; Jiang, F.; Liu, Y. Comparison of interactions between human serum albumin and silver nanoparticles of different sizes using spectroscopic methods. Luminescence 2015, 30, 397–404. [CrossRef] [PubMed] Cheng, Z.; Liu, R.; Jiang, X.; Xu, Q. The interaction between cepharanthine and two serum albumins: Multiple spectroscopic and chemometric investigations. Luminescence 2014, 29, 504–515. [CrossRef] [PubMed] Trivedi, V.D.; Vorum, H.; Honore, B.; Qasim, M.A. Molecular basis of indomethacin-human serum albumin interaction. J. Pharm. Pharmacol. 1999, 51, 591–600. [CrossRef] [PubMed] Cui, F.; Fan, J.; Li, J.; Hu, Z. Interactions between 1-benzoyl-4-p-chlorophenyl thiosemicarbazide and serum albumin: Investigation by fluorescence spectroscopy. Bioorg. Med. Chem. 2004, 12, 151–157. [CrossRef] [PubMed] Tang, K.; Qin, Y.; Lin, A.; Hu, X.; Zou, G. Interaction of daunomycin antibiotic with human serum albumin: Investigation by resonant mirror biosensor technique, fluorescence spectroscopy and molecular modeling methods. J. Pharm. Biomed. Anal. 2005, 39, 404–410. [CrossRef] [PubMed] Cheng, F.; Wang, Y.; Li, Z.; Dong, C. Fluorescence study on the interaction of human serum albumin with bromsulphalein. Spectrochim. Acta A Mol. Biomol. Spectrosc. 2006, 65, 1144–1147. [CrossRef] [PubMed] Sjöholm, I.; Ekman, B.; Kober, A.; Ljungstedt-Påhlman, I.; Seiving, B.; Sjödin, T. Binding of drugs to human serum albumin: Xi. The specificity of three binding sites as studied with albumin immobilized in microparticles. Mol. Pharmacol. 1979, 16, 767–777. [PubMed]
Molecules 2016, 21, 1373
43. 44. 45. 46.
47. 48.
14 of 14
Leckband, D. Measuring the forces that control protein interactions. Annu. Rev. Biophys. Biomol. Struct. 2003, 29, 1–26. [CrossRef] [PubMed] Ross, P.D.; Subramanian, S. Thermodynamics of protein association reactions: Forces contributing to stability. Biochemistry 1981, 20, 3096–3102. [CrossRef] [PubMed] Kelly, S.M.; Jess, T.J.; Price, N.C. How to study proteins by circular dichroism. Biochim biophys acta. Biochim. Biophys. Acta 2005, 1751, 119–139. [CrossRef] [PubMed] Yue, Y.; Sun, Y.; Dong, Q.; Liu, R.; Yan, X.; Zhang, Y.; Liu, J. Interaction of human serum albumin with novel imidazole derivatives studied by spectroscopy and molecular docking. Luminescence 2016, 31, 671–681. [CrossRef] [PubMed] Sircar, J.C.; Capiris, T.; Kesten, S.J.; Herzig, D.J. Pyrazolo[5,1-b]quinazolin-9-ones: A new series of antiallergic agents. J. Med. Chem. 1981, 24, 735–742. [CrossRef] [PubMed] Fulop, F.; Simeonov, M.; Pihlaja, K. Formation of 1,2-dihydroquinazolin-4(3H)-ones. Reinvestigation of a recently reported 1,3,4-benzotriazepine synthesis. Tetrahedron 1992, 48, 531–538. [CrossRef]
Sample Availability: Samples of the compounds are available from authors. © 2016 by the authors; licensee MDPI, Basel, Switzerland. This article is an open access article distributed under the terms and conditions of the Creative Commons Attribution (CC-BY) license (http://creativecommons.org/licenses/by/4.0/).