Comparative study of project-based learning and traditional lecturetutorial teaching approaches in undergraduate engineering courses Kali Prasad Nepal Victoria University, Melbourne, Australia
[email protected] Kriengsak Panuwatwanich Griffith University, Gold Coast, Australia
[email protected] Abstract: Project and/or problem based learning has been widely recognised as active, collaborative, cumulative and integrative learning approach that engages learners and centres on practical education. However, its widespread implementation in engineering curricula at Australian universities has not been realised due to a number of issues including resources required for large classes, teaching staff’s reluctance to embrace it and students’ learning styles, beliefs and expectations. On the other hand, traditional lecture-tutorial teaching approach is also criticised for being passive, surface learning and exam-focused. This study compares the data from students’ actual performance, course evaluation and expectation in two large undergraduate courses over the last two years. This study is interesting in that both courses were taught by the same teaching staff using entirely two different learning and teaching approaches to the same cohort of students in the same semester within the same degree program. The analysis shows that there are significant differences between students’ actual performance, course evaluation and expectation. Such conflicting differences might have negative impact on teaching staff who wish to adopt project and/or problem based learning in their undergraduate engineering courses.
Introduction Project and/or problem based learning has been widely recognised as active, collaborative, cumulative and integrative learning approach that engages learners and centres on practical education (Mills & Treagust 2003, Gibson 2003, Birch 1986,). In this paper, PBL refers to blended project-based and problem-based learning where a set of small-scale problems collectively form the components of a large scale project. Such PBL approach has at least two important advantages over standalone problem-based learning and project-based learning for engineering education. First, the project and its tasks (i.e., the problems) are closer to the engineering professional reality. Second, students learn both the acquisition of knowledge from problem-based approach and the application of knowledge from project-based approach (Mills and Treagust, 2003) as students have the opportunity to put together the jigsaw that is their learning from the apparently disparate pieces they have collected throughout the course (Johns-Boast and Patch, 2010). As a result many universities offering engineering programs across the globe are engaging with PBL as a preferred form of learning. In Australia, Engineers Australia (EA), accreditation body for Australian engineering programs, prefers engineering curricula to be designed around Stage 1 Competencies (Engineers Australia, 2011) for professional engineers and that the development of these competencies will dictate the type of delivery mode for course contents; PBL being an obvious choice to achieve such competencies at both the undergraduate and postgraduate levels (Ribeiro and Mizukami, 2005). However, widespread implementation of PBL approach in engineering programs at Australian universities has not been realised due to a number of issues including resources required for large classes, teaching staff’s reluctance to embrace it and students’ learning styles, beliefs and expectations. On the other hand, traditional lecture-tutorial teaching approach is also criticised for being passive, surface learning and exam-focused.
Proceedings of the 2011 AAEE Conference, Fremantle, Western Australia, Copyright © KP Nepal & K Panuwatwanich, 2011
351
The benefits of PBL approach over traditional lecture-tutorial based approach for engineering education are well documented (e.g., Birch 1986, PBLE 2003, Gibson 2003) but the success of PBL approach and the strategies to make PBL successful in engineering classrooms are not clear-cut. It is because there are insufficient studies to clarify the underlying reasons and establish the interactions between teaching staffs and students. This study compares the data from students’ actual performance, course evaluation and expectation in two large-sized (>61 students) undergraduate courses over the last two years. Note that Griffith University considers the class of more than 61 students as large class in its formal course and teaching evaluation and this study uses this classification. The comparative results are used to identify the likely impacts on teaching staffs while implementing PBL course compared to traditional lecture-tutorial course. This study is interesting in that both undergraduate civil engineering courses were taught by the same teaching staff using entirely two different learning and teaching approaches (PBL and traditional lecture-tutorial) to the third year students in the second semester of the Bachelor of Civil Engineering program.
Research method Literature synthesis has confirmed that the student factors, such as students’ self-directed learning readiness, willingness to study in a team, method used to allocate individual marks from a team mark etc., play an important role for implementing PBL approach in engineering courses successfully (Nepal & Stewart 2010, Nepal & Jenkins 2011, Nepal 2011). This study aims to look in broader terms whether there are discrepancies between students’ actual performance, course evaluation and expectation that may affect the interests of teaching staff to favour PBL approach over traditional lecture-tutorial approach. For this, a controlled environment was set up by keeping teaching staff, classroom environment, class size, study program, year level and study semester constant. Data on students’ actual performance, course evaluation and expectation were collected from two third year second semester Bachelor of Civil Engineering courses taught by a teaching staff to the same student cohort over the last two years (2009 and 2010). The actual course performance data was collected from university database, the course evaluation data was extracted from standard university online course evaluation database and students’ expectation and preference of the courses were collected using a simple questionnaire survey. An ethical clearance was granted from Griffith University to conduct the questionnaire surveys. The data was analysed to identify the discrepancies between students’ performance, course evaluation and expectation. The results are used to draw likely impacts on teaching staff’s interests in adopting PBL approach in their undergraduate engineering courses.
Data analysis and results Data Profile PBL course offered to third year second semester Bachelor of Civil Engineering program had 118 students in year 2009 and 139 students in year 2010. This was the only PBL course in the whole program and the students had no prior PBL experience leading to this course. The course learning and teaching activities included 2 hours of brief lecture for the whole class, 2 hours of consultation workshop in a group of half the class and 2 hours of computer laboratory in a sub-group of 30 students every week in both 2009 and 2010. It makes the actual contact hours for the teaching staff of about 1416 hrs/week and much more hours for outside classroom consultations. The assessment items included both team-based assessment items (3 items of 90% weight in 2009 and 2 items of 40% weight in 2010) and individual-based (1 item of 10% weight in 2009 and 3 items of 60% weight in 2010) assessment items. It is important to note here that there is a significant weight variation in team-based and individual-based assessment items in 2010 compared with those in 2009. This is an intentional variation to observe the impact of the amount of team-based assessment items in students’ performance, course evaluation and expectation. Students were allowed to choose their study team of 4 members by themselves and all members of a team participated in the same lecture, workshop and computer laboratory classes. There were no supervised exams and all pieces of assessment items were parts of an overall civil engineering design project involving urban subdivision design and design of a connecting road including drainage structures. Fifty-nine (59) students completed the standard
Proceedings of the 2011 AAEE Conference, Fremantle, Western Australia, Copyright © KP Nepal & K Panuwatwanich, 2011
352
university course evaluation questionnaire in 2009 (response rate of 50%) and 50 students completed in 2010 (response rate of 35.97%). Fifty-nine (59) students completed the additional voluntary in-class questionnaire regarding their preferences and expectations of courses in 2009 (response rate of 50%) and 40 students completed in 2010 (response rate of 28.78%). Lecture-tutorial course offered to third year second semester Bachelor of Civil Engineering degree program had 81 students in year 2009 and 62 students in year 2010. Students were experienced with this type of course delivery method. As it was a discipline-based elective course, fewer students were enrolled in this course than in the PBL course. The weekly course learning and teaching activities included 2 hours of lectures and 2 hours of tutorial sessions for the whole class in both 2009 and 2010 amounting 4 hrs/week of direct contact time for teaching staff. The assessment items included only individual-based items including 1 assignment (20% weight) and two supervised exams (a midsemester exam of 20% weight and a final exam of 60% weight) in both subsequent years. Forty-three (43) students completed the standard university course evaluation questionnaire in 2009 (response rate of 53.09%) and 25 students completed in 2010 (response rate of 40.32%). Since the course was offered in the tradition lecture-tutorial teaching approach, no further questionnaire survey was run for this course.
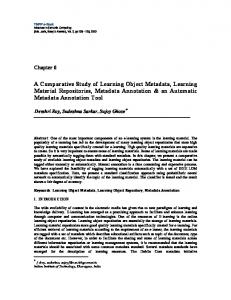
Course performance Criteria-referenced assessment system was used for all assessment items of both PBL and lecturetutorial courses in both 2009 and 2010. Figure 1 shows the students’ actual performance in both the PBL course and the traditional lecture-tutorial course in 2009. It is clearly evident that the students’ overall performance is comparatively better in PBL course (almost 63% of students received better than “P” grade) than in traditional lecture-tutorial course (only about 42% students received better than “P” grade). Similarly, only about 5% of the students did not pass the PBL course compared to 21% of those who did not pass the traditional lecture-tutorial course. To summarise, the overall result of the same cohort of students in the PBL course is better than that of the traditional lecture-tutorial course. Students actual performances PBL course (2009) Traditional lecture-tutorial course (2009) 31.36 34.57
50
2.54 6.17
2.54
14.81
17.28
25.42
0.85 2.47
10
14.81
30 20
26.27
40
11.02 9.88
Percent (%) of total enrollment
60
0 HD
D
C
P
PC
F
Others
Students' final grade
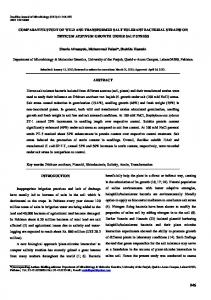
Figure 1 Students’ actual performances in 2009 The performance results for the same courses in 2010 are plotted in Figure 2. Similar to those in 2009, the students performed better in the PBL course (about 50% students received better than “P” grade) than in the traditional lecture-tutorial course (only about 42% of students received better than “P” grade). More students failed the PBL course in 2010 than in 2009 (about 12% of the students did not pass PBL course in 2010 compared with only 5% in 2009). However, the traditional lecture-tutorial course recorded decreased failure rate in 2010 compared with 2009. Since both the PBL and the traditional lecture-tutorial courses had the same student cohort in a particular year, the higher failure rate in PBL course in 2010 than in 2009 can only be linked to the weight of team-based assessment items (90% in 2009 and only 40% in 2010). It is clearly evident from the results that the students who did not contribute to the team project (i.e., the free riders) benefited from the heavily weighted team-
Proceedings of the 2011 AAEE Conference, Fremantle, Western Australia, Copyright © KP Nepal & K Panuwatwanich, 2011
353
based assessment items of the PBL course in 2009.
PBL course (2010) Traditional lecture-tutorial course (2010)
60
9.68 1.44
10
7.19
20
16.55 11.29
30
10.79 8.06
26.62 25.81
40
30.22
40.32
50
7.19 4.84
Percent (%) of total enrollment
Students actual performances
0 HD
D
C P Students' final grade
PC
F
Others
Figure 2 Students’ actual performances in 2010
Course evaluation Figure 3 shows the students’ evaluation of both the PBL course and the traditional lecture-tutorial course in 2009. It shows that only about 36% of respondents evaluated the PBL course being better than average whereas about two-third (68%) of the respondents evaluated the traditional lecturetutorial course being better than average. Similarly, about 22% of the respondents evaluated the PBL course being worse than average whereas only about 7% of the respondents evaluated the traditional lecture-tutorial course being blow average. Students evaluation of the courses 70
44.19
50
Students' evaluation of the courses
1.69 Unacceptable
3.39 Very Poor
Poor
Average
6.98
16.95
18.64 Good
0
Very Good
10
3.39 6.98
20
13.56 16.28
30
25.58
40
Excellent
Percent (%) of respondents
60
42.37
PBL course (2009) (response rate: 50%) Traditional lecture-tutorial course (2009) (response rate: 53.09%)
Figure 3 Students’ evaluation of the courses in 2009 There are significant improvements in student evaluation in 2010 compared with in 2009 for both courses as shown in Figure 4. Still, the traditional lecture-tutorial course is comparatively better preferred by respondents (80% respondents evaluated the traditional lecture-tutorial course being better than average where as only 60% respondents evaluated the PBL course being better than average). Similarly, only 4% of the respondents evaluated the traditional lecture-tutorial course being worse than average whereas 22% respondents evaluated PBL course being worse than average.
Proceedings of the 2011 AAEE Conference, Fremantle, Western Australia, Copyright © KP Nepal & K Panuwatwanich, 2011
354
Students evaluation of the courses
Very Poor
Unacceptable
4.00
6.00
12.00 4.00 Poor
Average
Good
0
Very Good
10
8.00
20
18.00 16.00
30
28.00 24.00
24.00 24.00
32.00
PBL course (2010) (response rate: 35.97%) Traditional lecture-tutorial course (2010) (response rate: 40.32%)
Excellent
Percent (%) of respondents
40
Students' evaluation of the courses
Figure 4 Students’ evaluation of the courses in 2010
Expectation and preference Further, to compare the PBL course with the traditional lecture-tutorial course, the students were asked whether they would prefer lecture-tutorial course over PBL course. The majority of the students preferred the PBL approach (72.9% in 2009 and 70% in 2010) and remaining (27.1% in 2009 and 30% in 2010) preferred traditional lecture-tutorial approach (Figure 5). Whilst about one-third of respondents preferred a traditional assessment approach, more than 80% respondents have admitted that PBL approach has improved their job readiness. It shows that at least 1 in 10 respondents would prefer to go for the traditional-lecture tutorial course in spite of their beliefs that PBL course would help them to get a job. Students stated preferences and expectations 100.0% 15.5%
20.0%
Percent (%)
80.0% 60.0%
70.0%
72.9% 11.6%
10% 84.5%
40.0%
80.0%
20.0%
No Yes
30.0%
27.1% 0.0% Would you have preferred to do traditional lecturetutorial course instead of PBL course?
Do you believe PBL course has improved your job readiness?
2009 (response rate: 50%)
Would you have preferred to do traditional lecturetutorial course instead of PBL course?
Do you believe PBL course has improved your job readiness?
2010 (response rate: 29%)
Figure 5 Students’ stated preferences and expectations
Discussions The results of the previous section seem to clearly show that students’ actual course performance and course evaluation do not align in the same direction. Since the students’ actual performance and their
Proceedings of the 2011 AAEE Conference, Fremantle, Western Australia, Copyright © KP Nepal & K Panuwatwanich, 2011
355
course evaluation were similar in both 2010 and 2009, it can be concluded that the majority of students do not consider their final grades or results in their evaluations. This may be because students evaluate course based on (i) the amount of efforts they need to put into it to successfully complete the course rather than the final marks or grades they receive, and (ii) the difficulties they may face while working in teams and following a self-directed learning approach. Unfamiliarity and the lack of prior experience with such a large scale open-ended PBL project where the requirements, processes and outcomes are not fixed may be feared by some engineering students who prefer structured approaches to achieving solutions. Another possible reason for such results can be the timing of the course evaluation surveys. Since the confidential student evaluation surveys were conducted during the final weeks of study semester (Week 11- Week 13) when students had heavy workload to complete the PBL projects, students might have felt that the traditional lecture-tutorial course that had final exam in weeks’ time was not in their minds. However, opposite to their course evaluation, the majority of students seem to prefer PBL approach to study engineering design courses in line with their course performance. They also believe that PBL approach can better prepare them for future engineering jobs. To summarise, the results of this study clearly show that there are significant differences among students’ actual performance, course evaluation and expectation. In spite of investing more time and effort, these differences may adversely affect the teaching staff’s motivation to introduce and to strengthen PBL approach in engineering curricula. Since many universities in Australia consider student evaluation of the course as one of the key performance criteria for promoting and awarding academic staffs, it is difficult for teaching staffs to stick with PBL approach and to help student engage in deep and active learning. To make PBL approach a part of undergraduate engineering program, it may be required to change the current student evaluation practice. It can be done by either by treating course evaluation separately or by adjusting the timing of the evaluation surveys.
References Birch, W. (1986). Towards a model for problem-based learning. Studies in Higher Education, 11, pp. 73-82. Engineers Australia (2011) Australian engineering www.engineersaustralia.org.au on 20/07/2011)
competency
standards
(retrieved
online
from
Gibson, I.S. (2003). From solo-run to mainstream thinking: project-based learning in engineering design. European Journal of Engineering Education, 28, pp. 331-337. Johns-Boast, L. and Patch, G. (2010). A win-win situation: Benefits of industry-based group projects. Proceedings of the 2010 AaeE Conference, Sydney. pp. 355-360. Mills, J.E. and Treagust, D.F. (2003). Engineering education – is problem-based or project-based learning the answer? Australasian Journal of Engineering Education, 11, pp. 2-16. Nepal, K. P. and Stewart, R. A. (2010) Relationship between self directed learning readiness factors and learning outcomes in third year project-based engineering design course. Proceedings of the 2010 AaeE Conference, Sydney. pp. 496-503. Nepal, K.P. (2011). An approach to assign individual marks from a team mark: the case of Australian grading system at universities. Assessment and evaluation in higher education, iFirst Article. Nepal, K.P. and Jenkins, G.A. (2011). Blending project-based learning and traditional lecture-tutorial-based teaching approaches in engineering design courses, manuscript for AaeE 2011 conference PBLE (2003). A guide to learning engineering through projects. Fund for the Development of Teaching and Learning. Project Based Learning in Engineering, Accessed at www.pble.ac.uk on 20 July 2011. Ribeiro, L.R.C. and Mizukami, M.G.N. (2005). Problem-based learning: a student evaluation of an implementation in postgraduate engineering education. European Journal of Engineering Education, 30, pp. 137–149.
Copyright statement Copyright © 2011 K.P. Nepal & K. Panuwatwanich: The authors assign to AaeE and educational non-profit institutions a nonexclusive licence to use this document for personal use and in courses of instruction provided that the article is used in full and this copyright statement is reproduced. The authors also grant a non-exclusive licence to AaeE to publish this document in full on the World Wide Web (prime sites and mirrors) on CD-ROM or USB, and in printed form within the AaeE 2011 conference proceedings. Any other usage is prohibited without the express permission of the authors.
Proceedings of the 2011 AAEE Conference, Fremantle, Western Australia, Copyright © KP Nepal & K Panuwatwanich, 2011
356