PHYSICS OF PLASMAS 15, 023501 共2008兲
Comparative study of two- and three-dimensional modeling on arc discharge phenomena inside a thermal plasma torch with hollow electrodes Keun Su Kim,a兲 Jin Myung Park,b兲 Sooseok Choi, Jongin Kim,c兲 and Sang Hee Hongd兲 Department of Nuclear Engineering, Seoul National University, Seoul 151-742, Republic of Korea
共Received 6 August 2007; accepted 15 November 2007; published online 12 February 2008兲 A comparative study between two- and three-dimensional 共2D and 3D兲 modeling is carried out on arc discharge phenomena inside a thermal plasma torch with hollow electrodes, in order to evaluate the effects of arc root configuration characterized by either 2D annular or 3D highly localized attachment on the electrode surface. For this purpose, a more precise 3D transient model has been developed by taking account of 3D arc current distribution and arc root rotation. The 3D simulation results apparently reveal that the 3D arc root attachment brings about the inherent 3D and turbulence nature of plasma fields inside the torch. It is also found that the constricted arc column near the vortex chamber plays an important role in heating and acceleration of injected arc gases by concentrating arc currents on the axis of the hollow electrodes. The inherent 3D nature of arc discharge is well preserved inside the cathode region, while these 3D features slowly diminish behind the vortex chamber where the turbulent flow begins to be developed in the anode region. Based on the present simulation results, it is noted that the mixing effects of the strong turbulent flow on the heat and mass transfer are mainly responsible for the gradual relaxation of the 3D structures of plasma fields into the 2D axisymmetric ones that eventually appear in the anode region near the torch exit. From a detailed comparison of the 3D results with the 2D ones, the arc root configuration seems to have a significant effect on the heat transfer to the electrode surfaces interacting with the turbulent plasma flow. That is, in the 2D simulation based on an axisymmetric stationary model, the turbulence phenomena are fairly underestimated and the amount of heat transferred to the cold anode wall is calculated to be smaller than that obtained in the 3D simulation. For the validation of the numerical simulations, calculated plasma temperatures and axial velocities are compared with experimentally measured ones, and the 3D simulation turns out to be more accurate than the 2D simulation as a result of a relatively precise description of the turbulent phenomena inside the torch using a more realistic model of arc root attachment. Finally, it is suggested that the 3D transient formulation is indeed required for describing the real arc discharge phenomena inside the torch, while the 2D stationary approach is sometimes useful for getting practical information about the time-averaged plasma characteristics outside the torch because of its simplicity and rapidness in computation. © 2008 American Institute of Physics. 关DOI: 10.1063/1.2825670兴 I. INTRODUCTION
In recent years, thermal plasmas generated by nontransferred dc plasma torches with hollow electrodes, schematically shown in Fig. 1, have made a success of various practical applications in material and environmental industries by taking advantage of their high enthalpy and temperature, which are unobtainable from conventional combustive torches.1–11 Moreover, the dc plasma torches of hollow electrodes type have an advantage over those of rod-nozzle electrodes type in generating versatile thermal plasmas. First, any kind of gases including oxidizing ones like air and steam can be used as a plasma forming gas. Consequently, the gena兲
Present address: Department of Chemical Engineering, Université de Sherbrooke, Blvd. de l’Université, Sherbooke, Canada J1K 2R1. Electronic mail:
[email protected]. b兲 Present address: Experimental Plasma Physics, Fusion Energy Division, Oak Ridge National Laboratory, Oak Ridge, TN 37831. c兲 Present address: LCD R & D Center, Samsung Electronics Co. Ltd., Yongin, Korea. d兲 Electronic mail:
[email protected]. 1070-664X/2008/15共2兲/023501/13/$23.00
erated plasma jets can supply a large amount of oxygen species, such as O, O+, and O2, which are essential not only for synthesizing various new functional materials, but also for decomposing organic waste into combustible gases like CO and CO2.8,9 Second, the arc gas injection into the hollow electrodes torch is different from the rod-nozzle one, as depicted in Fig. 1. Arc gases are injected radially inward through a gap between the two hollow electrodes, and then the injected gases change their flow direction abruptly along the axial direction after impinging on the arc column. This fluid dynamic condition usually intensifies the turbulent nature of the generated plasma inside the cylindrical hollow electrodes, and thereby enhances mixing of the thermal plasma jet with the reactants introduced into it in the exterior region of the torch. Lastly, the hollow electrodes torch can generate the plasma jet flame of great bulk because the electrode diameters of ⬃ several tens of mm are usually larger than those of the rod-nozzle electrodes torch 共less than 10 mm兲, and it is easy for the torch to be scaled up in the large-scale processing up to MW power levels. These unique
15, 023501-1
© 2008 American Institute of Physics
Author complimentary copy. Redistribution subject to AIP license or copyright, see http://php.aip.org/php/copyright.jsp
023501-2
Kim et al.
Phys. Plasmas 15, 023501 共2008兲
FIG. 1. A schematic diagram of a nontransferred plasma torch with hollow electrodes illustrating an operation principle of the torch.
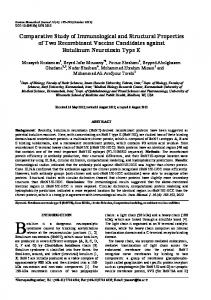
advantages have made the hollow electrodes torches more useful in their industrial applications to hazardous waste treatments3–8 and synthesis of new materials with highperformance properties.9–11 The technical and scientific information associated with the generation and stabilization of thermal plasmas has been well established for hollow electrode torches up to now, and the development of new techniques for improving process efficiency and electrode lifetime is becoming a major concern.12 Since process efficiency and electrode erosion are closely connected to temperature and velocity fields of the thermal plasma inside the torch as well as arc root movements along the electrode surfaces, the information on the physical mechanism of the arc discharge occurring between the electrodes and the resultant plasma characteristics is needed as basic knowledge to understand discharge phenomena and arc-wall interaction. The direct observation of arc discharge between the electrodes inside the torch is practically impossible due to the limitations on the accessibility of instrumental tools. Therefore, experimental studies have been mostly restricted to the measurements of electrical characteristics of the torch operation, such as voltage-current 共V-I兲 characteristics, arc voltage fluctuations, and torch thermal efficiencies.8,13,14 Recently, numerical approach to this arc plasma analysis has been getting popular, and physical models employed in the numerical analysis have become sophisticated to obtain more realistic descriptions of arc discharge phenomena inside the torch.8,15–22 By adopting the cold flow analysis of Brillhac et al.,14 Hur and Hong determined a representative cathode spot position, and calculated the two-dimensional 共2D兲 axisymmetric distributions of air plasma temperature and velocity both inside and outside the torch.8,15 In this numerical work, an annular distribution of arc roots was imposed in the discharge region and the rotational motion of arc roots is neglected, in spite of the inherent 3D and transient nature of arc discharge phenomena as graphically described in Fig. 2共a兲. The movement of localized arc roots is averaged over the time in the numerical simulations, and the resultant values of plasma fields are thus considered on a timeaveraged basis as illustrated in Fig. 2共b兲 for the 2D axisymmetric modeling. However, the assumptions have not been justified by any rigorous study compared either with the results of 3D transient calculations or with the experimentally measured data. Although Hur and Hong validated their recent 2D calculation results by a comparison of the calculated plasma net powers with the measured ones, it is still
FIG. 2. Graphical description of arc root configuration inside a nontransferred plasma torch with hollow electrodes: 共a兲 a 3D highly localized configuration of real arc root and 共b兲 a 2D axisymmetric configuration of timeaveraged arc root.
questionable whether the 2D stationary assumption is truly acceptable for numerical modeling of the hollow electrodes torches. In order to overcome the shortcomings of the 2D stationary model, a transient 3D numerical model was developed by Park et al.16 and the arc root rotation driven by an external magnetic field was investigated to find out its influences on thermal plasma characteristics. The dependency of arc rotation velocity on operating conditions was well clarified through this 3D simulation, but the paper did not deal with either arc discharge phenomena or resultant plasma characteristics in detail by investigating the inherent 3D and turbulent nature of arc discharges. In addition, comparative studies of 3D simulations with 2D calculations and/or experimental measurements were not attempted to conduct for the validity of their results. It should be pointed out that the verification of their previous 2D or 3D calculations has been impossible owing to the total lack of experimental data measured for the corresponding plasma characteristics. In the present paper, a comparative analysis of 2D and 3D modeling on arc discharge phenomena inside the hollow electrodes torch has been performed to verify the applicability or limitation of axisymmetric and stationary assumptions for the numerical modeling of the respective plasma torches. For this purpose, a more precise 3D transient numerical model based on the conventional 2D model has been developed, and comparisons between the two models are made. For the validation of the calculated results by comparison with experimental data, the actual temperature and velocity distributions of the thermal plasma jet are directly measured by an enthalpy probe method. The measured plasma jet characteristics are compared with the calculated ones obtained from numerical analysis to justify the prediction derived from numerical simulations.
Author complimentary copy. Redistribution subject to AIP license or copyright, see http://php.aip.org/php/copyright.jsp
023501-3
Phys. Plasmas 15, 023501 共2008兲
Comparative study of two- and three-dimensional…
II. NUMERICAL MODELING A. Assumptions and governing MHD equations
In the present numerical work, both the 2D and 3D simulations are carried out with the usual assumptions frequently used in the previous thermal plasma modeling:15–24 共1兲 The plasma flow is steady and axisymmetric only for the 2D modeling. 共2兲 The produced plasma is quasineutral and turbulent. 共3兲 The optically thin plasma is in a local thermodynamic equilibrium 共LTE兲 state. 共4兲 The viscous dissipation and pressure work terms are not considered in the energy equation. 共5兲 The flow is incompressible and the mass density 共兲 depends only on the plasma temperature. The assumption 共1兲 is not applied to the 3D transient numerical modeling, in which the local attachment and rotational motion of arc roots are taken into account. Based on these assumptions, the coupled interactions among arc current, self-induced magnetic field, and plasma flow are described in the framework of magnetohydrodynamic 共MHD兲 equations for conservations of mass, momentum, energy, and charge, along with the K- turbulence model, where K and are the turbulent kinetic energy and its dissipation rate, respectively.25 The axisymmetric cylindrical coordinates system 共r, z兲 is adopted in the 2D stationary modeling because of its geometrical symmetry, whereas the Cartesian coordinates system 共x, y, and z兲 is employed in the 3D transient modeling. 共a兲
Conservation of mass,
+ ⵜ · 共v兲 = 0. t 共b兲
共1兲
Conservation of momentum,
共v兲 + ⵜ · 共vv兲 = j ⫻ B − ⵜp + ⵜ · . t 共c兲
共2兲
Conservation of energy,
共h兲 + ⵜ · 共vh兲 = j · E − R˙ + ⵜ · 共k ⵜ T兲. t 共d兲
Turbulent kinetic energy,
共K兲 + ⵜ · 共vK兲 = G − + ⵜ · t
冋冉
l +
共3兲
冊 册
t ⵜK . PrK 共4兲
共e兲
Dissipation rate of turbulent kinetic energy,
共兲 + ⵜ · 共v兲 t =
共C1G − C2兲 + ⵜ · K
冋冉
l +
冊 册
t ⵜ . Pr
FIG. 3. Computational domains for 共a兲 internal and 共b兲 external region of a plasma torch with hollow electrodes.
plasma, j is the arc current density, B is the magnetic field, p is the static gas pressure, and is the viscous stress tensor. In the energy conservation equation 共3兲, h is the specific enthalpy, is the thermal conductivity, E is the electrical field, and R˙ is the optically thin radiation loss. The radiation loss R˙ is taken into account by using the net emission coefficient. In order to include the turbulent effects produced by arc gas, a standard K- model is employed, in which the turbulent viscosity t and the turbulent thermal conductivity t are defined as
t = C
K2
In 2D stationary modeling, the time-dependent term of each conservation equation vanishes 共i.e., / t = 0兲. In the momentum conservation equations 共2兲, v is the velocity of
tc p , Prt
共6兲
where C and Prt are the constant in the turbulence model and the turbulent Prandtl number, respectively.25 In the turbulent equations 共4兲 and 共5兲, PrK, Pr, C1, and C2 are the constants suggested by Launder and Spalding.26 In addition, G is the product of the turbulent viscosity and viscous dissipation terms written in the cylindrical coordinates as
再冉 冊 冉 冊 冉冊 冉 冊 冋 冉 冊册 冉 冊 冎
G = t 2 共5兲
t =
and
+ r
u z
r r
2
+2 2
+
r
2
+2
u + r z
r
2
+
z
2
2
and in the Cartesian coordinates system as
Author complimentary copy. Redistribution subject to AIP license or copyright, see http://php.aip.org/php/copyright.jsp
共7兲
023501-4
Phys. Plasmas 15, 023501 共2008兲
Kim et al.
TABLE I. Boundary conditions of temperature, velocity, and turbulent variables for numerical modeling inside the hollow electrode torch. 共a兲 Inside the arc root; 共b兲 outside the arc root. Plasma variables
Arc gas inlet A
Torch exit B
Cathode wall C
T = 300 K
T / n = 0
T=
T
v K
G = t
冉
1000 K
T=
兵
共a兲
2000 K
共b兲
1000 K
v Õ n = 0
v=0
K = 0.005v2n = 0.09K2 / l
K / n = 0 / n = 0
wall function
wall function
wall function
wall function
冊
共8兲
where i is the ith component of the velocity vector in Cartesian coordinates. By the K- model, the viscosity and thermal conductivity in the governing equations include both laminar and turbulent components, and
2000 K
flow rate vn = 共area of A兲
i j i + , x j xi x j
= l + t
兵
共a兲
共b兲
Anode wall D
= l + t .
共9兲
In both the 2D and 3D simulations, the distributions of arc current density j are obtained from the current continuity equation ⵜ · j = 0, along with the generalized Ohm’s law j = 共−ⵜ + v ⫻ B兲, which results in an elliptic equation for electric potential , ⵜ · 共 ⵜ 兲 = ⵜ · 共v ⫻ B兲,
共10兲
where and v are the electric conductivity and the plasma velocity, respectively. The magnetic field B is a self-induced field by the arc current itself and it can be found using the magnetic vector potential A from B = ⵜ ⫻ A. The magnetic vector potential A is determined from the following form of Ampere’s law:
v=0
ⵜ2A = − 0j,
共11兲
where 0 = 4 ⫻ 10−7 TmA−1 for the magnetic permeability of free space. Lastly, air is considered as a plasma forming gas, and the temperature-dependent thermodynamic and transport properties of air plasma are taken from the tabulated data, which are calculated with an assumption of the LTE.27 B. Boundary conditions
The computational domains used for the calculation of plasma fields inside and outside the torch are presented in Figs. 3共a兲 and 3共b兲, respectively. For a comparison of calculated fields with measured results, a computational domain for the exterior region of the plasma torch is taken into account as shown in Fig. 3共b兲. The diameter of both the cylindrical cathode and anode electrodes was chosen as 16 mm, and their lengths were fixed to be 300 and 200 mm, respectively. The boundary conditions imposed on the arc gas inlet “A,” torch exit “B,” and electrode walls “C and D” are summarized in Table I for the inside modeling, while the thermal plasma jet characteristics outside the torch are calculated
TABLE II. Boundary conditions of temperature, velocity, and turbulent variables for numerical modeling outside the hollow electrode torch. The subscript “exit” indicates that the variable value is obtained at the torch exit using the results of inside modeling, which are calculated from 共a兲 a 3D transient model or 共b兲 a 2D stationary model. Plasma variables T
v
K
Torch exit 共OH兲
兵 兵 兵 兵
共a兲
T=
T=
K=
共a兲
vexit avg. in coord.
共a兲
Outflow 共EF兲
T / r = 0
T = 300 K
T / z = 0
u / r , , = 0
u , 共r兲 / r , = 0
v Õ z = 0
K / r = 0
K / r = 0
K / z = 0
/ r = 0
= 5.0CK2 / l
/ z = 0
vexit Texit avg. in coord.
共b兲
Kexit
exit avg. in coord.
共b兲
Free stream 共FH兲
Texit
共b兲
共a兲
=
Texit avg. in coord.
共b兲
Centerline 共OE兲
exit
Author complimentary copy. Redistribution subject to AIP license or copyright, see http://php.aip.org/php/copyright.jsp
023501-5
Phys. Plasmas 15, 023501 共2008兲
Comparative study of two- and three-dimensional…
from the boundary conditions listed in Table II. Since the arc currents, which make the interior arc plasma formed in a 3D configuration, do not exist in the exterior plasma jet plume, a 2D stationary model is simply employed for the outside numerical modeling to save the computing time and to readily get more practical information on the jet flow characteristics, and justification of this approach will be further discussed in Sec. III C. The 3D plasma fields for T, v, K, and , which are calculated in the internal region by the 3D simulation, are averaged over the theta direction at the torch exit plane, and these averaged values are used as the boundary conditions at the torch exit “OH” in addition to those directly obtained from the 2D stationary model, as described in Table II. C. Determination of arc root positions
Prior to the numerical simulations, it is important to determine the appropriate axial positions of cathode and anode arc roots, because the plasma temperature and velocity fields inside the torch are strongly influenced by the arc root positions. In the numerical modeling of the rod-nozzle electrodes torch, the cathode arc root is fixed on a tip of a conical tungsten cathode and the position of the anode arc root is usually predicted from Steenbeck’s minimum principle by finding the minimum arc voltage condition across the arc column.23,28 In the hollow electrodes type, however, the cathode arc root also moves back and forth on the cylindrical cathode surface in contrast to the rod-nozzle electrodes type, and the two positions of cathode and anode arc roots must be correctly determined at the same time. But it is very difficult to find the arc root positions properly based on a reliable theoretical basis in the numerical simulation. By adopting the cold flow analysis suggested by Brillhac et al.,14 Hur and Hong determined a representative cathode spot position in their recent numerical work.8,15 From the cold flow simulation in the absence of an arc discharge, they showed that the erosion area damaged by the attachment of a cathode arc root along the cathode wall was apparently associated with an axial velocity of cold gas at a distance of 0.5 mm from the cathode wall. In the present modeling work, the representative cathode spot position was determined from the observation of the erosion traces on the cathode surface in the diagnostic experiments. For typical operational conditions of discharge current I of 200 A and an arc gas flow rate G of 200 slpm for an electrode diameter d of 16 mm, it was found that the representative cathode arc spot was located at 40 mm away from the end wall of the cathode. As mentioned previously, the anode arc root position has usually been determined by Steenbeck’s minimum principle in other work, but the minimum arc voltage predicted from the numerical model showed some discrepancies from measured ones.23,28 For this reason, in the present numerical work, the anode arc root position is estimated by matching the predicted arc voltage with the measured one from discharge experiments. This experiment-based semiempirical approach provides more reasonable simulation results close to the actual situation occurring inside the plasma torch. In addition, the axial motion of arc roots that arises from
the force imbalance and reattachment process 共i.e., restrike mode兲 is not considered in this work because of a total lack of reliable models describing axial movement of arc roots in a hollow electrodes torch. Only continuous rotational motion of the cathode arc root is assumed based on Park’s work,16 while the azimuthal position of the anode arc root is assumed not to change with time in this simulation. Narrow sheaths in front of the electrode surfaces 共i.e., interaction between plasmas and electrodes兲 are not taken into account in this numerical modeling. Instead, an exponential current profile is prescribed near the arc roots according to Huang’s assumption.23 The size of the cathode arc root was taken from Hur’s paper,15 in which they proposed a cathode root radius of 2 mm for their numerical modeling of a hollow electrodes torch. Along the anode surface, the electrical potential is assumed to be constant and electrode surface temperature is set to be 1000 K except for the arc root position, which is assumed to have a temperature of 2000 K. Since the LTE assumption may break down near the anode, an artificially high electrical conductivity is imposed in front of the position of the arc root attachment. More details on the electrical boundary conditions and assumptions on the movement of arc roots can be found in the previous work of Park.16 D. Numerical methods
A 2D numerical code, DCPTUN 共DC Plasma Torch in UNstructured grid system兲 developed in the authors’ laboratory, is used for the 2D stationary simulation.16 For the 3D transient simulation, the DCPTUN code has been extended to a 3D transient code, DCPT3D 共DC Plasma Torch 3-Dimensional兲, by inclusion of the 3D and transient natures of arc plasma at atmospheric condition.16 A 3D grid system is constructed by rotating a 2D unstructured grid about the symmetric axis of computational domain. To solve a set of the governing equations numerically subject to their boundary equations, all equations are discretized in the cylindrical or Cartesian coordinates system by a finite volume method 共FVM兲, and a SIMPLE-like pressure correction algorithm is employed along with a momentum interpolation for iterative calculations. In each iteration step, an under-relaxation scheme is also adopted to improve the convergence of numerical solutions. Lastly, a BiCGStab method with an ILU共0兲 preconditioner is used to solve the equations discretized in a matrix form, and a fully implicit method is applied as a time-advancing scheme in the 3D transient model in order to secure numerical stabilities.29 III. RESULTS AND DISCUSSION A. Inherent 3D and turbulent nature of arc discharge inside the torch
Figures 4 and 5 show the distributions of air plasma temperature and velocity vector inside the hollow electrode torch operated with typical conditions of I = 200 A, G = 200 slpm, and d = 16 mm. The calculated temperature distributions seen in Fig. 5共a兲 obviously reveal the 3D nature of the arc discharge in the hollow electrodes torch. The plasma temperature appears to have its highest value near the cathode arc root region and in front of the vortex chamber.
Author complimentary copy. Redistribution subject to AIP license or copyright, see http://php.aip.org/php/copyright.jsp
023501-6
Kim et al.
Phys. Plasmas 15, 023501 共2008兲
FIG. 4. Time evolutions of 共a兲 isotherms of plasma arc column and 共b兲 velocity vectors inside the hollow electrode torch 共I = 200 A, G = 200 slpm, and d = 16 mm兲.
The maximum temperature of air plasma is calculated as 13 000 K, which is considerably lower than that of argon plasma 共⬃20 000 K兲 inside a rod-type torch. A hightemperature region widely spreads along the arc column and a 3D configuration of arc column temperature prevails in the entire region of the cathode. However, the high-temperature cathode region shrinks abruptly near the arc gas inlet region as cold arc gases are injected into it, and a near axissymmetric temperature distribution is gradually developed from the downstream of the vortex chamber to the torch exit in the anode region. The axial velocity is not significantly developed in the cathode region as appearing in Fig. 5共b兲. At the cathode arc root region, swirl velocity components are certainly observed with a nonaxisymmetric arrangement, which indicates that the cathode arc root rotates around the cathode surface by the contribution of both the J ⫻ B force generated from the arc current and the gas dynamic drag force from the swirling plasma gas. Plasma gas gains its axial momentum considerably after passing through the arc gas inlet region, and its axial velocity component begins to increase very rapidly. As plasma gas moves toward the torch exit, its swirl velocity component, superposed by a vortex injection of arc gas, rapidly vanishes, and its axial velocity component is dominantly developed in the anode region near the torch exit. Eventually,
a near-axisymmetric distribution of the velocity field is established at the torch exit, similar to the temperature case. The 3D features of temperature and velocity distributions observed in Fig. 5 are closely related to the 3D distribution of arc currents in the arc column, which provides the arc plasma gas with the energy and momentum sources in terms of Joule heating and Lorentz force. Figure 6共a兲 shows the calculated arc current distribution inside the hollow electrodes, and the arc roots are seen to be sharply localized on the inner surfaces of electrodes with a circumferential nonuniformity, which leads to a 3D configuration of the arc column formed between the two electrodes inside the torch. In the cathode region, the arc currents are broadly distributed over almost the entire cathode region and finally merged into a cathode arc root, the area of which is assumed to have a radius of 2 mm. Since the broad high-temperature region observed in Fig. 5共a兲 provides a good current path due to the corresponding high electrical conductivity, the electrical currents are broadly distributed in the whole area of the cathode. As the cold arc gases are injected from the vortex chamber, the high-temperature region shrinks radially inward and the arc currents are subsequently concentrated on the centerline of the cylindrical electrodes as seen in Fig. 6共a兲. In the constricted arc column, a large amount of thermal energy is lo-
Author complimentary copy. Redistribution subject to AIP license or copyright, see http://php.aip.org/php/copyright.jsp
023501-7
Comparative study of two- and three-dimensional…
Phys. Plasmas 15, 023501 共2008兲
FIG. 5. 共Color online兲 共a兲 Isotherms of plasma arc column with T = 4000, 7000, and 10 000 K and 共b兲 velocity vectors inside the hollow electrode torch 共I = 200 A, G = 200 slpm, and d = 16 mm兲.
FIG. 6. 共a兲 Arc current density vectors inside the hollow electrodes torch and 共b兲 isocontours of the ratio of turbulent to laminar viscosity 共t / l兲 with 5, 15, and 20 共I = 200 A, G = 200 slpm, and d = 16 mm兲.
cally generated by an increased arc current density and the plasma temperature rises drastically, as shown in Fig. 5共a兲. A temperature rise in the arc column is usually accompanied by a volume expansion of plasma gas, and the plasma gas experiences a rapid acceleration to the axial direction as observed previously in Fig. 5共b兲. Hence, it can be concluded that the constricted arc column near the vortex chamber plays an important role in both heating and acceleration of the injected arc plasma gas by concentrating the arc current density on the centerline of the electrodes. In the rod-nozzle electrodes torch, the arc plasma gas is mainly heated and accelerated just in front of the cathode tip where the arc currents are concentrated.23 In this point of view, the constricted arc column region around the vortex chamber can be regarded as a fictitious hot cathode of the hollow electrode torch. Hur and Hong reported in their recent paper that the hollow electrode torch has high turbulent intensity in a broad region from the gas inlet to the torch exit.15 The isocontours of the ratio of turbulent to laminar viscosity 共t / l兲 calculated in this work also show in Fig. 6共b兲 that the high viscosity ratios over 10 are predominant from the arc gas inlet region to the torch exit. However, lower values of the viscosity ratio are observed in the whole cathode region, where the turbulence effects consequently seem to be insignificant. Furthermore, the velocity difference between arc plasma gas and injected cold gases 共i.e., turbulence sources兲 seems to be
small at their interface region. These fluid dynamic conditions make the flow less turbulent, and a near laminar flow prevails in the cathode arc column excluding both of its end regions. The low density and high viscosity of hot plasma gas inside the cathode prevents the injected cold gases from entering into the centerline region of the arc column, and the high viscosity of flow also has a positive effect on laminarizing the flow from external perturbations.30 As the arc plasma gas is accelerated through a volume expansion process inside the constricted arc column, a large velocity difference between arc plasma gas and injected cold gases takes place at their boundary layers and a strong turbulent flow is consequently developed from the constricted arc column, as shown in Fig. 6共b兲. It is also noted by comparing Fig. 6共b兲 with Fig. 6共a兲 that the turbulent viscosity ratios are low in the regions where the current densities are high, and this will be discussed further in Sec. III B. The turbulence flow inside the electrodes usually has a tendency to enhance the heat and mass transfer between hot gas near the electrode axis and cold gas distributed near the electrode wall, which leads to a rapid relaxation of a 3D configuration of plasma fields through the mixing process. This is why the inherent 3D nature of arc discharge phenomena originating from the 3D distribution of arc currents is well preserved inside the cathode region, and these 3D features slowly diminish behind the vortex chamber where the turbulent flow begins to be developed. Based on the present simulation re-
Author complimentary copy. Redistribution subject to AIP license or copyright, see http://php.aip.org/php/copyright.jsp
023501-8
Kim et al.
Phys. Plasmas 15, 023501 共2008兲
FIG. 8. 共Color online兲 Temperature distributions inside the hollow electrode plasma torch obtained from the 2D simulation 共I = 200 A, G = 200 slpm, and d = 16 mm兲.
FIG. 7. 共Color online兲 Temperature distributions inside the hollow electrode plasma torch obtained from the 3D simulation on the three different crosssectional planes: 共a兲 on the 0 – plane, 共b兲 on the / 2-3 / 2 plane, and 共c兲 on the A-A⬘ plane 共I = 200 A, G = 200 slpm, and d = 16 mm兲.
tially nonuniform attachments of arc roots. On the other hand, the 2D simulation predicts an axisymmetric temperature field with the highest temperature region at the axis as shown in Fig. 8, and definite discrepancies from the 3D simulation results are found inside the cathode region, particularly at the cathode arc root and in front of the vortex chamber. The axial profiles of temperature and velocity fields predicted from each of the numerical models are plotted in Fig. 9 along the axis of the hollow electrodes. The distinct differences between the 2D and 3D simulation results are observed in the cathode arc root and arc gas inlet regions. Both simulation results apparently show that the constricted arc column near the arc gas inlet region plays an important role in both
sults, it is reasonable to say that the mixing effects from the strong turbulence flow are mainly responsible for the gradual transition of the 3D configurations of plasma fields into the 2D axisymmetric ones that eventually appear in the anode region near the torch exit, as seen in Fig. 5. B. Comparison between 2D and 3D numerical results
A comparative study between the 2D and 3D simulation results is performed to find out the effects of arc root configuration either in a 2D annular shape or in a 3D highly localized shape on the resultant plasma fields and discharge mechanism inside the torch. Figure 7 shows isotherms of temperature distribution inside the hollow electrodes torch on the two different crosssectional planes perpendicular to each other 共0- and / 2-3 / 2 planes兲 and on the cross-sectional plane enclosing an anode arc root 共A-A⬘ plane兲 as designated in Fig. 6共a兲. As clearly seen in Fig. 7共a兲, a very long arc column whose length is about 360 mm has been predicted, and the highest temperature region is found near the vortex chamber with an off-axis configuration. The isocontours of plasma temperature on the “0- plane” are considerably different from those on the “ / 2-3 / 2 plane” shown in Fig. 7共b兲, and this fact directly indicates that the plasma fields inside the hollow electrodes torch have a strong 3D nature. Although axisymmetric boundary conditions are imposed on the arc gas inlet region in the 3D modeling, the arc column shrinks asymmetrically as seen in Fig. 7共a兲 because of the circumferen-
FIG. 9. Comparison between 2D and 3D simulation results for axial profiles of 共a兲 temperature and 共b兲 axial velocity inside the hollow electrode torch 共I = 200 A, G = 200 slpm, and d = 16 mm兲.
Author complimentary copy. Redistribution subject to AIP license or copyright, see http://php.aip.org/php/copyright.jsp
023501-9
Comparative study of two- and three-dimensional…
TABLE III. Comparison between 2D and 3D modeling results of major plasma characteristics and torch efficiency calculated in the typical operating conditions of I = 200 A, G = 200 slpm, and d = 16 mm. The subscript “em” means the maximum value at the torch exit plane. Modeling 2D 3D
Tmax 共K兲
Umax 共m/s兲
Tem 共K兲
Uem 共m/s兲
共%兲
13 490 13 891
731 647
6516 6389
680 573
56.7 48.9
heating and accelerating arc plasma gas as discussed previously. But the heating and acceleration of arc plasma gas are a little affected by the cathode arc root configurations. In the axial position of z = 25− 30 cm, the plasma gas is strongly heated by the Joule heating process inside the constricted arc column, and then cooled down as the cold arc gases are injected from the vortex chamber. From the W-shaped profile appearing around the cold gas injection region in Fig. 9共a兲, it is evident that the arc column in the 3D calculation is strongly kinked by the injection of cold arc gases from the vortex chamber. The intensive heating of plasma gas near the vortex chamber also gives rise to an acceleration of plasma gas through the volume expansion process in the axial region of z = 25− 35 cm, as seen in Fig. 9共b兲. The differences in temperature profiles between the two numerical models begin to reduce as the arc plasma moves toward the torch exit due to the strong mixing effects of turbulent flow, and eventually very similar profiles are established at the torch exit. But appreciable differences are still observed in the absolute values of axial velocity profiles. Since the constricted arc column is located at the off-axis in the 3D simulation, the temperature and velocity calculated along the axis of the electrodes do not represent their maximum values, respectively. This is regarded as one of the reasons why both the temperature and axial velocity values predicted from the 3D model are somewhat lower than those of the 2D model, as seen in Fig. 9. The radial profiles of temperature and axial velocity at the torch exit are plotted in Fig. 10 from the 2D and 3D simulations. The maximum values of temperature and axial velocity on the two planes, i.e., the 0- plane and the / 2-3/2 plane, are not located at the center of the torch exit. Higher temperature and velocity appear at the radial positions where the anode arc roots are attached. In these regions, the local current density is much higher than other regions and more thermal energy is generated from the intensive Joule heating process. The averaged 3D numerical values are also compared with the 2D calculation results in Fig. 10. It is found that the averaged profiles of the 3D temperature and axial velocity distributions look very similar to those of the 2D calculations, respectively, with the same position of their maximum values at the center of the torch exit. But differences in their absolute values are clearly seen in Fig. 10, where the 2D calculation results predict higher values of temperature and axial velocity. The major plasma characteristics predicted from the 2D and 3D models are compared in Table III. Although the 3D simulation predicts a higher maximum temperature of
Phys. Plasmas 15, 023501 共2008兲
13 891 K inside the hollow electrodes torch, the 2D calculation predicts a hotter and faster plasma jet at the torch exit. Above all, a great difference between the 2D and 3D modeling results is found in the torch thermal efficiency , which is defined as the fraction of input electric power transferred to thermal plasma jets. The 2D model predicts a thermal efficiency of 56.7% higher than the 3D model of 48.9%, and this discrepancy in the torch thermal efficiency is a main reason why the radial distributions of plasma temperature and velocity are higher from the 2D calculation results than those from the 3D ones presented in Fig. 10. From the comparative studies in this work, it is certain that the basic mechanism of heating and acceleration of plasma gas is not significantly affected depending on the cathode arc root shapes, but highly localized arc roots cause an asymmetric constriction of arc column near the vortex chamber so that the highest temperature region is not located on the axis within the hollow electrodes. In addition, arc root configurations seem to have a significant effect on the heat transfer between hot plasma gas and cold electrode wall. Since the maximum temperature of 13 891 K predicted from the 3D model is a bit higher than that of the 2D calculation of 13 490 K, it is not reasonable to say that the heat transfer in the 3D simulation is simply enhanced by a steep temperature gradient established along the radial direction inside the electrodes. Another explanation we can think of for the difference in thermal efficiency is the turbulence phenomena, which usually have a tendency to enhance the heat transfer inside the electrodes. The effects of arc root configuration on the turbulence phenomena inside the electrodes are investigated in detail because the significant arc root effect on the heat transfer seems to result from the turbulence phenomena affected by the arc root configuration. In Fig. 11, a strong turbulent flow is established behind the arc gas injection region as previously discussed, and high viscosity ratio values from 10 to 20 are observed. However, the values of the viscosity ratio start to drop after the axial position of around z = 40 cm, which indicates that an anode arc column is considered to be connected to the anode wall. Such results are commonly observed from both the 2D and 3D simulations. The high currents flowing inside the anode arc column interact with the oncoming cold plasma gases injected from the vortex chamber, and further heat the generated arc plasma passing through the anode arc column region. The elevated plasma temperature results in an increment in the plasma viscosity and eventually gives a positive effect on relaminarizing the flow from external perturbations.30 This is why the plasma flow becomes less turbulent in the downstream just after the arc column inside the torch in both the 2D and 3D simulations. In the 2D simulation, a circumferentially uniform attachment of anode arc column is inevitably employed due to the axisymmetric assumption, and all the oncoming cold gases are supposed to pass through the anode arc column. In this case, the cold arc gases are uniformly heated along the azimuthal direction and the resultant turbulent intensity after the arc column remains at a very low level for all theta angles as shown in Fig. 11共c兲. In the 3D calculation results, however, the anode arc root is highly localized to a few arc spots
Author complimentary copy. Redistribution subject to AIP license or copyright, see http://php.aip.org/php/copyright.jsp
023501-10
Kim et al.
Phys. Plasmas 15, 023501 共2008兲
FIG. 11. 共Color online兲 Distributions of the ratio of turbulent to laminar viscosity 共t / l兲 inside the hollow electrodes torch: 共a兲 3D simulation result on the 0- plane, 共b兲 3D simulation result on the / 2-3 / 2 plane, and 共c兲 2D simulation result 共I = 200 A, G = 200 slpm, and d = 16 mm兲.
FIG. 10. Comparison between 2D and 3D simulation results for radial profiles of 共a兲 temperature and 共b兲 axial velocity at the exit of the hollow electrodes torch 共I = 200 A, G = 200 slpm, and d = 16 mm兲.
limited in a narrow range of theta angle. Therefore, it is more probable that most of the oncoming cold gases flow around the anode arc column rather than directly pass through the arc column. These situations can be clearly confirmed from the distributions of plasma temperature and viscosity ratio on the circular cross-sectional planes of the hollow electrode torch, as shown in Fig. 12, where the cross-sectional planes are located at the axial positions of the cathode arc root, arc gas inlet, anode arc column, and torch exit regions. It is confirmed from the consecutive distributions plotted in Fig. 12 that the strong turbulent flows are generated just behind the arc gas inlet region, and eventually they are well developed around the anode arc column. From the above comparison, the turbulence phenomena in the 2D simulation turn out to be somewhat underestimated by forcing all the oncoming cold gases to pass inside the hot anode arc column, and the smaller amount of heat transferred to the cold anode wall is estimated in the 2D calculation. For
that reason, the 2D calculation predicts higher temperature and velocity profiles at the torch exit along with higher thermal efficiency compared with the 3D simulation. In the case of the rod-nozzle electrode torch, the turbulence phenomena inside the torch are less significant and have little effect on the characteristics of plasma fields as well.15 Therefore, the 2D calculation results for the rodnozzle type are in good agreement with the experimentally measured ones, and the assumption of circumferentially uniform arc attachment seems to be acceptable for the torch modeling. But more careful attention is needed for numerical modeling of the hollow electrodes torch, because the arc root configuration of 2D axisymmetric or 3D highly localized shape may have a significant effect on turbulent phenomena, which play an important role in determining the thermal flow characteristics inside the torch.15 C. Validation of 2D and 3D numerical models
In order to ensure the simulation accuracies of the numerical models employed in this work and to justify the numerical predictions discussed on the arc discharge phenomena inside the hollow electrodes, comparisons of the calculated plasma characteristics should be made with the measured ones. But it is normally difficult to characterize the plasma properties inside the torch by experimental means because the use of most diagnostic tools is restricted to the measurements on the ejected plasma jets due to their limited access to the interior space of the torch. In this work, the calculated and measured properties of the thermal plasma jets ejected from the torch are compared for validation pur-
Author complimentary copy. Redistribution subject to AIP license or copyright, see http://php.aip.org/php/copyright.jsp
023501-11
Comparative study of two- and three-dimensional…
FIG. 12. 共Color online兲 Distributions of 共a兲 temperature and 共b兲 ratio of turbulent to laminar viscosity 共t / l兲 on the circular cross-sectional planes located at the axial positions of cathode arc root, arc gas inlet, anode arc column, and torch exit regions.
poses. It is true that the turbulence and 3D phenomena inside the torch would be seriously damped in the plasma jet outside the torch. But the main conclusion derived by this comparative study is that the arc root configuration 共2D or 3D兲 seems to have a significant effect on the radial heat-transfer rate to the electrode surface by affecting turbulence phenomena. In this case, it is feasible to estimate the accuracy of each numerical model only using the plasma jet characteristics measured from experiments because the temperature and velocity distributions established outside the torch are mainly governed by the heat-transfer mechanism taking place inside the torch. For the plasma jet diagnostics, an enthalpy probe has been used as a diagnostic tool in this work, because it is the most suitable device for the measurements of air thermal plasma, which has relatively low temperature, strong turbulence flow, and complex emission spectral lines.31–35 The radial profiles of temperature and axial velocity were measured at z = 60 and 80 mm from the torch exit with an interval of 2 mm from r = 0 to 20 mm. Since the probe tip could not sustain heat fluxes higher than 108 W / m2, the measurements on the axial profiles of plasma fields were made starting from an axial position of z = 60 mm. For the validation of the 3D numerical predictions made
Phys. Plasmas 15, 023501 共2008兲
through this work, the thermal flow characteristics of air plasma jet ejected from the torch exit are first computed by taking advantage of the numerical values calculated inside the torch. The simplified numerical approach of a 2D stationary model employed for the outside numerical modeling can be justified by the fact that the inherent 3D nature of arc discharge due to 3D distribution arc current starts to diminish behind the arc gas inlet region where the arc column shrinks radially inward and the turbulent flow begins to be developed, and quasi–2D axisymmetric plasma fields eventually appear in the anode region near the torch exit, as discussed previously in Sec. III A. Although the distributions are not completely axisymmetric at the torch exit, a 2D stationary model can be employed because the jet expansion at the exit of the torch usually further intensifies turbulence in a plasma jet due to a large velocity difference between plasma jet and ambient air. Figure 13 shows the temperature and axial velocity profiles at z = 60 and 80 mm obtained from both the simulations and experiments. The data points 共䊐兲 represent the measured results from the diagnostic experiments. In Fig. 13共a兲, the temperature values predicted by the 3D numerical simulation are in fairly good agreement with the measured results at every radial position, except for the central region of the jet, where the predicted values are slightly lower than the experimental results. But the difference between the calculated and measured results is less than 9% at the central region. Moreover, the 3D based temperatures at z = 80 mm match fairly well with the measured values for every radial position as seen in Fig. 13共b兲. The axial velocity profiles are also compared in Figs. 13共c兲 and 13共d兲, which show excellent agreement between the measurements and 3D calculations for both the cases of z = 60 and 80 mm. In the analogy of these comparisons, it is argued that the 3D numerical simulation reasonably describes the actual arc discharge phenomena occurring inside the hollow electrode torch as well as the thermal plasma characteristics outside the torch. Furthermore, the validity of the mathematical formulations and assumptions employed in the 3D numerical modeling is indirectly justified through these comparisons as well. The full 2D simulation results for both internal and external regions of the torch, which are obtained on the basis of Hur and Hong’s work,8,15 are also compared with the experimentally measured ones in Fig. 13. The 2D simulation results of plasma temperature at z = 60 and 80 mm are satisfactorily consistent with the measured ones, but those of axial velocity are appreciably overestimated by over 50 m / s with 14% error near the axis of the plasma jet. The thermal efficiency of the torch is estimated from the experimental data and compared with the predicted values from the 2D and 3D numerical models. The thermal efficiency measured from the experiment turns out to be about 48%, which is very close to the predicted one from the 3D calculation of 48.9%, but quite lower than the 2D calculation result of 56.7%. In connection with previous numerical results in Sec. III B, these comparison results for the thermal efficiency obviously reveal that the 3D simulation is more accurate than the 2D simulation by precisely describing the turbulence phenomena inside the torch using a more realistic
Author complimentary copy. Redistribution subject to AIP license or copyright, see http://php.aip.org/php/copyright.jsp
023501-12
Phys. Plasmas 15, 023501 共2008兲
Kim et al.
FIG. 13. Comparison between the calculated 共2D and 3D兲 and measured radial temperature profiles of the air thermal plasma jets at 共a兲 z = 60 mm and 共b兲 z = 80 mm from the torch exit; and measured radial velocity profiles at 共c兲 z = 60 mm and 共d兲 z = 80 mm from the torch exit 共I = 200 A, G = 200 slpm, and d = 16 mm兲.
model of arc root attachment with a 3D highly localized configuration on the electrode wall surfaces. Although the 2D stationary model is often useful for the thermal plasma analysis because of its simplicity and rapidness in numerical computations,8,15 the 3D simulation provides more accurate calculation results as confirmed in this numerical and experimental work. In general, the enthalpy probe diagnostics measure the time-averaged properties of thermal plasma jets, instead of their transient behaviors coming from arc root fluctuations and turbulent plasma flows. This is though to be a main reason why the 2D stationary approach to the thermal plasma modeling outside the torch could give the calculated results consistent with the measurements by the enthalpy probe diagnostics. Based on this consideration, it can be proposed that the 3D transient formulation is indeed required for predicting the fundamental arc discharge phenomena inside the torch, but the 2D stationary approach seems to be more useful for getting practical information of thermal plasma characteristics outside the torch for saving the computing time and improving the accuracy of the time-averaged calculations matched with the time-averaged enthalpy probe measurements.
IV. CONCLUSIONS
More precise 3D transient numerical simulations based on the MHD theory have been carried out along with enthalpy probe measurements made on the ejected thermal plasma jets in order to verify applicability or limitation of the conventional assumption of axis-symmetry and stationary state in the course of numerical modeling on plasma torches with hollow electrodes. The 3D simulation results apparently reveal that the 3D distribution of arc currents brings about the inherent 3D and turbulence nature of arc discharge. It is also found that the constricted arc column near the vortex chamber plays an important role in heating and acceleration of injected arc gases by concentrating arc currents on the centerline of the hollow electrodes. Moreover, it is believed that both the constricted arc column near the vortex chamber and the enhanced mixing effects of the strong turbulence flow are responsible for the gradual relaxation of the 3D structures of plasma fields into the 2D axisymmetric fields. A comparative study between the 2D and 3D simulations is carried out and the results have shown that the arc root configuration seems to have a significant effect on the heattransfer mechanism inside the torch by interacting with the turbulence flow. The turbulence phenomena in the 2D simu-
Author complimentary copy. Redistribution subject to AIP license or copyright, see http://php.aip.org/php/copyright.jsp
023501-13
lation are somewhat underestimated and the amount of heat transferred to the cold anode wall is calculated to be smaller than that of the 3D case. The comparison of the calculated results with experimentally measured ones is made to ensure the calculation accuracies of the numerical models and to confirm the derived 3D numerical predictions. These comparison results obviously demonstrate that the numerical results derived in this work are quite reasonable, and the 3D simulation is more accurate than the 2D simulation by precisely describing the turbulent phenomena inside the torch using a more realistic model of arc root attachment with a 3D highly localized configuration on the electrode wall surface. Finally, it is suggested from the results of this comparative study that the 3D transient formulation is indeed required for predicting the fundamental arc discharge phenomena inside the torch, but the 2D stationary approach seems to be more useful for getting practical information of thermal plasma characteristics outside the torch. ACKNOWLEDGMENTS
This work was supported by the Ministry of Science and Technology in Korea. 1
Phys. Plasmas 15, 023501 共2008兲
Comparative study of two- and three-dimensional…
O. P. Solonenko and M. F. Zhukov, Thermal Plasma and Materials Technology 共Cambridge Interscience, Cambridge, 1994兲. 2 P. Fauchais and A. Vardelle, IEEE Trans. Plasma Sci. 25, 1258 共1997兲. 3 P. Fauchais, in Thermal Plasmas for Hazardous Waste Treatment, edited by R. Benocci, G. Bonizzoni, and E. Sindoni 共World Scientific, Singapore, 1996兲, pp. 1–38. 4 C. Tzeng, Y. Kuo, T. Huang, D. Lin, and Y. YU, J. Hazard. Mater. 58, 207 共1998兲. 5 G. Bonizzoni, Pure Appl. Chem. 71, 1879 共1999兲. 6 M. Y. A. Mollah, R. Schennach, J. Patscheider, S. Promreuk, and D. L. Cocke, J. Hazard. Mater. 79, 301 共2000兲. 7 B. Min, J. Korean Nucl. Soc. 35, 482 共2003兲. 8 M. Hur, K. S. Kim, and S. H. Hong, Plasma Sources Sci. Technol. 12, 255 共2003兲. 9 P. R. Taylor, M. Manrique, S. A. Pirzada, and M. Abdel-Latif, Plasma Chem. Plasma Process. 15, 545 共1999兲.
10
D. Harbec, J-L. Meunier, L. Guo, R. Gauvin, and N. El Mallah, J. Phys. D 37, 2121 共2004兲. 11 K. S. Kim, S. H. Hong, K. Lee, and W. T. Ju, IEEE Trans. Plasma Sci. 35, 434 共2007兲. 12 S. W. Chau, K. L. Hsu, D. L. Lin, and C. C. Tzeng, J. Phys. D 40, 1944 共2007兲. 13 M. F. Zhukov, in Thermal Plasma and New Materials Technology, edited by O. P. Solonenko and M. F. Zhukov 共Cambridge Interscience, Cambridge, 1994兲, pp. 9–43. 14 J. F. Brilhac, B. Pateyron, J. F. Coudert, P. Fauchais, and A. Bouvier, Plasma Chem. Plasma Process. 15, 257 共1995兲. 15 M. Hur and S. H. Hong, J. Phys. D 35, 1946 共2002兲. 16 J. M. Park, K. S. Kim, T. H. Hwang, and S. H. Hong, IEEE Trans. Plasma Sci. 32, 479 共2004兲. 17 G. Mariaux and A. Vardelle, Int. J. Therm. Sci. 44, 357 共2005兲. 18 C. Chazelas, E. Moreau, G. Mariaux, and A. Vardelle, High Temp. Mater. Processes 共N.Y., NY, U.S.兲 10, 393 共2006兲. 19 J. P. Trelles, E. Pfender, and J. V. R. Heberlein, Plasma Chem. Plasma Process. 26, 557 共2006兲. 20 J. P. Trelles and J. V. R. Heberlein, J. Therm. Spray Technol. 15, 563 共2006兲. 21 J. P. Trelles, E. Pfender, and J. V. R. Heberlein, J. Phys. D 40, 5635 共2007兲. 22 J. P. Trelles, J. V. R. Heberlein, and E. Pfender, J. Phys. D 40, 5937 共2007兲. 23 S. Paik, P. C. Huang, J. Heberlein, and E. Pfender, Plasma Chem. Plasma Process. 13, 379 共1993兲. 24 K. D. Kang and S. H. Hong, IEEE Trans. Plasma Sci. 24, 89 共1996兲. 25 D. A. Scott, P. Kovitya, and G. N. Haddad, J. Appl. Phys. 66, 5232 共1989兲. 26 B. E. Launder and D. B. Spalding, Lectures in Mathematical Models of Turbulence 共Academic, New York, 1972兲, pp. 90–110. 27 A. B. Murphy and C. J. Arundell, Plasma Chem. Plasma Process. 14, 451 共1994兲. 28 H. Li, E. Pfender, and X. Chen, J. Phys. D 36, L1084 共2003兲. 29 S. R. Mathur and J. Y. Murthy, Numer. Heat Transfer, Part B 31, 195 共1997兲. 30 E. Pfender, Thin Solid Films 238, 228 共1994兲. 31 J. Grey and P. F. Jacobs, AIAA J. 2, 433 共1964兲. 32 M. Brossa and E. Pfender, Plasma Chem. Plasma Process. 1, 75 共1988兲. 33 W. D. Swank, J. R. Fincke, and D. C. Haggard, Rev. Sci. Instrum. 64, 56 共1993兲. 34 W. L. T. Chen, J. Heberlein, and E. Pfender, Plasma Chem. Plasma Process. 14, 317 共1993兲. 35 M. Rahmane, G. Soucy, and M. I. Boulos, Rev. Sci. Instrum. 66, 3424 共1995兲.
Author complimentary copy. Redistribution subject to AIP license or copyright, see http://php.aip.org/php/copyright.jsp