Using Threshold and Quantile Weighted. Scoring Rules. Tilmann Gneiting and Roopesh Ranjan. Technical Report no. 533. Department of Statistics, University ...
Comparing Density Forecasts Using Threshold and Quantile Weighted Scoring Rules Tilmann Gneiting and Roopesh Ranjan
Technical Report no. 533 Department of Statistics, University of Washington
April 2008 Abstract We propose a method for comparing density forecasts that is based on weighted versions of the continuous ranked probability score. The weighting emphasizes regions of interest, such as the tails or the center of a variable’s range, while retaining propriety, as opposed to a recently developed weighted likelihood ratio test, which can be hedged. Threshold and quantile based decompositions of the continuous ranked probability score can be illustrated graphically and prompt insights into the strengths and deficiencies of a forecasting method. We illustrate the use of the test and graphical tools in case studies on the Bank of England’s density forecasts of quarterly inflation rates in the United Kingdom, and probabilistic predictions of wind resources in the Pacific Northwest. KEY WORDS: Continuous ranked probability score; Predictive ability testing; Probabilistic forecast; Proper scoring rule; Quantile; Weighted likelihood ratio test
1
Introduction
One of the major tasks of statistical analysis is to make forecasts for the future. To realize their full potential, forecasts ought to be probabilistic in nature, taking the form of probability distributions over future quantities or events (Dawid 1984). Here we are concerned with density forecasts of a continuous variable, such as inflation rate, gross domestic product, temperature or wind speed, to name but a few examples. With the continued proliferation of probabilistic forecasts in economic, environmental and meteorological applications, among others, there is a critical need for principled techniques for the comparison and ranking of density forecasts (Timmermann 2000; Elliott and Timmermann 2008; Gneiting 2008). 1
Following Amisano and Giacomini (2007), we consider density forecasts in a time series context, in which a rolling window consisting of the past m observations is used to fit a density forecast for the observation that is k time steps ahead. Specifically, suppose that Z 1 , . . . , Z T is a stochastic process which can be partitioned as Z t = (Yt , X t ) where Yt is the variable of interest and X t is a vector of predictors. Suppose that T = m + n + k. At times t = m, . . . , m + n, density forecasts fˆt+k and gˆt+k for Yt+k are generated, each of which depends only on Z t−m+1 , . . . , Z t . In this framework, the only requirement imposed on how the forecasts are produced is that they are measurable functions of the data in the rolling estimation window. We are interested in comparing and ranking the competing density forecasting methods. The comparison typically uses a proper scoring rule. A scoring rule is a loss function S(f, y) whose arguments are the density forecast f and the realization y of the future observation Y . The density forecast is ideal if the sampling density of Y is indeed f . Diebold, Gunther and Tay (1998) argue powerfully that the ideal forecaster is preferred by any rational user, irrespectively of the cost-loss structure at hand. Hence, it is critically important that a scoring rule be proper, in the sense that Z Ef S(f, Y ) = f (y) S(f, y) dy Z ≤ f (y) S(g, y) dy = Ef S(g, Y ) (1) for all density functions f and g. A scoring rule is strictly proper if (1) holds, with equality if and only if f = g almost surely. Clearly, a strictly proper scoring rule prefers the ideal forecaster over any other. Prominent examples of strictly proper scoring rules include the logarithmic, quadratic, spherical, and continuous ranked probability scores (Matheson and Winkler 1976; Winkler 1996; Gneiting and Raftery 2007). We take scoring rules to be negatively oriented penalties, so the lower, the better. Density forecast methods are then ranked by comparing their average scores. Specifically, if f Sn
m+n−k m+n−k X X 1 1 g ˆ S(ft+k , yt+k ) and Sn = S(ˆ gt+k , yt+k ), = n − k + 1 t=m n − k + 1 t=m f
g
then we prefer f if Sn < Sn , and prefer g otherwise. Amisano and Giacomini (2007) consider tests of equal forecast performance based on the test statistic f
g
√ S − Sn , tn = n n σˆn
(2)
where σ ˆn2
1 = n
k−1 X
m+n−|j|
j=−(k−1)
X t=m
∆t,k ∆t+|j|,k
and ∆t,k = S(fˆt+k , yt+k ) − S(ˆ gt+k , yt+k ), 2
(3)
Table 1: Weighted likelihood ratio tests for density forecasts for the conditionally het2 eroscedastic process (5). The density forecast fˆt+1 = N (0, σ ˆt+1 ) is estimated under the 1 2 correct model assumption. Its competitor gˆt+1 = N (0, 2 σ ˆt+1 ) uses a deliberately misspecified predictive variance. The width of the sliding training window is m = 100, and we consider n = 900 one-step-ahead density forecasts. Counterintuitive test statistics are shown in bold. See text for details. Weight Function w0 (x) = 1 w1 (x) = φ(x) w2 (x) = 1 − φ(x)/φ(0) w3 (x) = Φ(x) w4 (x) = 1 − Φ(x)
Emphasis uniform center tails right tail left tail
f
Sn 1.312 0.294 0.575 0.667 0.645
g
Sn 1.490 0.267 0.759 0.633 0.542
σ ˆn 0.862 0.100 0.645 0.535 0.510
tn −6.20 7.98 −9.69 −4.73 −4.34
P < 0.001 < 0.001 < 0.001 < 0.001 < 0.001
as proposed by Diebold and Mariano (1995). Assuming suitable regularity conditions, the statistic tn is asymptotically standard normal under the null hypothesis of vanishing expected score differentials. In the case of rejection, f is chosen if tn is negative and g is chosen if tn is positive.1 What scoring rule should be used? Amisano and Giacomini (2007) consider a weighted logarithmic scoring rule, � � y−µ S(f, y) = w S0 (f, y), (4) σ where w is a fixed, nonnegative weight function, µ and σ are estimates of the unconditional mean and standard deviation of the predictand, based on the past m observations, and S0 is the logarithmic scoring rule, S0 (f, y) = − log f (y). The weight function emphasizes regions of interest, such as the tails or the center of a variable’s range. With φ and Φ denoting the standard normal probability density and cumulative distribution function, the weight functions w1 (x) = φ(x), w2 (x) = 1 − φ(x)/φ(0), w3 (x) = Φ(x) and w4 (x) = 1 − Φ(x) emphasize the center, the tails, the right tail and the left tail, respectively. The approach of Mitchell and Hall (2005) and Bao, Lee and Salto˘glu (2007) employs the unweighted, original logarithmic score. The weighting approach seems appealing; however, it corresponds to the use of an improper scoring rule and incurs misguided inferences. For instance, consider the GARCH(1,1) process Y1 , Y2 , . . ., where Yt+1 = ǫt+1 ,
2 ), ǫt+1 ∼ N (0, σt+1
2 σt+1 = αǫ2t + βσt2 + γ.
(5)
Following Christoffersen and Diebold (1996), we set the GARCH parameters at α = 0.2 and β = 0.75, which are typical of estimates reported in the literature, and we let γ = 0.05, which 1
Amisano and Giacomini (2007) use the logarithmic score in positive orientation, so they choose f if tn is negative and g if tn is positive.
3
normalizes the unconditional process variance to 1.2 The rolling estimation window is of size m = 100, and we consider n = 900 density forecasts at the prediction horizon k = 1. The density forecast fˆt+1 is Gaussian with mean zero and variance σˆ 2 , which is derived from a GARCH fit for (5). Except for uncertainty in parameter estimation, this is the ideal density forecast. In contrast, the density forecast gˆt+1 is Gaussian with mean zero and variance one half time times σ ˆ 2 , deliberately misspecifying the conditional variance. Results for the weighted likelihood ratio test are shown in Table 1. Using the weight functions w0 , w2 , w3 and w4 the test prefers f , as expected. With weight function w1 , the test prefers the misspecified density forecast g, which is a counterintuitive result. The goal of this paper is to propose a test that adopts the weighting approach of Amisano and Giacomini (2007), avoids misguided inferences, and comes with associated graphical tools that can be used to diagnose strengths and weaknesses of a forecasting method. We retain the test statistic (2), but base our test on appropriately weighted, proper versions of the continuous ranked probability score (CRPS; Matheson and Winkler 1976; Gneiting and Raftery 2007; Laio and Tamea 2007). Any density forecast f induces a probability forecast for the binary event {Y ≤ z} via the value of the associated cumulative distribution function (CDF) Z z
F (z) =
f (y) dy
−∞
at the threshold z ∈ R. Similarly, it induces the quantile forecast F −1 (α) at the level α ∈ (0, 1). The continuous ranked probability score is then defined as Z ∞ Z 1 CRPS(f, y) = PS(F (z), I{y ≤ z}) dz = QSα (F −1(α), y) dα, (6) −∞
0
where PS(p, I{y ≤ z}) = (p − I{y ≤ z})2
is the Brier probability score (Selten 1998; Gneiting and Raftery 2007) for a probability forecast p of the binary event {Y ≤ z} at the threshold z ∈ R, and QSα (q, y) = 2(I{y < q} − α)(q − y) is the quantile score (Gneiting and Raftery 2007) for a quantile forecast q at the level α ∈ (0, 1). Here and in the following, the symbol I stands for an indicator function. Following Matheson and Winkler (1976) and Gneiting and Raftery (2007), it is straightforward to construct weighted versions of the continuous ranked probability score (6) that emphasize regions of interest and retain propriety. A threshold weighted version of the continuous ranked probability score is obtained as Z ∞ S(f, y) = PS(F (z), I{y ≤ z}) u(z) dz, (7) −∞
2
See Engle (1982) and Bollerslev (1986) for details on ARCH and GARCH processes. We set the initial √ conditional variance equal to 609/7, that is, the unconditional variance plus one standard deviation of the conditional variance, and discard the first 1,000 values.
4
Table 2: Weighted CRPS tests for density forecasts for the conditionally heteroscedastic 2 process (5). The density forecast fˆt+1 = N (0, σ ˆt+1 ) is estimated under the correct model 1 2 assumption. Its competitor gˆt+1 = N (0, 2 σ ˆt+1 ) uses a deliberately misspecified predictive variance. The width of the sliding training window is m = 100, and we consider n = 900 one-step-ahead density forecasts. In contrast to the weighted likelihood ratio test, all tests prefer f over g. Threshold Weight u0 (y) = 1 u1 (y) = φ(y) u2 (y) = 1 − φ(y)/φ(0) u3 (y) = Φ(y) u4 (y) = 1 − Φ(y) Quantile Weight v0 (q) = 1 v1 (q) = q(1 − q) v2 (q) = (2q − 1)2 v3 (q) = q 2 v4 (q) = (1 − q)2
Emphasis uniform center tails right tail left tail
Emphasis uniform center tails right tail left tail
f
g
Sn 0.511 0.153 0.129 0.258 0.254
Sn 0.521 0.155 0.132 0.262 0.259
f
g
Sn 0.511 0.100 0.113 0.157 0.155
Sn 0.521 0.101 0.118 0.161 0.159
σ ˆn 0.070 0.018 0.030 0.046 0.046
σ ˆn 0.070 0.009 0.036 0.041 0.041
tn −3.95 −4.24 −2.88 −2.83 −3.24
tn −3.95 −2.79 −4.85 −2.53 −3.00
P < 0.001 < 0.001 0.004 0.005 0.001 P < 0.001 0.005 < 0.001 0.014 0.003
where u is a nonnegative weight function on the real line. Similarly, a quantile weighted version is obtained as Z 1 S(f, y) = QSα (Fα−1 , y) v(α) dα, (8) 0
where v is a nonnegative weight function on the unit interval. For a constant weight function, both (7) and (8) reduce to the unweighted score (6). Table 2 returns to the simulation study for the GARCH model (5) and reports results based on the test statistic (2) and threshold or quantile weighted versions of the continuous ranked probability score, which are proper, as opposed to the weighted logarithmic score. In contrast to the results for the weighted likelihood ratio test, all tn values in Table 2 are negative, favoring the nearly ideal density forecast f over its deliberately misspecified competitor g. The remainder of the paper is organized as follows. In Section 2 we show that the weighted likelihood ratio test incurs the use of an improper scoring rule, and explore ways in which the test can be hedged. In Section 3 we study threshold and quantile weighted versions of the continuous ranked probability score in further detail, and discuss conditions under which the test statistic tn is asymptotically standard normal. We also note graphical representations of the threshold and quantile decomposition of the continuous ranked probability score, which can be used diagnostically to assess strengths and deficiencies of forecasting techniques. 5
Section 4 applies these methods to compare density forecasts for quarterly inflation rates in the United Kingdom and wind resources in the North American Pacific Northwest. The paper closes with a discussion in Section 5.
2
Hedging strategies for the weighted likelihood ratio test
Recall that a scoring rule S(f, y) for a density forecast is proper if Z Ef S(f, Y ) = f (y) S(f, y) dy Z ≤ f (y) S(g, y) dy = Ef S(g, Y ) for all density functions f and g. It is strictly proper if the above holds, with equality if and only if f = g almost surely. Examples of proper scoring rules for density forecasts include the logarithmic score, S(f, y) = − log f (y), the quadratic score, S(f, y) = −2f (y) + kf k2 , and the spherical score S(f, y) = −f (y)/kf k, where �Z ∞ �1/2 2 kf k = f (y) dy . −∞
The continuous ranked probability score and its weighted versions are also proper (Matheson and Winkler 1976; Gneiting and Raftery 2007). The following result shows that if S0 (f, y) is a strictly proper scoring rule, then its product with a weight function w(y) is improper, unless the weight function is constant. Theorem 2.1. Suppose that f is the sampling density of the random variable Y . Let S0 be R any proper scoring rule and let w be a weight function such that 0 < w(y)f (y) dy < ∞. Then the expected value of the weighted score S(g, Y ) = w(Y ) S0 (g, Y ) is minimized if we issue the density forecast g(y) = R
w(y)f (y) . w(y)f (y) dy
Proof. Let h be any density forecast. Then Z Z Z Ef S(g, Y ) = w(y)f (y) S0(g, y) dy = w(y)f (y) dy g(y) S0(g, y) dy Z Z Z ≤ w(y)f (y) dy g(y) S0(h, y) dy = w(y)f (y) S0(h, y) dy = Ef S(h, Y ), where the inequality reflects the propriety of S0 . 6
(9)
Table 3: Weighted likelihood ratio tests for density forecasts for the conditionally het2 eroscedastic process (5). The density forecast fˆt+1 = N (0, σ ˆt+1 ) is estimated under the correct model assumption. Its competitor gˆt+1 is deliberately misspecified as described in (10). Counterintuitive test statistics are shown in bold. See text for details. Weight Function w0 (x) = 1 w1 (x) = φ(x) w2 (x) = 1 − φ(x)/φ(0) w3 (x) = Φ(x) w4 (x) = 1 − Φ(x)
Emphasis uniform center tails right tail left tail
f
Sn 1.312 0.294 0.575 0.667 0.645
g
Sn 1.611 0.436 0.518 0.744 0.867
σ ˆn tn 0.727 −12.31 0.215 −19.84 0.331 5.23 0.515 −4.48 0.310 −21.51
P < 0.001 < 0.001 < 0.001 < 0.001 < 0.001
In particular, we are now in a position to explain the failure of the weighted likelihood ratio test in the simulation example in the introduction. The weighted logarithmic score (4) is similar to the composite scoring rule (9) where S0 is the logarithmic score, and the composite score is improper, unless the weight function is constant. Moreover, Theorem 2.1 suggests a hedging strategy if forecasters are compared by the weighted likelihood ratio test, namely to issue the density function g that is proportional to the product of the forecaster’s true belief, f , and the weight function, w. For example, if both f = φ and w = φ are standard normal, the suggested hedge uses a normal density function g with mean zero and variance one half. Essentially, this is the situation in the simulation study in the introduction. The misspecified density forecast gˆt+1 halves the estimated Gaussian variance; hence, to a good degree of approximation, it is proportional to the product of the true belief fˆt+1 and the weight function w1 = φ. Not surprisingly, the weighted likelihood ratio test with weight function w1 fails. Before closing this section, we present another simulation study in which the weighted likelihood ratio test yields counterintuitive results. Once again, we study density forecasts for the conditionally heteroscedastic process (5) with parameter values α = 0.2, β = 0.75 and γ = 0.05. The rolling estimation window is of size m = 100, and we issue n = 900 density forecasts at the prediction horizon k = 1. As previously, the density forecast fˆt+1 is 2 Gaussian with mean zero and variance σ ˆt+1 , derived from a GARCH fit under the correct model specification. Except for estimation uncertainty, this is the ideal density forecast. Its competitor is the density forecast gˆt+1 , which is deliberately misspecified as � � 1 1 gˆt+1 (y) = fˆt+1 (y) I{y < −ˆ σt+1 } + I{|y| ≤ σ ˆt+1 } + I{y > σ ˆt+1 } . (10) 2 2(1 − Φ(1)) Note that gˆt+1 is identical to fˆt+1 in the left tail, underspecifies the center of the distribution, and makes this up in the right tail. Table 3 shows results for the weighted likelihood ratio test, which are misguided and inconsistent. Specifically, the test suggests that both in the left tail and in the right tail f is preferable. Looking at both tails simultaneously, the test stipulates that g is better. 7
3 3.1
Weighting and testing with the continuous ranked probability score Threshold and quantile weighting for the continuous ranked probability score
Suppose that the density forecast is f and y realizes. Let F denote the CDF associated with the density f , and write F −1 (α) for the quantile at level α ∈ (0, 1). The continuous ranked probability score then can be defined in three equivalent ways, as 1 CRPS(f, y) = EF |Y − y| − EF |Y − Y ′ | 2 Z ∞ = (F (z) − I{y ≤ z})2 dz −∞ Z 1 = 2 (I{y < F −1 (α)} − α)(F −1 (α) − y) dα,
(11) (12) (13)
0
where Y and Y ′ are independent random variables with common distribution F . Gneiting and Raftery (2007) showed the equivalence of the kernel score representation (11) and the standard form (12), to which we refer as the threshold decomposition of the continuous ranked probability score. The equivalence to (13), to which we refer as the quantile decomposition of the score, was noted by Laio and Tamea (2007). Both (11) and (13) show that the continuous ranked probability score is reported in the same unit as the observations. The score is strictly proper within the class of forecast densities that have finite first moment, and attains an infinite value otherwise. It applies to predictive distributions with discrete components and reduces to the absolute error in the case of a point forecast. The integrand in (12) equals the quadratic or Brier probability score (Selten 1998; Gneiting and Raftery 2007) PS(p, I{y ≤ z}) = (p − I{y ≤ z})2
for the probability forecast p = F (z) of the binary event {Y ≤ z} at the threshold z ∈ R. The integrand in (13) equals the quantile score QSα (q, y) = 2(I{y < q} − α)(q − y) for the quantile forecast q = F −1 (α) (Cervera and Mu˜ noz 1996; Gneiting and Raftery 2007). It has also been referred to as the tick loss function (Giacomini and Komunjer 2005) or, more traditionally, as the asymmetric linear or lin-lin loss function (Koenker and Basset 1978; Christoffersen and Diebold 1996). Using the Brier probability score, we define threshold weighted versions of the continuous ranked probability score as Z ∞ S(f, y) = PS(F (z), I{y ≤ z}) u(z) dz, (14) −∞
8
Table 4: Proposed weight functions for threshold and quantile weighted versions of the continuous ranked probability score. The threshold weight functions are specified in terms of the probability density function φa,b and the cumulative distribution function Φa,b of the normal distribution with mean a and standard deviation b. Emphasis center tails right tail left tail
Threshold Weight Function u1 (y) = φa,b (y) u2 (y) = 1 − φa,b (y)/φa,b(0) u3 (y) = Φa,b (y) u4 (y) = 1 − Φa,b (y)
Quantile Weight Function v1 (q) = q(1 − q) v2 (q) = (2q − 1)2 v3 (q) = q 2 v4 (q) = (1 − q)2
where u is a nonnegative weight function on the real line; if u ≡ 1, this reduces to the unweighted score (12). Table 4 lists some potential weight functions that emphasize the center or tails of a variable’s range. The threshold weight functions resemble the suggestions of Amisano and Giacomini (2007); however, in our implementation, the parameters are fixed and user specified, depending on the application at hand. For instance, in the case of inflation rates we set the location parameter a at the policy target. If the weight function is integrable, such as in the case of the center weight function φa,b , the threshold-weighted continuous ranked probability score (14) is finite and bounded by the integral of the weight function. Other options for integrable weight functions with center emphasis include t and Laplace densities. Similarly, we define quantile weighted versions of the continuous ranked probability score as Z 1 S(f, y) = QSα (F −1 (α), y) v(α) dα, (15) 0
where v is a nonnegative weight function on the unit interval. If v ≡ 1, we recover the unweighted score (13). Table 4 suggests weight functions with center or tail emphasis. The two weighting approaches can be traced back at least to Matheson and Winkler (1976); they retain propriety, because convex sums and limits of proper scoring rules remain proper. The threshold weighting idea is also employed by Corradi and Swanson (2006a, pp. 194–195), though their emphases and terminology differ from ours. Closed form expressions for the evaluation of (14) or (15) may or may not be available; however, the computation of a suitably discretized approximate version is always feasible, to any degree of accuracy. In the case of threshold weighting, we approximate (14) by I yu − yl yu − yl X w(yi) PS(F (yi), I{y ≤ yi }) where yi = yl + i S(f, y) = I − 1 i=1 I
(16)
and (yl , yu ) is the range of interest. In the case of the quantile weighted score, we approximate
9
the integral in (15) by a discrete version, J−1
1 X j S(f, y) = v(αj ) QSαj (F −1 (αj ), y) where αj = . J − 1 j=1 J
(17)
Note that the discrete versions themselves are proper scoring rules, that arise as special cases in (14) and (15) if the integral is taken with respect to a discrete Stieltjes measures rather than a weight function.
3.2
Asymptotic normality of the test statistic
Following Amisano and Giacomini (2007), we consider tests of equal forecast performance based on the test statistic f g √ Sn − Sn , tn = n σˆn where f Sn
m+n−k m+n−k X X 1 1 g ˆ = S(ft+k , yt+k ) and Sn = S(ˆ gt+k , yt+k ) n − k + 1 t=m n − k + 1 t=m
(18)
and σˆn2 is defined in (3). Under general conditions, tn is asymptotically standard normal under the null hypothesis of vanishing expected score differentials, and the test will reject with probability tending to 1 under a fixed alternative. When S is a weighted logarithmic rule, Amisano and Giacomini (2007) prove these claims under regularity assumptions3 , which include a mixing condition on the process {Z t } defined in the introduction, boundedness of the weight function, consistency of σˆn2 as an estimate of √ f g σn2 = var( n (Sn − Sn )) > 0, and moment conditions. In our case, in which S is a weighted version of the continuous ranked probability score, the same result holds, except for the moment condition, which now requires that Efˆt+k |X|,
E gˆt+k |X| and Et+k |Yt+k |2r
are finite for all t,
(19)
where the power r ≥ 2 depends on the mixing condition. In the case of threshold weighting with an integrable (rather than just bounded) weight function, the moment condition can be 3
Amisano and Giacomini consider the case k = 1 only. The extension to a general prediction horizon k ≥ 1 is straightforward. We wish to emphasize that our aforementioned concerns are not with the asymptotic arguments in Amisano and Giacomini (2007) nor with the weighting idea, which is appealing indeed. However, we disagree with the particular choice of a weighted logarithmic scoring rule for the test, which can lead to rejection in favor of an inferior forecast.
10
dropped. In analogy to the arguments of Amisano and Giacomini (2007), these results can be proved by verifying the assumptions of Theorem 4 of Giacomini and White (2006). The only novel argument is in the derivation of the moment condition (19), which is presented in an appendix. In practical applications, the full set of assumptions cannot be verified; yet, the assumptions are plausible as approximations. Recall that the continuous ranked probability score attains an infinite value if the forecast density has infinite first moment. In this light, the first two conditions in (19) assure that each individual score is finite. The third condition stipulates that the true data generating density has a finite moment of order 2r, where typically one can take r = 2. Hence, as a rule of thumb, the normal approximation for tn is appropriate, unless the forecast densities have infinite moments of low order. In the case of threshold weighting with an integrable weight function, the moment condition can just be ignored. Table 5 summarizes results for weighted CRPS tests in the simulation example of Section 2. The density forecasts fˆt+1 and gˆt+1 and the true data generating density have Gaussian tails, so the normal approximation for tn is justified. In contrast to the respective results for weighted likelihood ratio tests, all tn values are strongly negative, favoring f over its deliberately misspecified competitor g.
3.3
Forecast diagnostics via threshold and quantile decomposition
The threshold and quantile decompositions of the continuous ranked probability score carry over to mean scores, and in the latter form they can be used diagnostically, to assess strengths and deficiencies of density forecasting techniques. Consider a mean score of the form (18). The threshold decomposition (12) applies to the mean score, in that Z ∞ f f (20) CRPSn = PSn (z) dz −∞
where f PSn (z)
m+n−k X 1 PS(Fˆt+k (z), yt+k ) = n − k + 1 t=m
(21)
denotes the mean Brier probability score for the probability forecast of the binary event {Yt+k ≤ z} at the threshold z ∈ R. Schumacher, Graf and Gerds (2003) and Gneiting, Balabdaoui and Raftery (2007) proposed a plot of the mean Brier score (21) versus z as a diagnostic tool and coined the terms prediction error curve and Brier score plot, respectively. The representation (20) shows that the plot illustrates the threshold decomposition of the continuous ranked probability score. Similarly, the quantile decomposition (13) suggests the representation Z 1 f f CRPSn = QSn (α) dz, 0
11
(22)
where f
QSn (α) =
m+n−k X 1 −1 QSα (Fˆt+k (α), yt+k ). n − k + 1 t=m
(23)
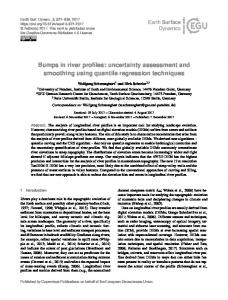
Laio and Tamea (2007) proposed a plot of the mean quantile score (23) versus α as a diagnostic tool in the assessment of density forecasts. We adopt their suggestion and note that it illustrates the quantile decomposition (22) of the continuous ranked probability score. Figure 1 applies the threshold decomposition (20) and quantile decomposition (22) to the density forecasting techniques f and g in the simulation study described in Sections 2 and 3.2. It is apparent that f and g are on equal footing in the lower tail, but f is superior in the center, which is in accordance with (10). As shown in Table 5, the mean continuous ranked probability score is 0.483 for f and 0.592 for g; this equals the integral under the respective curves. The weighted scores in the table correspond to weighted integrals.
4
Case studies
4.1
Bank of England projections of quarterly inflation rates
The Bank of England’s Monetary Policy Committee (MPS) has issued probabilistic forecasts of inflation rates and gross domestic product every quarter since February 1996 and November 1997, respectively, using fan charts to visualize the deciles of the predictive distributions (Wallis 2003, 2004; Clements 2004; Elder, Kapetanios, Taylor and Yates 2005; Mitchell and Hall 2005).4 We compare the Bank of England’s density forecasts of inflation rates (RPIX) to those derived from a simplistic autoregressive time series model. The Bank of England employs potentially asymmetric two-piece normal distributions with parameters µ ∈ R and σ1 , σ2 > 0 and forecast density � � � � 2 −1/2 π (y − µ) −1 if y ≤ µ, (σ1 + σ2 ) exp − 2 2σ12 f (y) = � � � π �−1/2 (y − µ)2 −1 if y ≥ µ. (σ1 + σ2 ) exp − 2 2σ22
The simplistic competitor is a Gaussian autoregression of order one that uses a rolling estimation window of length m = 6 quarters. This method results in Gaussian density forecasts. 4
The quarterly Bank of England inflation report is available online at http://www.bankofengland. co.uk/publications/inflationreport/. Archived forecasts can be downloaded at http://www.bankof england.co.uk/publications/inflationreport/irprobab.htm. Observed RPIX inflation rates are available at http://www.statistics.gov.uk/StatBase/tsdataset.asp?vlnk=7173&More=Y under Office of National Statistics code CDKQ. The rates are percentage changes over 12 months. The first quarter ranges from March to May, the second from June to August, and so on.
12
Table 5: Threshold and quantile weighted CRPS tests for density forecasts for the condition2 ally heteroscedastic process (5). The density forecast fˆt+1 = N (0, σ ˆt+1 ) is estimated under the correct model assumption. Its competitor gˆt+1 is deliberately misspecified as described in (10). Threshold Weight u0 (y) = 1 u1 (y) = φ(y) u2 (y) = 1 − φ(y)/φ(0) u3 (y) = Φ(y) u4 (y) = 1 − Φ(y) Quantile Weight v0 (q) = 1 v1 (q) = q(1 − q) v2 (q) = (2q − 1)2 v3 (q) = q 2 v4 (q) = (1 − q)2
f
Emphasis uniform center tails right tail left tail
Emphasis uniform center tails right tail left tail
g
Sn 0.511 0.153 0.129 0.258 0.254
Sn 0.625 0.184 0.163 0.343 0.281
f
g
Sn 0.511 0.100 0.113 0.157 0.155
Sn 0.625 0.125 0.125 0.198 0.177
tn −10.72 −10.01 −10.39 −11.33 −8.39
σˆn tn 0.317 −10.72 0.069 −10.99 0.045 −7.98 0.116 −10.44 0.069 −9.60
P < 0.001 < 0.001 < 0.001 < 0.001 < 0.001 P < 0.001 < 0.001 < 0.001 < 0.001 < 0.001
1.0
Quantile Decomposition
0.30
Threshold Decomposition
f g
0.05
0.6 0.4 0.2
0.10
0.15
Quantile Score
0.20
0.8
0.25
f g
0.0
0.00
Brier Probability Score
σ ˆn 0.317 0.095 0.097 0.227 0.098
−3
−2
−1
0
1
2
3
0.0
Threshold
0.2
0.4
0.6
0.8
1.0
Quantile
Figure 1: Threshold and quantile decomposition of the mean continuous ranked probability score for density forecasts for the conditionally heteroscedastic process (5). The density 2 forecast fˆt+1 = N (0, σ ˆt+1 ) is estimated under the correct model assumption. Its competitor gˆt+1 is deliberately misspecified as described in (10). 13
Threshold Decomposition
Quantile Decomposition
0.2 0.0
0.1
0.05
0.10
0.15
Quantile Score
0.3
0.20
BoE AR
0.00
Brier Probability Score
BoE AR
1
2
3
4
5
6
7
0.0
0.2
0.4
Threshold in Percent
0.6
0.8
1.0
Quantile
Figure 2: Threshold and quantile decomposition of the mean continuous ranked probability score for Bank of England (BoE) and autoregressive (AR(1)) density forecasts of inflation rates, at a prediction horizon of one quarter.
Table 6: Threshold and quantile weighted CRPS tests for density forecasts of inflation rates, at a prediction horizon of one quarter, in percent. The Bank of England forecast takes the role of f and the autoregressive benchmark the role of g. Threshold Weight u0 (y) = 1 u1 (y) = φ2.5,1 (y) u2 (y) = 1 − φ2.5,1 (y)/φ2.5,1(2) u3 (y) = Φ2.5,1 (y) u4 (y) = 1 − Φ2.5,1 (y) Quantile Weight v0 (q) = 1 v1 (q) = q(1 − q) v2 (q) = (2q − 1)2 v3 (q) = q 2 v4 (q) = (1 − q)2
Emphasis uniform center tails right tail left tail
Emphasis uniform center tails right tail left tail
BoE
Sn 0.112 0.022 0.026 0.033 0.036
14
BoE
Sn 0.112 0.041 0.010 0.061 0.051 AR
Sn 0.246 0.049 0.050 0.077 0.071
AR
Sn 0.246 0.081 0.044 0.152 0.094 σ ˆn 0.248 0.050 0.049 0.078 0.076
σ ˆn 0.248 0.064 0.137 0.200 0.076 tn −3.62 −3.67 −3.35 −3.78 −3.12
tn −3.62 −4.16 −1.69 −3.07 −3.75
P < 0.001 < 0.001 0.090 0.002 < 0.001
P < 0.001 < 0.001 < 0.001 < 0.001 0.002
Quantile Decomposition BoE AR
0.4 0.3 0.2 0.0
0.1
0.1
0.2
Quantile Score
0.3
0.5
BoE AR
0.0
Brier Probability Score
0.4
Threshold Decomposition
1
2
3
4
5
6
7
0.0
0.2
Threshold in Percent
0.4
0.6
0.8
1.0
Quantile
Figure 3: Threshold and quantile decomposition of the mean continuous ranked probability score for Bank of England (BoE) and autoregressive (AR) density forecasts of inflation rates, at a prediction horizon of seven quarters.
Table 7: Threshold and quantile weighted CRPS tests for density forecasts of inflation rates, at a prediction horizon of seven quarters. The Bank of England forecast takes the role of f and the autoregressive benchmark the role of g. Threshold Weight u0 (y) = 1 u1 (y) = φ2.5,1 (y) u2 (y) = 1 − φ2.5,1 (y)/φ2.5,1(2) u3 (y) = Φ2.5,1 (y) u4 (y) = 1 − Φ2.5,1 (y) Quantile Weight v0 (q) = 1 v1 (q) = q(1 − q) v2 (q) = (2q − 1)2 v3 (q) = q 2 v4 (q) = (1 − q)2
Emphasis uniform center tails right tail left tail
Emphasis uniform center tails right tail left tail
BoE
Sn 0.304 0.057 0.077 0.108 0.083
15
BoE
Sn 0.304 0.102 0.049 0.170 0.134 AR
Sn 0.381 0.072 0.095 0.111 0.127
AR
Sn 0.381 0.129 0.057 0.226 0.155 σ ˆn 0.437 0.081 0.124 0.080 0.263
σ ˆn 0.437 0.131 0.166 0.324 0.148 tn −1.19 −1.23 −0.96 −0.24 −1.14
tn −1.19 −1.43 −0.30 −1.15 −0.99 P 0.235 0.217 0.338 0.813 0.255
P 0.235 0.152 0.761 0.251 0.321
7
50th and 90th Percentile Forecast
4
5
realized rate BoE AR
3
o oo
ooooo
o
oo
2
Percentage Increase
6
o
0
10
o
oo
o o
ooo
ooo
oooo
20
oo o
o
o o
30
oo
ooo
o oo
o
oooo
40
Quarter
Figure 4: Bank of England (BoE) and autoregressive (AR) forecasts of inflation rates, at a prediction horizon of seven quarters ahead, for the third quarter of 1994 through the third quarter of 2005. The plot shows the 50th and 90th percentiles of the density forecasts for the two methods along with the observed rates. Figure 2 and Table 6 compare the two methods at a prediction horizon of k = 1 quarters ahead, for a test period ranging from the first quarter of 1993 to the first quarter of 2004, for a total of n = 45 density forecast cases. Figure 2 shows the threshold and quantile decompositions (20) and (22) of the continuous ranked probability score for the two techniques. The Bank of England forecast has a clear edge at almost all thresholds and quantiles, with a mean continuous ranked probability score of 0.112%, as opposed to 0.246% for the autoregressive forecast. The integrals under the respective curves in Figure 2 equal these values. The superiority of the Bank of England forecast is corroborated by Table 6, which reports the results of weighted CRPS tests, using the weight functions of Table 4, where a = 2.5% equals the MPC’s 1997–2003 policy target and b = 1.0% reflects the relative constancy of the inflation rate during the evaluation period. Figure 3 and Table 7 show results at a prediction horizon of k = 7 quarters ahead, for the third quarter of 1994 (September through November) to the third quarter of 2005. Perhaps surprisingly, the dominance of the Bank of England forecast is much less pronounced. In Figure 3, the simplistic autoregressive forecast seems competitive at moderately large thresholds and quantiles. The mean continuous ranked probability score is 0.304% for the Bank of England forecast, as opposed to 0.382% for the autoregressive forecast. None of the tests in Table 7 rejects the null hypothesis of vanishing expected score differentials. To explain this we point at Figure 4, which shows quantiles of the two density forecasts at a prediction horizon of seven quarters along with the realized inflation rates. The 90th per16
centile of the Bank of England forecast was much too conservative, resulting in unnecessarily wide prediction intervals that are penalized by the scores.
4.2
Probabilistic forecasts of wind resources at the Stateline wind energy center
With the proliferation of wind power, probabilistic short-term forecasts of wind resources at wind energy sites are becoming a critical requirement. Gneiting, Larson, Westrick, Genton and Aldrich (2006) introduced the regime-switching space-time (RST) technique that merges meteorological and statistical expertise to obtain accurate and calibrated, fully probabilistic forecasts of wind speed and wind power. Briefly, the RST method identifies forecast regimes at the wind energy site and fits a conditionally heteroscedastic predictive model for each regime. Geographically dispersed meteorological observations in the vicinity of the wind farm are used as predictor variables. The forecast densities are truncated normal. Gneiting et al. (2006) applied the RST technique to obtain probabilistic forecasts of hourly average wind speed near the Stateline wind energy center in the states of Oregon and Washington, at a prediction horizon of k = 2 hours. In what follows, we compare the RST density forecasts to probabilistic forecasts derived from autoregressive time series models, as proposed by Brown, Katz and Murphy (1984) and widely implemented since. Both methods employ a rolling estimation window of 45 days or 1, 080 hours. The evaluation period ranges from 1 May through 30 November 2003, for a total of n = 5, 136 density forecast cases. See Gneiting et al. (2006) for details.5 Figure 5 shows the threshold and quantile decomposition of the continuous ranked probability score for the two probabilistic forecasting methods. The RST technique is superior at all thresholds and quantiles, with a mean continuous ranked probability score of 0.961 meters per second, as opposed to 1.115 meters per second for the autoregressive benchmark. Table 8 shows the results of weighted CRPS tests with the weight functions in Table 4, where a = 10 meters per second and b = 5 meters per second, a choice that is motivated by the marginal climatological distribution of wind speeds (Gneiting et al. 2006). All tests are overwhelmingly in favor of the RST technique.
5
Discussion
We have proposed a method for comparing density forecasts that is based on threshold and quantile weighted versions of the continuous ranked probability score. R code is available from the authors upon request. 5
Gneiting et al. (2006) refer to the methods considered here as the RST-D-CH and AR-D-CH techniques. The autoregressive method assumes Gaussian forecast densities that assign small but positive probability mass to the negative halfaxis, which we reassign to wind speed zero. The continuous ranked probability score handles the point mass naturally.
17
Quantile Decomposition RST AR
1.0 0.0
Quantile Score
1.5
RST AR
0.5
0.00 0.02 0.04 0.06 0.08 0.10 0.12
Brier Probability Score
Threshold Decomposition
0
5
10
15
20
25
0.0
Wind Threshold in Meters per Second
0.2
0.4
0.6
0.8
1.0
Wind Quantile
Figure 5: Threshold and quantile decomposition of the mean continuous ranked probability score for regime-switching space-time (RST) and autoregressive (AR) probabilistic forecasts of hourly average wind speed at the Stateline wind energy center, at a prediction horizon of two hours.
Table 8: Threshold and quantile weighted CRPS tests in the wind example. The regimeswitching space-time (RST) forecast takes the role of f and the autoregressive benchmark the role of g. Threshold Weight u0 (y) = 1 u1 (y) = φ10,5 (y) u2 (y) = 1 − φ10,5 (y)/φ10,5 (0) u3 (y) = Φ10,5 (y) u4 (y) = 1 − Φ10,5 (y) Quantile Weight v0 (q) = 1 v1 (q) = q(1 − q) v2 (q) = (2q − 1)2 v3 (q) = q 2 v4 (q) = (1 − q)2
RST
Emphasis uniform center tails right tail left tail
Emphasis uniform center tails right tail left tail
Sn 0.961 0.257 0.318 0.342 0.619
RST
Sn 0.961 0.187 0.213 0.299 0.288
18
AR
Sn 1.115 0.216 0.250 0.351 0.331
AR
Sn 1.115 0.300 0.364 0.398 0.718 σˆn 0.838 0.162 0.201 0.302 0.252
σ ˆn 0.838 0.251 0.293 0.386 0.552
tn −13.16 −12.28 −11.25 −10.36 −12.73
tn −13.16 −12.93 −13.07 −12.34 −12.30
P < 0.001 < 0.001 < 0.001 < 0.001 < 0.001
P < 0.001 < 0.001 < 0.001 < 0.001 < 0.001
Our approach is similar in spirit to the weighted likelihood ratio test of Amisano and Giacomini (2007); however, it is based on proper scoring rules, and therefore avoids misguided inferences. In the case of threshold weighting, it is formally equivalent to the approach of Corradi and Swanson (2006), who provide a wealth of relevant theoretical results under rolling and recursive estimation schemes. The threshold and quantile decompositions of the continuous ranked probability score can be illustrated graphically, to provide diagnostic tools that prompt insights into the strengths and deficiencies of forecasting methods, as we have illustrated in the case studies. Gneiting, Balabdaoui and Raftery (2007) contend that the goal of probabilistic forecasting is to maximize the sharpness of the forecast densities subject to calibration. Calibration refers to the statistical consistency between the forecast densities and the observations, and is a joint property of the forecasts and the values that materialize. Sharpness refers to the concentration of the forecast densities: The sharper the densities, the less the uncertainty, and the sharper, the better, subject to calibration. The probability integral transform (PIT) histogram is the primary diagnostic tool for calibration checks (Diebold, Gunther and Tay 1998; Corradi and Swanson 2006b; Gneiting, Balabdaoui and Raftery 2007; Laio and Tamea 2007). The PIT is simply the value that the predictive CDF attains at the observation (Dawid 1984). If the observation is drawn from the forecast density, the PIT has a uniform distribution. Hence, to assess the calibration of a density forecasting method, we find the PIT, repeat over a sizable number of forecast cases, and check the PIT histogram for uniformity. This does not take the sharpness of the density forecasts into account, as opposed to proper scoring rules, which provide a combined assessment of calibration and sharpness (Gneiting, Balabdaoui and Raftery 2007). A possible limitation of our method is that the unweighted continuous ranked probability score is infinite if the forecast density has infinite first moment, such as in the case of a Cauchy density. Even then, the mean scores (21) and (23) can be plotted versus the threshold z and the quantile α, and the resulting plots can be interpreted diagnostically. Furthermore, the threshold-weighted continuous ranked probability score (14) is finite if the weight function is integrable, and in this latter form the weighted CRPS test continues to apply.
Appendix: Moment conditions We supply the remaining nontrivial arguments in Section 3.2. To verify the assumptions of Theorem 4 of Giacomini and White (2006), we need to show that the moment condition (19) implies E |S(fˆt+k , Yt+k ) − S(ˆ gt+k , Yt+k )|2r (24) to be finite, where S is the threshold-weighted continuous ranked probability score (14) or the quantile-weighted score (15), and the weight function is bounded. For ease of notation, we substitute f , g and Y for fˆt+k , gˆt+k and Yt+k , respectively. If the weight function is 19
bounded above by the constant M > 0, then E |S(f, Y ) − S(g, Y )|2r ≤ (2M)2r (E CRPS(f, Y )2r + E CRPS(g, Y )2r ). We proceed to show that under (19) both E CRPS(f, Y )2r and E CRPS(g, Y )2r are finite. If X and X ′ are independent random variables with density f that are independent of Y , then CRPS(f, Y ) = E |X − Y | −
1 Ef |X − X ′ | ≤ 2Ef |X| + |Y | 2
by the triangle inequality, and therefore E CRPS(f, Y )2r ≤ 22r ((2Ef |X|)2r + E |Y |2r ). A similar result holds for E CRPS(g, Y )2r ; hence, (19) is a sufficient condition for the expectation (24) to be finite. Finally, if the threshold weight function u in (14) is integrable, the score differential in (24) is bounded and its moments of order r ≥ 2 are finite.
Acknowledgements This research was supported by the National Science Foundation under Awards ATM0724721 and DMS-0706745.
References Amisano, G., and R. Giacomini (2007): “Comparing Density Forecasts via Weighted Likelihood Ratio Tests,” Journal of Business and Economic Statistics, 25, 177–190. ˘ lu (2007): “Comparing Density Forecast Models,” Bao, Y., T.-H. Lee, and B. Saltog Journal of Forecasting, 26, 203–225. Bollerslev, T. (1986): “Generalized Autoregressive Conditional Heteroscedasticity,” Journal of Econometrics, 31, 307–327. Brown, B. G., R. W. Katz, and A. H. Murphy (1984): “Time Series Models to Simulate and Forecast Wind Speed and Wind Power,” Journal of Climate and Applied Meteorology, 23, 1184–1195. ˜oz (1996): “Proper Scoring Rules for Fractiles,” in Bayesian Cervera, J. L, and J. Mun Statistics 5, ed. by J. M. Bernardo, J. O. Berger, A. P. Dawid, and A. F. M. Smith, Oxford: Oxford University Press, 513–519. Christoffersen, P. F., and F. X. Diebold (1996): “Further Results on Forecasting and Model Selection Under Asymmetric Loss,” Journal of Applied Econometrics, 11, 561–571. 20
Clements, M. P. (2004): “Evaluating the Bank of England Density Forecasts of Inflation,” Economic Journal, 114, 844–866. Corradi V., and N. R. Swanson (2006a): “Predictive Density and Conditional Confidence Interval Accuracy Tests,” Journal of Econometrics, 135, 187–228. (2006b): “Predictive Density Evaluation,” in Handbook of Economic Forecasting, ed. by C. W. J. Granger, G. Elliott and A. Timmermann, Amsterdam, North Holland, 197–286. Dawid, A. P. (1984): “Statistical Theory: The Prequential Approach,” Journal of the Royal Statistical Society Series A, 147, 278–292. Diebold, F. X., and R. S. Mariano (1995): “Comparing Predictive Accuracy,” Journal of Business and Economic Statistics, 13, 253–263. Diebold, F. X., T. A. Gunther, and A. S. Tay (1998): “Evaluating Density Forecasts with Applications to Financial Risk Management,” International Economic Review, 39, 863–883. Elder, R., G. Kapetanios, T. Taylor and T. Yates (2005): “Assessing the MPC’s Fan Charts,” Bank of England Quarterly Bulletin, Autumn, 326–348. Elliott, G., and A. Timmermann (2008): “Economic Forecasting,” Journal of Economic Literature, 46, 1–53. Engle, R. F. (1982): “Autoregressive Conditional Heteroscedasticity With Estimates of the Variance of United Kingdom Inflation,” Econometrica, 45, 987–1007. Giacomini, R., and I. Komunjer (2005): “Evaluation and Combination of Conditional Quantile Forecasts,” Journal of Business and Economic Statistics, 23, 416–431. Giacomini, R., and H. White (2006): “Tests of Conditional Predictive Ability,” Econometrica, 74, 1545–1578. Gneiting, T. (2008): “Editorial: Probabilistic Forecasting,” Journal of the Royal Statistical Society Series A, 171, 319–321. Gneiting, T., and A. E. Raftery (2007): “Strictly Proper Scoring Rules, Prediction, and Estimation,” Journal of the American Statistical Association, 102, 359–378. Gneiting, T., F. Balabdaoui, and A. E. Raftery (2007): “Probabilistic Forecasts, Calibration and Sharpness,” Journal of the Royal Statistical Society Series B, 67, 243– 268. Gneiting, T., K. Larson, K. Westrick, M. G. Genton, and E. Aldrich (2006): “Calibrated Probabilistic Forecasting at the Stateline Wind Energy Center: The Regime-Switching Space-Time Method,” Journal of the American Statistical Association, 101, 968–979. Koenker, R., and G. Bassett (1978): “Regression Quantiles,” Econometrica, 46, 33–50. Laio, F., and S. Tamea (2007): “Verification Tools for Probabilistic Forecasts of Continuous Hydrological Variables,” Hydrology and Earth System Sciences, 11, 1267–1277. Matheson, J. E., and R. L. Winkler (1976): “Scoring Rules for Continuous Probability 21
Distributions,” Management Science, 22, 1087–1096. Mitchell, J., and S. G. Hall (2005): “Evaluating, Comparing and Combining Density Forecasts Using the KLIC With an Application to the Bank of England and NIESR ‘Fan’ Charts of Inflation,” Oxford Bulletin of Economics and Statistics, 67S, 995–1033. Schumacher, M., E. Graf, and T. Gerds (2003): “How to Assess Prognostic Models for Survival Data: A Case Study in Oncology,” Methods of Information in Medicine, 42, 564–571. Selten, R. (1998): “Axiomatic Characterization of the Quadratic Scoring Rule,” Experimental Economics, 1, 43–62. Timmermann, A. (2000): “Density Forecasting in Economics and Finance,” Journal of Forecasting, 19, 231–234. Wallis, K. F. (2003): “Chi-Squared Tests of Interval and Density Forecasts, and the Bank of England’s Fan Charts,” International Journal of Forecasting, 19, 165–175. (2004): “An Assessment of Bank of England and National Institute Inflation Forecast Uncertainties,” National Institute Economic Review, 189, 64–71. Winkler, R. L. (1996): “Scoring Rules and the Evaluation of Probabilities,” Test, 5, 1–60.
22