Nigerian Journal of Technology (NIJOTECH) Vol. 37, No. 2, April 2018, pp. 554 – 561 Copyright© Faculty of Engineering, University of Nigeria, Nsukka, Print ISSN: 0331-8443, Electronic ISSN: 2467-8821
www.nijotech.com http://dx.doi.org/10.4314/njt.v37i2.36
COMPARING GULLY LENGTH AND AVERAGE GULLY WIDTH RELATIONSHIPS ON TWO GEOLOGICAL SEDIMENTS OF VARYING VULNERABILITY TO EROSION IN THE NORTH CENTRAL NIGERIA Louis A. Oparaku1,* and Gabriel O. Ogbeh2 1, 2 DEPT. OF AGRIC. AND ENVIR., ENGR., FED. UNIVERSITY OF AGRICULTURE, MAKURDI, BENUE STATE, NIGERIA.
E-mail addresses: 1
[email protected]; 2
[email protected] ABSTRACT
Gully erosion is an environmental problem that confronts the international community. This study was undertaken to investigate the relationships between gully length and average gully width on two geological sediments of varying resistance to erosion. Thirty-seven and five gully samples formed respectively on two homogenous geological sediments (the Ajalli Sandstones (AS) and the Upper Coal Measures (UCM)) underlying the Idah-Ankpa Plateau of the North Central Nigeria were measured and their lengths (L) and average widths (W) were subjected to correlation analyses and the sample bivariate regression to examine and compare their relationships on the two formations. Results show that on the highly erodible AS, L is positively, poorly, and not significantly correlated with W (R = 0.201, R2 = 0.040), whereas the correlation is stronger, significant, but negative at the 0.05 level on the UCM (R = -0.930, R2 = 0.865). The regression equations show that L is a poor predictor of W on the AS (W1 = 6.387 + 0.03L1, R2 = 0.040), and a very good predictor of the parameter (W) on the UCM (W2=18.135 – 0.033L2, R2 = 0.865), which appears as a negative value. And the valid range of gully lengths for the prediction of the average width on the AS can be ranked as 0=L< (infinity), whereas the ranking is of the form 0 ≤ L ≤ 549.55 m on the UCM. The study suggests that the correlation of W with L becomes stronger, negative and significant as the resistance to erosion of the geological sediments increases. It also suggests that the predictability of W using L as a tool improves and transforms to a negative value as the resistance to erosion of the formation increases. Keywords: Bivariate regression; correlation; geological sediments; gully erosion; soil erosion; vulnerability. 1. INTRODUCTION Gully erosion is one of the most challenging environmental problems confronting the international community. It is the most spectacular form of soil erosion, involving a localized removal of both surface and sub-surface soils up to considerable depths. A gully is defined as any water channel having a steepsided or vertical headwall, a width greater than 0.30 m and a depth greater than 0.60 m [1]; from an agricultural point of view, a gully is defined as any earth channel caused by a concentration of flow that is so large that it cannot be obliterated by normal tillage operations [2]. Gullies dissect urban and agricultural lands, yield sediments that silt up reservoirs and surface water conveyance systems, lower the ground water table, destroy urban infrastructure, and offer a safe haven to social miscreants. They, therefore, should be controlled. Gully erosion control is an expensive undertaking, and * Corresponding author, tel: +234 – 805 – 843 – 3449
the choice of which gullies to control must, therefore, be based on some rational criteria, namely, the value of the land and the volume of sediments produced by the gully. Control of gullies occurring on rural lands seldom attracts the attention of governments at the federal and state levels as well as the international donor agencies. This is because rural lands experiencing gullying are often considered of such a low value that the cost/benefit indices derived from expenditure on such lands are usually adjudged as unjustifiable. On the other hand, gullies occurring on urban lands are more spectacular and they readily attract governments’ attention for control on the score of the value of the land and the damage they cause to urban infrastructure. Therefore, the volume of sediments produced by a gully should constitute a criterion for targeting expenditure on gully erosion control on both rural and urban lands.
COMPARING GULLY LENGTH AND AVERAGE GULLY WIDTH RELATIONSHIPS ON TWO GEOLOGICAL SEDIMENTS OF VARYING… The percentage contribution of gully erosion to the total sediment production from a catchment is uncertain, though usually occupying less than 5% of the total catchment area. It is estimated that gullies contribute about 10 to 95% of the overall sediment yields from a catchment [3]. In addition, many published works suggest that gully erosion occurring in catchments is the principal source of sediments that damage urban and rural infrastructure [4 – 6]. The average volume (V) of sediments produced by a gully is obtained by finding the product of the length (L), the average depth (D), and the average width (W) of the gully V L D W). While the length is easily measured in the field, from air photographs, and from satellite images; measurements of the average depth and average width are difficult and imprecise undertakings. Most researchers in this area are silent about the criteria usually considered in their measurements and, therefore, do not attach any certainty to the results obtained. The difficulties usually encountered in measuring the depth and width of gully cross sections because of their intricate shapes was extensively discussed by [7], and expressed the need for researchers in this field to clearly define and express the criteria considered in their measurements. Simple and clear models for estimating the average depth and width of gullies formed on soil formations are, therefore, required. Numerous studies have been undertaken worldwide to investigate the interrelationships between and among gully dimensions. Working on lateric soils in Guyana, [8] stated that gully width was strongly and positively correlated with the depth (R = 0.84). His findings showed that the expansion of gully sides goes on at rates proportional to the rate of gully deepening. Working on the Loess Plateau of China, [9] reported that gully length was very strongly and significantly correlated with gully volume and suggested that gully length could represent a critical index for the estimation of gully sediment volume, since it can be easily measured in the field, from air photographs, and from satellite images. The results of a study in Southern Spain revealed that gully volume (V) had a positive correlation with the form factor (W/D) (R = 0.66, R2 = 0.44) and a negative correlation with the W/L ratio (R = –0.74, R2 = 0.54) [10]. Their findings showed that gully widening was a more dominant phenomenon in this area than gully deepening. A linear relationship between the form factor (W/D) and the gully length (L) was reported by [11], and expressed the relationship as shown in Equation (1). W . 0.00 99L ) D Nigerian Journal of Technology
L. A. Oparaku & G. O. Ogbeh
R 0. , R 0. 9). In their research in Portugal, [12] found a power function between the gully volume and gully length as shown in Equation (2). V 0.05L . ) No previous study had considered the effect on the interrelationships between and among gully dimensions of the variations in the degree of vulnerability to erosion of the geological sediments on which gullies are formed. This study was, therefore, carried out to investigate the relationships existing between gully length and average gully width on two uniquely homogeneous geological sediments of varying vulnerability to erosion underlying a sizable percentage of the landscape of the Idah-Ankpa Plateau in the North Central Nigeria. The specific objectives were to examine respectively the correlation of the gully length with the average gully width and the predictability of the average gully width on each of these geological units using the length as a prediction tool. 2. THE STUDY AREA The study was conducted on the Idah-Ankpa Plateau (IAP) of the Anambra Basin in the North Central Nigeria. The IAP consists of the Western Ankpa Plateau and the Idah Flood Plains. It is reported that it had been so named because the later comprises an insignificant percentage of the whole area [13]. Nestled in the Guinea Savanna ecological zone of Nigeria, it lies between Latitudes 7º 17' 00'' N and 7º 23' 30'' N and Longitudes 8º 20' 20'' E and 9º 00' 00'' E. The total land area is estimated at about 5675 km2 with a perimeter of 793, 531.76 km [14]. About 96% of the area lies in Kogi State, while the remaining 4% lies in Benue State of Nigeria. The area is located in the tropical hot climate. The mean annual rainfall is 1260 mm. There are two major seasons in a year: the rainy season and the dry season. The rainy season responds to the prevalence of the moisture-laden southwesterly maritime winds that originated from the Atlantic Ocean, while the dry season responds to the dry continental northeasterly winds that blow from the Sahara Desert. The rainy season lasts from the middle of April to the end of October, while the dry season lasts from November until the middle of April. Temperatures are high throughout the year with an average of 32.60ºC. The average relative humidity may be as high as 98.70% in October and as low as 75.20% in January. The evapotranspiration ranges from 73.43 to 166.90 mm. September has the highest number of rainy days (8.00) and March has the least (1.2). Vol. 37, No.2, April 2018
555
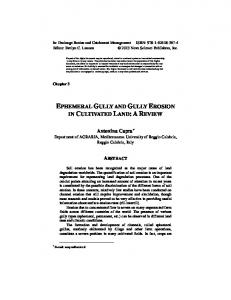
COMPARING GULLY LENGTH AND AVERAGE GULLY WIDTH RELATIONSHIPS ON TWO GEOLOGICAL SEDIMENTS OF VARYING… The geology of the area (Figure 1) was described by [15] as follows: The underlying geology consists of cretaceous sediments made up of three major formations which underlie 100% of the plateau landscape. These formations comprise the Upper Coal Measures (UCM) (36%), The Ajalli Sandstones (AS) (44%), and the Lower Coal Measures (LCM) (20%). The geological successions of these sediments are as follows: UCM – AS – LCM, i. e., the UCM is the overlying formation, the LCM the underlying formation, while the AS is sandwiched in between the two. The UCM and LCM are each homogeneous up to a depth of 70 m, whereas the AS is homogeneous up to a depth of 170 m. The AS is exposed to the erosive processes of the elements at locations where the UCM, which provides a protective overburden, has been denuded away. And the LCM is exposed and subject to denudative processes where both the UCM and AS have been eroded away. According to [16] and [17], it is estimated that 740 gullies were in occurrence on the AS, 100 on the UCM, and one on the LCM; each of which causes different magnitudes of environmental devastations (Plate 1). Their study showed that the mean %sand + %silt on the AS was 95%; UCM, 80%; and LCM, 61%. Thus, the vulnerability to erosion (erodibility) of the three sediments can be ranked as AS > UCM > LCM. The three geological sediments control the geology of the area. The AS and the sandy units of the UCM form
L. A. Oparaku & G. O. Ogbeh
copious aquifers, whereas the argillaceous units of the UCM and LCM form aquitards. The geomorphology consists of the Ankpa Plateau and the Ankpa Piedmont which lie over sandstones, but differentiated in the valleys. The Anambra River, which empties into the River Niger, is the main drainage basin. The soils are predominantly cretaceous sandstones. They are deep, well drained, and frequently red or reddish brown in colour with sandy surface horizons occurring on the interfluves and the upper and middle slopes. Subsistence agriculture is practised in the area. 3. MATERIALS AND METHODS Random samples of five percent of the estimated gullies on the AS (740) and the UCM (100) respectively were studied. These gave 37 gully samples on the AS and 5 on the UCM. The gullies were selected irrespective of the land uses and ground slopes on which they evolved. Of the 37 gullies analysed on the AS, 16 were treated, 14 inactive, and 7 active; whereas all the gullies in occurrence (including the five analysed) on the UCM were untreated. The dimensions of the 16 treated gullies on the AS were obtained from the Lower Benue River Basin Development Authority (LBRBDA), Makurdi, while the dimensions of the untreated ones were measured directly in the field using the methods described by [18].
Figure 1: Geological map of the Idah-Ankpa Plateau (IAP) Nigerian Journal of Technology
Vol. 37, No.2, April 2018
556
COMPARING GULLY LENGTH AND AVERAGE GULLY WIDTH RELATIONSHIPS ON TWO GEOLOGICAL SEDIMENTS OF VARYING…
L. A. Oparaku & G. O. Ogbeh
recorded in metres. These procedures were repeated for all the marked interval points along the floor and the average gully width (W) was computed as shown in Equations (3) to (5) respectively. sum of ed width readings W ) Num er of interval points sum of shoulder width readings W 4) Num er of interval points W W Average gully width, W 5)
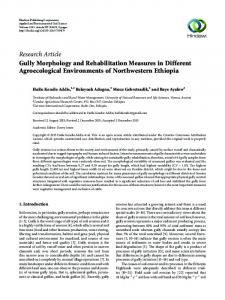
(A) An urban roadway undermined by soil erosion at Dekina (B) An intercity roadway overtaken by eroded sediments between Otukpa and Orokam (C) A portion of a landscape degraded by gully erosion at Ankpa
Plate 1: Some Land Devastations caused by Soil Erosion on the IAP The gully length (L), average depth (D), and average width (W) were measured with a linen tape and ranging poles. The length of each gully was obtained by marking and measuring out 10 m interval points on the floor of the gully from the head to the mouth using the linen tape and the ranging poles. The gully length (L, in metres) was obtained by multiplying the number of interval points by 10. To measure the bed and shoulder widths, each of the 10 m interval points was marked with a ranging pole in succession, and at each point, the tape was stretched across the gully bed from one side perpendicular to the other. At this point, the bed width reading on the tape was recorded in metres. The same procedure was repeated at the shoulder at the same point with the tape tight-stretched across the gully to ensure that it did not sag at the middle. The shoulder width was also Nigerian Journal of Technology
The average gully depth (D) was measured by having a third person place one of the poles at the deepest part of the gully floor at the same interval point where the bed and shoulder widths were measured. The tape was placed at the ground level and stretched across the gully channel over the ranging pole. The third person holding the ranging pole on the gully floor noted and recorded the reading on the ranging pole as it made contact with the linen tape. At points where the gully depth was more than 1.90 m, the ranging poles were tied together using 10 m ropes to increase their total vertical length. The elongated poles were then used to measure the depths using the above procedures. Thus, the average gully depth was obtained by using Equation (6). Sum of interval depths D ) Num er of intervals The gully parameters actually measured in the field and collected from LBRBDA were the Length (L), average depth (D), and the average width (W). Other variables computed from these parameters were the average volume (V), average cross-sectional area (A), and the average form factor (W/D). For these sets of variables (L, D, W, V, A, and W/D), a total of six for each gully, the Pearson’s correlation matrices were used to show the inter-correlations among the variables, the simple correlation analyses used to investigate the relationships between gully length (L) and average gully width (W), and the sample bivariate regression employed to examine the predictability of W using L as a prediction tool on each of the two formations. 4. RESULTS AND DISCUSSION 4.1 Correlation of Gully Length with the Average Gully Width The descriptive statistics of the 37 and 5 gully samples measured respectively on the AS and UCM are presented in Tables 1 and 2. And the results of the Pearson’s correlation matrices showing the interrelationships among the six variables (L, D, W, V, A, and W/D) are also presented in Table 3 for the Ajalli Vol. 37, No.2, April 2018
557
COMPARING GULLY LENGTH AND AVERAGE GULLY WIDTH RELATIONSHIPS ON TWO GEOLOGICAL SEDIMENTS OF VARYING… Sandstones (AS), and Table 4 for the Upper Coal Measures (UCM). In Table 3, it is shown that out of 30 correlation coefficients on the AS, 18 were significantly correlated (4 at the 0.05 level and 14 at the 0.01 level), representing 60% of the total (13.33% and 46.67%
Statistics RG ̅ SD CV
Statistics RG ̅ SD CV
L. A. Oparaku & G. O. Ogbeh
respectively). On the more resistant UCM (Table 4), about 66.67% of the variables were significantly correlated. These results agree with those reported by [8, 18, 19], who reported 60%, 42.90% and 60.70% of significant correlations in their related gully erosion studies.
Table 1: Descriptive Statistics of Gullies formed on the Ajalli Sandstones’ (AS) formation Length L (m) Average depth Average width W Average Volume V (m3) Average CSA Average form D (m) (m) (m2) factor W/D 45.20–1,500 1.05–16.30 2.20–30.00 1,277.92–540,000.00 3.26–360.00 0.75-6.25 452.27 6.49 7.95 39,513.00 62.16 1.46 322.12 3.47 5.53 31,416.29 24.09 1.20 71.22 53.47 69.56 79.51 38.76 82.19 ̅ = Mean, RG = Range, SD = Standard Deviation, CV = Coefficient of Variation, and CSA = Cross Sectional Area. Table 2: Descriptive Statistics of Gullies formed on the Upper Coal Measures’ (UCM) formation Average depth Average width W Average Volume V Average CSA Average form factor Length L (m) D (m) (m) (m3) (m2) W/D 18.32-500.00 2.70-14.62 2.30-18-87 2173.50-10,000.00 6.21-275.88 0.71-1.30 361.66 5.96 6.23 5,587.30 64.97 0.91 200.52 4.91 0.87 2974.10 53.05 0.23 55.44 82.38 13.97 53.23 81.66 25.27 Table 3: Correlation of the Variables of the Gullies formed on the Ajalli Sandstones Formation Average Length, Average Depth, Average Width, Volume, Average CSA L D W V 1
Form Factor W/D
Length L Average Depth, 0.004 1 D Average Width, 0.201 0.565** 1 W Average 0.503* 0.447** 0.849** 1 Volume, V Average CSA 0.243 0.780** 0.913** 0.870** 1 Form Factor, -0.076 0.380* 0.346 0.130 0.021 1 W/D ** Correlation is significant at the 0.01 level (2 – tailed); * Correlation is significant at the 0.05 level (2 – tailed); CSA = Cross Sectional Area Table 4: Correlation of the variables of the Gullies formed on the Upper Coal Measures formation Length, Average Depth, Average Width, Average Average CSA, Form Factor L D W Volume, V A W/D 1
Length L Average Depth, 0.00 1 D Average Width, 0.04 31.92 W Average 25.30 19.98 Volume, V Average CSA, 5.91 60.84 A Form Factor, 0.58 14.14 W/D CSA =Cross Sectional Area; R2 = Coefficient of Correlation Sandstones Nigerian Journal of Technology
1 72.08
1
83.36
75.69
1
11.97
1.69
0.04
1
(%); Upper Triangle = Upper Coal measures; Lower Triangle = Ajalli
Vol. 37, No.2, April 2018
558
COMPARING GULLY LENGTH AND AVERAGE GULLY WIDTH RELATIONSHIPS ON TWO GEOLOGICAL SEDIMENTS OF VARYING…
The results of the correlation analyses further show that on the AS (Table 3), the length is positively, poorly, and not significantly correlated with the width (R = 0.201, R2 = 0.040). This means that an increase in length accounts for only 4.04% of the increase in width on the AS. On the more resistant UCM (Table 4), the length is strongly, significantly, but negatively correlated with the width at the 0.05 level (R = -0.930, R2 = 0.865). With an R2 value of 0.865 on the UCM, the indication is that an increase in length explains 86.49% of the decrease in the average gully width on this formation. The low correlation existing between the gully length and the average width on the AS could be explained when it is understood that as a gully advances into a catchment, the rate of increase of the length decreases due to a decreasing catchment area supplying a progressively decreasing runoff (at the gully head) that erodes and extends the headscarp. On the other hand, the catchment area above any gully cross section remains constant and this supplies the same flow of runoff during a particular magnitude of rainfall event. So that gully width expansion can be attributed not to an increase in length, but to shear flow at the sides, bank collapse, and debris clean out [20]. On the UCM, however, as the full torrential flow cascades and wears away the resistant gully head, causing the gully length to increase (extend), only a small depth of flow on the gully floor makes contact with the sides, causing ineffectual wearing action on the resistant gully walls. As explained in the case of the more erodible AS, when a gully head advances in the UCM, the flow rate diminishes at the head because of a diminishing catchment area, whereas the flow across any cross section remains constant since the catchment area above that cross section equally remains unchanged. So that because of the resistant nature of this formation, the rates and effects of shear flow at the gully sides, bank collapse, and debris clean out processes are reduced. In addition, the net volume of sediments eroded from the gully sides and headscarp upstream of any cross section and deposited at that cross section far exceeds the amount eroded from and deposited at that cross section. So that the processes taking place at any cross section are those that relate to imperceptible gully width contraction rather than expansion. The correlation analyses, therefore, suggest that the correlation of the gully length with the average gully width is stronger, negative and significant as the resistance of the soil formation to erosion increases.
Nigerian Journal of Technology
L. A. Oparaku & G. O. Ogbeh
4.2 Sample bivariate regression of gully length with the average gully width On the Ajalli Sandstones (AS), the relationship between the gully length and the average gully width is expressed by the sample bivariate Equation (7). W . 0.0 L ) 2 (R = 0.201, R = 0.040) Where, W1 = Average gully width (AS) (Dependent variable), L1 = Gully length (AS) (Independent variable) The relationship is represented in Figure 2. The relationship on the more resistant Upper Coal Measures (UCM) is shown in Equation (8). W . 5 – 0.0 L ) 2 (R = - 0.930, R = 0.865) Where, W2 = Average gully width (UCM) (Dependent variable), L2 = Gully length (UCM) (Independent variable) The relationship of the two variables is shown graphically in Figure 3. The relationship on the AS is somewhat linear; however, the scatter points around the line of best fit (Figure 2), the value of R (0.201), and an R2 value of 0.040 evidence a very weak relationship between L and W. Since the coefficient of regression (CR) is low and positive (0.03), and an increase in L explains only 4.04% of the increase in W, the deduction is that gully length is a very poor predictor of the average width (W . 0.0 L ) on the AS formation. From the equation, the boundary conditions are that when L1 = 0, W1 = 6.387 m, and when L1 = – 212.90 m, W1 = 0. Since an L1 value of -212.90 m is preposterous, the valid range of gully lengths for the prediction of the average width can be ranked as 0 = L < (infinity). On the more resistant UCM, the CR is negative (-0.033), and from Figure 3, the regression points scatter very closely around the line of best fit. In addition, a CR of 0.033 and an R2 value of 0.865 indicate that an increase in length accounts for 86.49% of the decrease in the average gully width. Therefore, the regression equation, W . 5 – 0.0 L shows that gully length is a very good predictor (estimator) of the average gully width on the UCM formation, which appears in the form of average width contraction. From the equation, the boundary conditions are that when L 2 = 0, W2 = 18.135 m; and when L2 = 549.55 m, W2 = 0. Therefore, the valid range of values of gully lengths on the UCM for the prediction of the average gully width can e ranked as 0 ≤ L2 ≤ 549.55 m.
Vol. 37, No.2, April 2018
559
COMPARING GULLY LENGTH AND AVERAGE GULLY WIDTH RELATIONSHIPS ON TWO GEOLOGICAL SEDIMENTS OF VARYING…
Figure 2: Linear regression between gully length and the average gully width on Ajalli Sandstones. Generally, the study suggests that the correlation of the gully length with the average gully width changes to a stronger, negative, and significant value as the resistance to erosion of the geologic formation on which the gully is developed increases (RAS = 0.201 and RUCM = - 0.930). On the other hand, the suggestion is that the predictable average gully width using the gully length as a prediction tool transforms from a positive to a stronger negative value as the resistance of the soil formation increases (CRAS = 0.03; CRUCM = - 0.033). 5. CONCLUSIONS The following conclusions can be drawn from this study: 1. On the highly erodible Ajalli Sandstones (AS), gully length is poorly correlated with the average width, whereas the correlation is stronger on the more resistance Upper Coal Measures (UCM). 2. Gully length is a poor but positive predictor of the average gully width on the AS; it is, however, a strong but negative predictor on the UCM. Hence, gully length is not a reliable predictor of the average gully width on erodible, homogenous materials. 3. The average gully width (W) can only be predicted on the AS when the gully length (L) values range from 0 = L < (infinity), whereas the ranking of L for the prediction of W on the UCM is 0 ≤ L2 ≤ 549.55 m. 4. The correlation of gully length with the average gully width transmutes from a positive value on erodible sediments to a negative, stronger and more significant value as the resistance to erosion of the sediments increases (RAS = 0.201 and RUCM = - 0.930).
Nigerian Journal of Technology
L. A. Oparaku & G. O. Ogbeh
Figure 3: Linear regression between gully length and the average gully width on Upper Coal Measures 5.
The predicted value of the average gully width on an erodible material using the length as the predictor changes to a negative value with increasing resistance to erosion on the sediments on which a gully is developed.
6. ACKNOWLEDGEMENTS We would like to thank the management of Lower Benue River Basin Development Authority (LBRBDA), Makurdi for providing access to the much-needed dimensions of the 16 treated gullies in Ajalli Sandstones (AS). Also, acknowledgment with sincere thanks is given to all the Authors whose articles were reviewed in this research without their prior consents. 7. REFERENCES [1] Brice, J. C., Erosion and Sedimentation in the Loessian-mantled Great Plains, Madison Creek drainage basin, Nebraska. Geological Survey Prof. paper, 352, pp. 5255 – 339. 1966. [2] Forster, G.R., Modeling soil erosion and sediment yield. In: R. Lal (ed) Soil Erosion Research Methods. SWCS (1555): Netherlands, pp. 111 – 117, 1988. [3] Poesen, J., Nachtergaele, J., Verstraeten, G., Valentin, C. Gully erosion and environmental change: Importance and Research Needs. Catena, 50 (2), pp. 91 – 133, 2003. [4] De Vente, J., Poesen, J., and Verstraeten, G.. The application of Semi-quantitative methods and reservoir sedimentation for the prediction of basin sediment yields in Spain. Journal of Hydrology, 305 (1 – 4), pp. 63 – 86, 2005. [5] Valentin, C., Poesen, J., and Li, Y.. Gully erosion: Impacts, factors and control. Catena, 63(2 – 3), pp. 132 – 153, 2005. Vol. 37, No.2, April 2018
560
COMPARING GULLY LENGTH AND AVERAGE GULLY WIDTH RELATIONSHIPS ON TWO GEOLOGICAL SEDIMENTS OF VARYING… [6] Poesen, J.. Challenges in gully erosion research. Landform Analysis, 17, pp. 5 – 9, 2011. [7] Casali, J., Gimenez, R., and Campo-Bescos, M. A. Gully geometry: What are we measuring? Soils. 1, pp. 509 – 513, 2015. [8] Ebisemiju, F. S.. A morphometric approach to gully analysis. Z. Geomorpholoie, 33(3), pp. 307 – 322, 1989. [9] Cheng, H., Zou, X., Wu, C., Zhang, C., Zheng, O., and Jiangi, Z.. Morphology parameters of ephemeral gullies in characteristic hillslopes on the Loess Plateau of China. Soil and Tillage Research, 94, pp. 4 – 14,2007. [10] Vandkerekhove, I., Poesen, J., OostwoudWigdenes, D., Gyssels, G., Beuselinck, I. and Deluna, E., (2000). Characteristics and controlling factors of bank gullies in two semi-arid Mediterranean environments. Geomorphology, 3(1-2), pp. 17 – 58. [11] Radoane, M., Ichim, I., Radoane, N., and Surdeanu, V. Asupra profilului longitudinal de forma a revenelor din podisul moldovei. Acad. Romana, Stud. Cerect Geogr. Tom. XXXVII, pp. 67 – 74., 1990. [12] Nachtergaele, J., Poesen, J., Vandekerekove, L., Oostwoud Wijdenes, D., and Roxo, M., Testing the ephemeral gully erosion model (EGEM) for two Mediterranean environments. Earth Surface Processes and Land Forms. 26, pp. 17-30, 2001. [13] ECAN, Gully erosion control measures for Ankpa. Federal Ministry of Agriculture, Abuja, Nigeria, 1982.
Nigerian Journal of Technology
L. A. Oparaku & G. O. Ogbeh
[14] Oparaku, L. A. Gully Erosion on the Idah-Ankpa Plateau of the Anambra Basin, Nigeria. A Ph.D. thesis submitted to the University of Jos, Nigeria, 2015. [15] Preez, J. W., and Barber, W. The distribution and chemical properties of ground water in Northern Nigeria. Geological Survey of Nigeria, Bulletin 36, 1965. [16] Oparaku, L. A., I. M., Aho, R.T, Iwar. Relative vulnerability to gully erosion of three geological sediments: A texture-based assessment. Journal of Environment and Earth Science, 6 (2), 2016. [17] Oparaku, L. A., Iorkua, S. A., and M. Joel. Gully erosion on the Idah-Ankpa Plateau of the Anambra Basin, Nigeria: Some field observations. In: Gbadegesin, A. S., Eze, B. E., Orimoogunje, O. O. I., and Fashae, O. A. (eds) Frontiers in Environmental Research and Sustainable Environment in the 21st Century. University of Ibadan Press, Publishing House, University of Ibadan, Nigeria, 2014. [18] Iorkua, A. S. A Gully in the North Bank Area of Makurdi, Benue State, Nigeria. An unpublished M.Sc. thesis submitted to the University of Ibadan, Nigeria, 1999.. [19] Udosen, C. E.. A morphometric Analysis of Gullies in Obotme Area of Akwa Ibom State. An Unpublished M.Sc. Thesis, University of Ibadan, Nigeria, 1991. [20] Ologe, K. O. Gullies in the Zaria area: a preliminary study of headscarp recession. Savanna, 1, pp. 55 – 66, 1972.
Vol. 37, No.2, April 2018
561