Huerta, Schade, Granell (Eds): Connecting a Digital Europe through Location and Place. Proceedings of the AGILE'2014 International Conference on Geographic Information Science, Castellón, June, 3-6, 2014. ISBN: 978-90-816960-4-3
Comparing Knowledge-Driven and Data-Driven Modeling methods for susceptibility mapping in spatial epidemiology: a case study in Visceral Leishmaniasis Mohammadreza Rajabi1, Ali Mansourian1, Petter Pilesjo1, Finn Hedefalk1,Roger Groth, Ahad Bazmani2 1: GIS Center, Department of Physical Geography and Ecosystem Science, Lund University, Sweden Sölvegatan 12, 22362, Lund, Sweden 2: Infectious and Tropical Diseases Research Centre, Tabriz University of Medical Sciences, Tabriz, Iran {Mohammadreza.Rajabi ,Ali.Mansourian, Finn.Hedefalk,Roger.Groth}@nateko.lu.se,
[email protected] ,
[email protected] Abstract The aim of this study is to compare knowledge-driven and data-driven methods for susceptibility mapping in spatial epidemiology. Our comparison focuses on one of the arguably most important requisites in such models, namely predictability. We compare one data-driven modelling method called Radial Basis Functional Link Net (RBFLN - a well-established Neural Network method) with two knowledge-driven modelling methods, Fuzzy AHP_OWA and Fuzzy GIS-based group decision making (multi criteria decision making methods). These methods are compared in the context of a concrete case study, namely the environmental modelling of Visceral Leishmaniasis (VL) for predictive mapping of risky areas. Our results show that, at least in this particular application, RBFLN model offers the best predictive accuracy. Keywords: Visceral Leishmaniasis (VL), spatial epidemiology, prediction, knowledge-driven method, data-driven method.
1
Introduction
As a major epidemiological hazard, Visceral Leishmaniasis (VL) (commonly known as kala-azar) accounts for a great number of human fatalities, and causes significant damage to public health in developing countries especially poor and rural areas [1, 5, 8, 12, 3]. In order to mitigate losses and damages, many spatial susceptibility studies have been conducted to map the locations that are prone to VL outbreak [1, 4, 7, 14]. Most of the studies about spatial epidemiology assume that disease susceptibility is related to specific predisposing factors and that susceptibility can be assessed as long as the predisposing factors and the relationships between the factors and the disease are identified [1]. The mentioned factors are considered to be the intrinsic nature and condition of the environment, which make the area susceptible to be infected but do not actually trigger an outbreak [12]. In this study, we are comparing three popular methods in the context of VL spatial epidemiology: Radial Basis Functional Link Net (RBFLN), Fuzzy Analytical Hierarchy Process (AHP)-OWA (Ordered Weighted Averaging), and Fuzzy Group decision making. Accordingly, the common predisposing factors for VL are land use/land cover, meteorological factors (rainfall, temperature), topographical factors (altitude, river) and socioeconomic factors (access to health-centres, lifestyle) [13] Knowledge driven and data driven strategies reflect two different perspectives in spatial modelling. More specifically, a knowledge driven approach is based on evidence of varying quality, guidelines, and experts’ opinions, while a data driven approach is solely based on the observational data. This paper presents a comparative approach to diseasesusceptibility mapping, which discusses the pros and cons of data-driven approaches versus knowledge-driven approaches. The study is exclusively concerned with VL endemic areas.
2
Materials and methods
2.1
Study area
The study is focused on two districts in Iran including about 800 villages: Kalaybar in the western part of East Azerbaijan province (47.0427° E, 38.864° N), and Ahar, located immediately south of Kalaybar (47.068° E, 38.472° N).
2.2
Data collection
In collaboration with the Infectious and Tropical Diseases Research Centre of the Iranian ministry of health, we collated VL notification data at the village-level, either from central registers or from district centres. Then the information were integrated into one database. Based on [13], eight items were chosen to be the fundamental factors for predictive mapping of VL risky areas for this research: temperature, precipitation, proximity to rivers, altitude, presence of health-centres, land cover, density of dogs, and presence of nomads
2.3
MCDM
Multi criteria decision analysis (MCDA) is a knowledgedriven transparent process supporting decision-makers faced with making numerous, sometimes conflicting, evaluations by highlighting these conflicts aiming to find a compromise. GIS–MCDA is a process that combines geographical data (map criteria) and value judgments (decision-maker preferences and uncertainties) to obtain appropriate and useful supporting documentation [9]. 2.3.1
Fuzzy AHP_OWA
AGILE 2014 – Castellón, June 3-6, 2014
1
VH
Dog
Table 1: The Opinions of five local VL specialist about the degree of effect of eight VL parameters
Health Centres
The purpose of an Artificial Neural Network (ANN) is to build a model of data-generating process through a learning algorithm. ANNs generally consist of several neurons, which are organized in three layers: input, hidden and output. Looney [6] introduced a modified architecture of ANN termed radial basis functional link nets (RBFLN). The main difference of RBFLN is the use of additional links between the input layer and output layer. These extra lines and weights model the linear part of the input–output transformation [6]. The RBFLN network requires two sets of training points: one that defines the presence of the objects or conditions to be predicted (i.e., VL endemic areas) and a second that defines the absence of these objects (i.e., locations where VL incidence are known not to be endemic). The two sets of points are combined as training data.
River
RADIAL BASIS FUNCTIONAL LINK NETS
Rain
2.3.3
Temp
Group decision-making is a situation in which individuals cooperatively make a choice from the existing options. Applying GIS–MCDA for group decision-making forms aggregated individual judgments into a group preference in a manner in which the best compromise can be recognized [2]. Although the GIS–MCDA approaches have traditionally focused on the MCDA algorithms for individual decisionmaking, significant efforts have been made to integrate spatial epidemiology for group decision-making settings. A fuzzy majority approach has been introduced [11] to model the concept of majority opinion in group decisionmaking problems. Using a linguistic quantifier, the fuzzy majority concept can generate a group solution that corresponds to the majority of the decision-makers’ preferences. The linguistic quantifier leads the aggregation process of the individual judgments in such a way that there is no need for rankings of the alternatives of individual solutions.
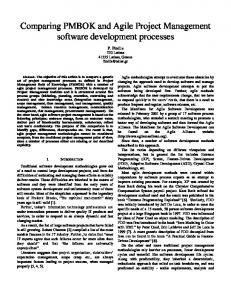
In the first knowledge-driven approach the specified environmental factors were first entered into a fuzzy AHPOWA algorithm to identify susceptive areas in relation to the prevalence of VL. At the first stage, based on the experts opinions (who are local medics and VL specialists) the factors were then classified as “climate” and “intensity of contagion” classes. Temperature, precipitation, rivers, altitude and land cover factors were considered to belong to the “climate” class. The impact of health centres, nomads and density of dogs was assigned to the “intensity of contagion” class. In the next stage, after structuring the criteria, a pair-wise comparison between factor maps was performed according to their effects on VL. The process was indirectly dependent on the knowledge of experts. By weighting of the AHP, the relative importance of each criterion was obtained. For example, in the “climate” class, the weights that were achieved by AHP were as follows: altitude = 0.45, precipitation = 0.263, distance to river=0.103 and temperature = 0.155. Considering the coefficient Consistency Ratio (CR) = 0.015, i.e. < 0.1, the weight values were validated and remained in the calculations. Figure 1b, shows the result map from AHP_OWA. Effective factors and parameters associated with VL outbreaks have been entered in the prediction models (even where VL was epidemic). In the AHP_OWA approach, the achieved prediction data and the registered cases of VL in infected areas have been compared together. When relating risk maps with the infected villages and available information about the patients, the output map indicated that all of the current highly infected villages were predicted to be hazardous areas by Fuzzy AHPOWA (Figure 1b). Then the knowledge of five local experts in the field of VL was generalized in a fuzzy group decision-making process. The main objective was to investigate the current situation of the villages at risk to provide urgent emergency services (Table 1).
Height
Group Decision Making
Results and discussion
Nomad
2.3.2
3
Experts
Fuzzy AHP_OWA is a knowledge-driven method in which the degree of risk and trade-off of decision making can be modelled properly. In this approach, we accomplished the two first steps of the AHP at the first stage. In this regard,, the hierarchical structure of the model would be formed, and the relative importance of the predisposing factors would be determined by conducting pairwise comparisons. At this point, the quantifier-guided OWA methods take the lead for the rest of the analysis. The procedure at this stage involves three main steps [10]: (i) identifying the linguistic quantifier Q, (ii) generating a set of ordered weights associated with Q, and (iii) computing the overall evaluation for each ith location (alternative) at each level of the hierarchy by means of the OWA combination function.
H
M
H
M
M
VH
2
H
M
M
M
H
M
VH
3
VH
VH
H
H
H
H
M
4
H
H
M
L
M
VH
H
5
H
M
M
M
H
H
VH
VH = Very high , H=High , M=Medium , L=Low , VL=Very Low
Figure 1: (a) Distribution of nomadic villages (b) Output map of Fuzzy AHP_OWA (c) Output map of group decision making (d) Output map of RBFLN.
AGILE 2014 – Castellón, June 3-6, 2014
(a)
(b)
(c)
(d)
After gathering information and opinions of five local experts about VL and weighting factors by converting the fuzzy terms to hard numbers, the information was combined at various levels of risk and trade-off using fuzzy linguistic quantifiers (Table.1). On the basis of the knowledge of each of the experts, one thematic map was generated. In each of the generated maps, different levels of risk were assigned to the villages (Figure 1). There should therefore be a fuzzy group decision-making process to identify the villages in which most of local experts and medics agree about the severity of the crisis. The risk level for each area was calculated using a fuzzy majority approach in a fuzzy group decision-making process. A new map was generated that indicates the level of danger for each village. The new map should be useful for prioritizing the provision of the health measures for each village (Figure 1b). The Carl Looney’s RBFLN algorithm that was implemented in Arc Spatial Data Modeller (ArcSDM) has been applied [6].
To generate the input exploratory data for RBFLN in the planned model for VL, the evidential maps were overlaid to create a unique conditions grid. A unique conditions grid consisting of 2699 unique overlay conditions, which is a relatively large number, was generated. In the attribute table of the unique conditions grid, there is one record for each unique overlay condition as well as one field for each evidential map. Thus the unique overlay conditions are ndimensional (n = number of evidential maps) input vectors. The resulting unique condition grid was the input for the RBFLN. For the purpose of modelling using RBFLN, first, an optimum structure for RBFLN in terms of the number of hidden functions as well as the number of iterations for RBFLN training had to be determined. An RBFLN structure with 45 hidden functions and 1000 iterations, resulting in a summed-squared error (SSE) equal to 0.00378, was considered as the most proper one.
AGILE 2014 – Castellón, June 3-6, 2014
Figure 1d shows the result of applying the RBFLN to create a multiclass predictive map for VL. This map is interpreted as susceptibility of the individual cells in the area in relation with the VL endemicity. Using the prediction-rate method, the results of the three susceptibility maps were validated by comparing them with the existing infected areas. The prediction rate can explain how well the VL prediction model predicts VL endemicity. In this study, the prediction-rate results were obtained by comparing the infectious villages in the validation dataset with the three VL susceptibility maps. The areas under the prediction-rate ROC curves (AUC) were calculated. An AUC equals to 1 indicates perfect prediction accuracy (Lee and Dan, 2005). When ROC curves of these three methods were considered together, their overall performances are seen to be close to each other. The most successful method is the RBFLN model. According to the obtained AUC, RBFLN has slightly higher prediction performance than Fuzzy AHP_OWA and Group Decision Making (Figure 2). This may be due to the fact that in the RBFLN model, the training process makes the data richer, and this enrichment makes the RBFLN slightly more successful than knowledge-based models. Figure 2: The areas under the prediction-rate ROC curves (AUC)
4
Conclusion
In this study, the application of one data-driven method, RBFLN, and two knowledge-driven methods (Fuzzy AHP_OWA and fuzzy group decision making) has been explored for predictive mapping in spatial epidemiology for VL disease. The results indicate that, in this particular application, the RBFLN model obtained the best predictive accuracy. Therefore this model may be preferred when mapping the VL susceptibility. Nevertheless, the knowledge-driven methods are also capable of reliably mapping areas of high risk for VL, and they can easier map the risk and trade-off from the decision makers’ opinions.
References [1]. D. S. Barbosa, V. S. Belo, M. E. S. Rangel, and G. L. Werneck, “Spatial analysis for identification of priority areas for surveillance and control in a
visceral leishmaniasis endemic area in Brazil,” Acta Tropica, 131; 56–62, 2014. [2]. S. Boroushaki and J. Malczewski. Using the fuzzy majority approach for GIS-based multicriteria group decision-making. Computers & Geosciences, 36; 302–312, 2010. [3]. F. Chappuis, S. Sundar, A. Hailu, H. Ghalib, S. Rijal, R. W. Peeling, ... and M. Boelaert. Visceral leishmaniasis: what are the needs for diagnosis, treatment and control. Nature Reviews Microbiology, 5(11); 873-882, 2007. [4]. S. A. Correa Antonialli, T. G. Torres, A. C. Paranhos Filho, and J. E. Tolezano, “Spatial analysis of American Visceral Leishmaniasis in Mato Grosso do Sul State, Central Brazil,” Journal of Infection, vol. 54(5); 509–514, 2007. [5]. S. Garg, R. Tripathi, and K. Tripathi, “Oral mucosal involvement in visceral leishmaniasis,” Asian Pacific Journal of Tropical Medicine, 6(3); 249–250, 2013. [6]. C. Looney. Radial basis functional link nets and fuzzy reasoning: Neurocomputing, 48; 489–509, 2002. [7]. M. S. Fernández, O. D. Salomón, R. Cavia, A. A. Perez, S. A. Acardi, and J. D. Guccione, “Lutzomyia longipalpis spatial distribution and association with environmental variables in an urban focus of visceral leishmaniasis, Misiones, Argentina,” Acta Tropica, 114(2); 81–87, 2010. [8]. T. Hazratian, Y. Rassi, M. A. Oshaghi, M. R. Yaghoobi-Ershadi, E. Fallah, M. R. Shirzadi, and S. Rafizadeh, “Phenology and population dynamics of sand flies in a new focus of visceral leishmaniasis in Eastern Azarbaijan Province, North western of Iran,” Asian Pacific Journal of Tropical Medicine, 4(8); 604–609, 2011. [9]. J. Malczewski and C. Rinner. Exploring multicriteria decision strategies in GIS with linguistic quantifiers: A case study of residential quality evaluation. J Geograph Syst. 7; 249–268, 2003. [10]. J. Malczewski, J. Multicriteria decision analysis for collaborative GIS. In: Balram, S., Dragicevic , S. (Eds.), Collaborative Geographic Information Systems. Idea Group Publishing, Hershey, 167–185, 2006. [11]. G. Pasi and R. R. Yager, Modeling the concept of majority opinion in group decision-making. Information Sciences 176; 390–414, 2006. [12]. A. T. Peterson, R. S. Pereira, and V. F. de C. Neves, “Using epidemiological survey data to infer geographic distributions of leishmaniasis vector species,” Revista da Sociedade Brasileira de Medicina Tropical, 37(1); 10–14, 2004. [13]. M. Rajabi, A. Mansourian and A. Bazman. Susceptibility mapping of visceral leishmaniasis based on fuzzy modelling and group decisionmaking methods, Geospatial Health 7(1); 37-50, 2012.
AGILE 2014 – Castellón, June 3-6, 2014
[14]. L. Saraiva, J. D. Andrade Filho, A. L. Falcão, D. A. A. de Carvalho, C. M. de Souza, C. R. Freitas, C. R. Gomes Lopes, E. C. Moreno, and M. N. Melo, “Phlebotominae fauna (Diptera: Psychodidae) in an urban district of Belo Horizonte, Brazil, endemic for visceral leishmaniasis: Characterization of favored locations as determined by spatial analysis,” Acta Tropica, 117(2); 137–145, 2011.


![Defining and Visualizing DataDriven Personas - WordPress.com [PDF]](https://m.moam.info/img/260x300/defining-and-visualizing-datadriven-personas-wordp_6479c223098a9e47158b45b1.jpg)


