B. Öztayşi, İ. Uçal/ Comparing MADM Techniques For Use In Performance Measurement
COMPARING MADM TECHNIQUES FOR USE IN PERFORMANCE MEASUREMENT Başar Öztayşi∗ İstanbul Technical University Istanbul / Turkey E-mail:
[email protected] İrem Uçal İstanbul Technical University Istanbul / Turkey E-mail:
[email protected] ABSTRACT Performance measurement has become one of the success factors in business world. Organizational performance measurement can be stated as a multi attribute decision problem. In this study, we evaluate the MADM techniques as a potential tool that can take place in performance measurement systems. In this manner, we will be discussing the performance measurement frameworks in the literature and then analyze current analytic applications in the area. The specific requirements in organizational performance measurement are emphasized and the possible MADM techniques are evaluated according to these requirements. Keywords: Performance, performance measurement, MADM techniques
1. Introduction Denotation of performance is that the concept is related to a goal, accomplishment of an action, and the quality of the action. The performance literature defines performance as a socially constructed concept that needs to be defined before the measurement process (Wholey, 1996). It is also stated that a company’s definition of performance is related to its goals and environment, and can change by time. The studies about performance can be grouped into two. In the first group, the researches focus on models and frameworks about what to measure in other words, performance indicators. On the other hand, the second group focuses on analytical techniques and quantification of performance. In the performance literature there are different models or approaches that take place in the first group. In order to make an overall analysis of these methods, 17 of these models are evaluated according to selected key properties. These criteria that are used in the evaluation are; convenience to make individual performance judgements (Meyer, 2002), ability to provide summarized information about performance of past activities (Meyer, 2002), and ability to provide a future look to company’s performance (Meyer, 2002), balance between performance indicators (Kaplan and Norton 1992) alignment with the strategy (Neely and Adams, 2001) and flexibility (Bititci et. Al. 2000; Youngblood and Collins,2003) . Analyzing the PM literature, one can realize that most frequently used analytical models are cognitive maps, regression analysis, neural networks, analytical hierarchy process, multi attribute utility function, and simple multi attribute rating technique and data envelopment analysis (Öztayşi, 2009). These techniques generally focus on determining the importance of indicators or defining tradeoffs between indicators and definition of relationship between the indicators (Abu-Suleiman, 2006). ∗
Corresponding author
1
Proceedings of the International Symposium on the Analytic Hierarchy Process 2009
Performance measurement is a process that is accomplished after an activity which makes a reference to the quality or success of the activity and also gives insight about future performance (Öztayşi, 2009). It is also declared that PM is a combination of companies’ characteristics that are numerical expressed (Folan, 2007). In another word performance measurement is process of choosing different attributes (and indicators about them) and generating a combined evaluation of these attributes. In this study, we try to model the PM as a MADM problem and evaluate the techniques according to defined requirements of PM. This paper is composed of five sections. In the following section performance and performance measurement literature is visited in order to get a better understanding about the nature of PM. The third section focuses on the analytical models that are used in the literature. The techniques are summarized and the aim of usage is determined. In the fourth section, the PM is modeled as a MADM problem and the related tools are evaluated in order to represent the potential to utilize. The last section contains brief summary and future studies.
2. Performance Measurement Literature Before going into the performance measurement literature, it is important to understand the meaning of “performance”. Oxford and Merriam-Webster dictionaries provide us the following definitions • • • • • •
The execution of an action, something accomplished The fulfillment of a claim, promise, or request The capabilities of a machine or product. An act of performing a play, concert, song, etc. The quality of realization a process, operation or an action Accomplishment of a command or a goal
These definitions address three main concepts about performance. Performance is related to a goal or command, performance is also related to accomplishment of an activity and also performance refers to quality of the accomplished activity. In the performance measurement literature, there are three most important studies that focus on the meaning of performance concept. These are: Lebas, 1995; Wholey, 1996 and Meyer, 2002. Wholey (1996) emphasize that performance is not an objective reality that stands for a measurement. On the contrary, performance is a socially constructed concept. That’s why in order to measure the performance should be defined and a consensus should be maintained about the borders of the concept. It is mentioned that the definition of performance of a company can vary depending on the time and the place (Lebas, 1995). Lebas emphasize that, performance is a combination of goals which are determined by the constraints and conditions, and relational models that enable the company to accomplish these goals on time. Meyer (2002), defines that performance should be related both to the action and the consequence of that action. Both the action and the consequences should be benchmarked to a standard in order to make a reference to a degree of achievement. As a synthesis of the performance measurement literature it can be determined that the organizational performance: • • • •
Is not an objective reality, should be defined before measurement Is a process that take place after an action Depends on the time and the location Is related to vision and the strategy of the company
2
B. Öztayşi, İ. Uçal/ Comparing MADM Techniques For Use In Performance Measurement
•
Should give insight about the forthcoming performance
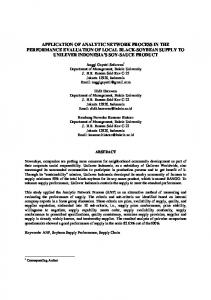
Folan (2007) defines three key concepts about performance measurement.These are relation, goal and characteristics. Relation emphasizes the relation of the company with its environment. Basically, the performance of a company should be measured by its effect on the related environment, such as its share in the markets that it operates. The second concept “goal” defines that the performance of a company is about what it wants to achieve. The performance should not be measured according to the goals of other firms or associations. The last concept, characteristics determines that the performance measurement should be composed of summarized, related characteristics of a company, such as cost, quality and flexibility. Folan (2007) states that in order to measure the performance; the mentioned characteristics should be numerically expressed and measured by performance indicators. As a consequence of these statements it can be mentioned that the performance measurement is a combination of different numerical performance indicators. In another perspective, performance measurement is a multi attribute evaluation or decision making process. After a quick view to the questions “what is performance?” and “how to measure the performance?” another important question about performance can be stated as “why to measure the performance?”. Meyer (2002) defines 7 purposes of performance measurement that takes place within the different levels of the companies. Look back and look ahead are the purposes of performance measurement in the top levels (Figure 1). Performance measurement enables companies to look back and evaluate the past activities and look ahead and prepare for the forthcoming performance. Motivate and compensate, on the other hand are the purposes for the lower levels of the company. Each individual can evaluate personal performance and compensate. At the same the performance measurement can motivate the individuals for the future. In larger and more complicated firms, measures are also expected to roll up from the bottom to the top of the organization, to cascade down from top to bottom, and to facilitate performance comparisons across business and functional units. Figure 1: Seven purposes of Performance Measurement (Meyer 2002)
The conventional performance measurement models are based on financial indicators of the companies. The models were widely used but in a research it is determined that the conventional models cause the managers to focus on the current financial results which result a loss in the long term (Kaplan and Norton 1996). This basic reason caused a search for a new performance measurement model/framework. The most important characteristics of the upcoming models can be defined as, balance between the utilized performance indicators, alignment of the model with the company strategies and flexibility (dynamism) of the model according to the change in the conditions of the company.
3
Proceedings of the International Symposium on the Analytic Hierarchy Process 2009
The proposed performance models / frameworks are listed in table 1 where the models are evaluated according to the mentioned three properties and the purposes declared by Meyer (2002) which are selected as individual evaluations, look back and look ahead. The focus of the model is also mentioned at the same table. The symbols are used to define the properties of the models, “+” means that the model satisfies the property while “–” means that the property is not provided. The “¤” sign symbolizes that the property is satisfied to some degree or the user is free to modify.
Performance Prism (Kennerley and Neely, 2002) Activity-Based Costing (Turney, 1991) SMART System (Cross and Lynch, 1989) Performance Measurement Survey (Dixon et al, 1990) Performance Measurement Matrix (Keegan et al, 1989) Performance Measurement Framework for Service (Fitzgerald et al, 1991)
Time based measurement of the processes Time based costing of products Efficiency, activities, inputs, inventory and money-time Corporate performance Identification of the performance improvement areas Considers the perspectives: Shareholder satisfaction, strategies, processes, capabilities Costing of activities and resources Performance indicators for different levels of the company. Preparation for the prior performance improvement areas. Groups the corporate performance indicators as financial, non-financial, exterior and interior. Analyzes the performance indicators with a cause and effect relation
4
Balanced Performance
Financial ratios
Look Ahead
Traditional Performance Measurement Time based performance measurement system. (Stalk, 1988) Time based Costing (Boons, 2002) Theory of Constraints (TOC) and throughput accounting (Goldratt and Cox, 1992) Tableau de Bord (Eccles, 1991) Performance Pyramid (Wedman and Graham, 1998)
Look Back
Focus of the model
Individual Evaluations
Models / Frameworks
Alignment with strategies Flexibility / Dynamism
Table 1. Performance Measurement Models and Evaluations
-
+
-
-
-
-
-
-
+
-
-
-
-
+
-
-
-
-
-
+
+
+
-
-
+
+
+
+
+
¤
-
-
-
+
-
-
+
+
¤
¤
+
¤
-
+
+
¤
-
-
-
+
-
¤
¤
+
-
-
-
+
-
-
-
+
-
-
-
¤
¤
¤
-
+
+
¤
B. Öztayşi, İ. Uçal/ Comparing MADM Techniques For Use In Performance Measurement
Balanced Scorecard and Norton, 1992)
(Kaplan
Defines a corporate performance system with, financial, customer, process and learning and growth perspectives.
Macro Process Model (Brown, Models the processes as inputs, 1996) production system, outputs, outcomes and goals. Consistent performance Defines the steps for management system (Flapper implementing performance et. al. 1996) measurement. Cambridge Performance Design and tracing of the Measurement Process (Neely et performance indicators al. 1997) Quality Frameworks (Macey, Standard and corporate 2001; Neely and Adams, 2001) performance
+
+
+ +
-
+
-
-
+
¤
¤
+
-
+
¤
+
+
-
-
¤
¤
+
-
¤
¤
+
¤
¤
-
-
It can be determined from the table that the most suitable model for performance measurement is the Balanced Scorecard (BSC). This is why the model has great success both in professional and academic world.
3. Quantification of Performance Besides the conceptual studies about the performance measurement another research area about performance measurement focus on the quantification of the performance. Abu-Suleiman (2006) classifies the analytical researches in three groups: • • •
The analytical models that focus on determining the importance of the performance indicators The analytical models that defines the balance and tradeoffs between the indicators The models that focus on the defining the relations between the performances indicators.
In this section, as a literature review, the most frequently used analytical models in the literature is summarized. These methods are cognitive maps, regression analysis, neural networks, analytical hierarchy process, multi attribute utility function, simple multi attribute rating technique and data envelopment analysis. Cognitive maps are defined as a term that describes an individual's internal mental representation of the concepts and relations among concepts that the individual uses to understand their environment (Tolman, 1948). Cognitive maps are thus seen as internally represented schemas or mental models for particular problem-solving domains that are learned and encoded as a result of an individual's interaction with their environment. In the performance measurement area, cognitive maps are used to define the perceived performance, concepts that affect the performance and the relationship between these concepts. Wright and Chung (2007) investigate how managers see, interpret and make sense of their performance management system experiences. McCormack et al. (2005) in their study, proposed an approach to building a high-level business process view of the enterprise, based on cognitive mapping techniques. Senior (1996) identifies constructs of team performance. Marr et al. (2004) used cognitive maps to identify the “value map” which stands for the definition of how company resources are used to create value.
5
Proceedings of the International Symposium on the Analytic Hierarchy Process 2009
Regression analysis is a statistical tool for modeling the relationship between one or more dependent variables and independent variables. Multivariate regression describes models that have more than one response variable. In the field of performance measurement regression analysis is basically allocated to generate performance prediction models and determining the factors that effect performance. Wood (2006) analyzed data of small business performance using logistics regression to determine a model that predicts performance of the firms. Xia and Proverbs (2003) compared contractor performance of companies from Japan, UK and USA to provide benchmarks. Using multiple regression analysis they showed the factor that contractor performance depends on. On an other similar study, Gomes et. al. analyzed performance of protégées firms and using multiple regression they found out the importance of non-financial measures importance on overall performance. Regression analysis is also used to discover the relationship between specific factors and the overall performance such as relationship between advanced manufacturing technologies performance and investments, planning and implementation activities (Monge et. al. 2006). Artificial Neural Networks (ANNs) are mathematical models inspired from biological nervous systems. ANNs accept a large number of inputs and learn solely from training samples. As mathematical models for biological nervous systems, ANNs are useful in establishing relationships between inputs and outputs of any kind of system. In an early study in the field of performance measurement, Pu et al (1995) tried to determine the feasibility of using ANN in determining the parameters that effect plant performance and the prediction of overall performance. In order to test the validity, ANN results were compared with multiple regression analysis and the validity of the model was found to be superior. Kong et al (2004) developed an performance diagnostics code for a gas tribune. Using neural networks the diagnostics systems could detect the single fault types such as compressor fouling, compressor turbine erosion and power turbine erosion as well as multi component combined fault types. In another study Hui et al. (2007) investigated the use of artificial neural networks to predict the performance of fabrics. The AHP, is a popular tool for multiple criteria decision-making. The purpose of AHP is to capture the human’s knowledge when multi-person and multi-attribute decision making problems are considered. The AHP is aimed at integrating different criteria into a single overall score for ranking decision alternatives. Recently the AHP has been applied to several performance measurement problems Yurdakul (2002) measured the performance of manufacturing systems using AHP. Ohdar et. al. (2004) utilized AHP with fuzzy approach to evaluate supplier performance. Sharma and Bhagwat (2007) built an integrated Balanced Scorecard and Analytical Hierarchy Process model for supply chain management evaluation. Thakkar et. al. (2007) used AHP to compose an integrated model for developing balanced scorecard for a real life case company. AHP is also used in benchmarking literature. Rangone (1996) developed an AHP based benchmarking model for manufacturing departments. Partovi (1992) proposed a methodology for selecting the activities to be benchmarked using AHP. Gilleard and Yat-lung (2004) applied analytic hierarch process for facility benchmarking. Multi Attribute Utility theory (Keeney and Raiffa 1976) is one of the major analytical tools associated with the field of decision analysis. A MAU analysis of alternatives explicitly identifies the measures that are used to evaluate the alternatives, and helps to identify those alternatives that perform well on a majority of these measures, with a special emphasis on the measures that are considered to be relatively more important (Butler 2001). MAUT is generally utilized in the performance measurement literature as a overall performance measurement tool and also used for determining the best-in-class performers. Collins et al. (2006) investigated 14 warehouses in order to determine the best performing one using MAUT. Min (1994) applied Multi Attribute Utility Theory approach to international supplier selection. (Jimenez et. al., 2002) constructed a decision support system based on MAUT for selecting an optimal strategy in the context of restoration of a contaminated lake.
6
B. Öztayşi, İ. Uçal/ Comparing MADM Techniques For Use In Performance Measurement
The Simple Multi Attribute Rating Technique (SMART) is a variant of the MAUT method. The method utilizes simple utility relationships. Convenient scale can be applied by data normalization to define the utility functions. Three, four and five point scales are the most common ones that are used in FM customer satisfaction surveys. Data Envelopment Analysis (DEA), firstly developed by Charnes et al. (1978) and extended by Banker (1984), is a Linear Programming methodology to measure the efficiency of multiple Decision Making Units (DMUs) that have multiple inputs and outputs. DEA is recognized as a valuable decision support tool for managerial control and organizational diagnosis. In the DEA methodology, efficiency is defined as a weighted sum of outputs to a weighted sum of inputs. In the performance literature DEA has been used for overall performance measurement and benchmarking of a group of DMUs. Haugland et. al. (2007) allocated DEA in the purpose of analyzing the performance of service industry. Avkiran, Rowlands (2008), used DEA stochastic frontier analysis to explain the variation in organizational performance in terms of the operating environment, statistical noise and managerial efficiency. For more applications these researches can be investigated; Wu 2009, Bala and Cook (2003), Eastona et. al. (2002).
4. Modeling Performance Measurement as a MADM Problem and Comparison of Techniques As we implied in the previous chapters, performance measurement is a process that is accomplished after an activity which makes a reference to the quality or success of the activity and also gives insight about future performance. Meyer (2002) identifies the different purposes of PM in the different levels of the companies. Folan (2007) states that PM is a combination of companies’ characteristics that are numerical expressed. In another perspective, performance measurement is process of choosing different attributes (and indicators about them) and generating a combined evaluation of these attributes. Multi criteria decision making (MCDM) refers to making decisions in the presence of multiple, usually conflicting criteria. There are two groups with in the MCDM, multi attribute decision making (MADM) which deals with selection problems and, Multi Objective Decision Making (MODM) which deals with design problems (Venkata, 2007). Defining the performance measurement as a quantification of a status, MADM seems closer to be utilized as a tool. But PM has some unique requirements which are: Ability to reflect meaningful numerical results that shows the overall performance of a period (Overall Evaluation) Ability to reflect the performance of any sub-division or perspective (Sub Evaluation) Ability to trace the performance improvements by time (Trace Performance) Should be flexible to design according to companies preferences (Flexible) Should be dynamic so that firm can change the model when needed (Dynamic) Should give insight about future performance (Future Insight) The satisfaction levels of these requirements by the selected MADM are shown in Table 2. Stand alone evaluation means the ability of the model to provide meaningful results by itself, without any comparisons. This is a immense requirement because PM is related to companies strategies and goals so it is not possible to make comparisons with other firms. Also it’s not always significant to make comparisons with previous evaluation periods because the outer conditions can be subject to change. Stand alone evaluation criteria can be fulfilled with MAUT and SMART techniques since the basics of the techniques are based on utility / value functions. It is also fulfilled by AHP rating in which all the criteria can be divided into meaningful sections and each section is given a grade or numerical value. Since the classical AHP is based on comparisons, it is not possible to fulfill the criteria. Similarly, Axiomatic design and outranking methods (Topsis / Electre) can be used as a selection tool but they need other alternatives to be compared.
7
Proceedings of the International Symposium on the Analytic Hierarchy Process 2009
Simple Additive Weighting
Future Insight
Dynamic
Performance Flexible
Trace
Evaluation Sub Evaluation
Stand
MADM Techniques
Overall
Alone
Table 2. MADM Techniques and Performance Measurement Requirements
-
-
-
+
+
-
Weighted Product Method
-
-
-
+
+
-
Multi Attribute Utility Theory
+
-
+
+
+
-
SMART
+
-
+
+
+
-
Analytical Hierarchy Process
-
+
-
+
+
+
+
+
?
+
+
+
Axiomatic Design
-
-
-
+
+
-
Topsis/Electre
-
-
-
+
+
-
Method
Analytical Hierarchy Process Rating
Besides providing an overall performance result, it is important for the technique to supply subevaluations. AHP based models can fulfill the requirement since AHP enables the decision maker to build a multi-level models it is possible to make evaluations of each item in each levels. Another requirement of PM is to trace the performance change by time. This can be fulfilled with generation of meaningful numerical results. MAUT and SMART techniques are able to fulfill this requirement while AHP rating has some concerns. Since the AHP rating divides the measured values in to groups and assigns value to each group one cannot trace the changes if the results are in the same group. Let’s say, the revenue indicator is evaluated in 4 groups which are: 0 – 10 K; 10K – 50 K, 50K-100K and 100K and higher. If the measured value of the indicator in the first and second period is 11K and 49K consecutively, the change in the revenue cannot be identified in the overall evaluation because both values are in the same interval. Flexibility and dynamism criteria are totally satisfied by all the techniques because in each technique, the decision maker is free to select the criteria and revise the model any time he wishes. In order to give future insight, the selected model should be able to supply sub-evaluations. To give an example from the mostly utilized PM model BSC; in the model, the performance is evaluated in 4 perspectives, which are finance, customer, process and growth and learning. The finance perspective gives information about the current situation but the last three has a role to give insight about the future. If the used technique cannot provide a hierarchical model, it won’t be able to give sub evaluations such as customer performance or process performance. So these criteria can only be satisfied by AHP models.
5. Conclusion and Future Studies Performance measurement needs an integration of evaluation models and analytical methods. In this study we tried to give insight about both the business perspective and the analytical methods. Balanced Scorecard seems to be the most convenient evaluation model for PM. On the analytical methods part of PM, the problem can be defined as a multi attribute evaluation of a current company. In this study we
8
B. Öztayşi, İ. Uçal/ Comparing MADM Techniques For Use In Performance Measurement
defined the requirements of PM. While MADM techniques show a possibility to fulfill the requirements of PM, none of them can fulfill the entire requirement at the same time. AHP Rating model seems to be the nearest to fulfill the requirements. As a future study, composite models can be generated and be experienced in some case studies. AHP models can be enriched by normalization of indicators and usage of utility functions in order to make stand alone numerical results. Also all mentioned models can be revised to search for extensions to fulfill the requirements of PM. REFERENCES Abu-Suleiman, A., 2006. An Analytical Performance Management Framework Enabling Enterprise Strategy Management, PhD Thesis, University of Texas, Arlington. Avkiran, N.K. & Rowlands, T., 2008. How to better identify the true managerial performance: State of the art using DEA, Omega, 36, 317-324. Bala, K. & Cook, W.D., 2003. Performance measurement with classification information: an enhanced additive DEA model, Omega, 31, 439-450. Banker, R.D., 1984. Estimating Most Productive Scale Size Using Data Envelopment Analysis, European Journal of Operational Research, 17, 35-44. Bititci, U.S., Utrevor, T., and Begemann, C., 2000. Dynamics of performance measurement systems, International Journal of Operations & Production Management, 20, 692-704.
Boons, N.A.M., 2002. An attempt to construct a value-based costing system: Timebased Costing, Retreived from www.fbk.eur.nl/PRJ/ RIFM/ WorkingPapers / wp2000_1.doc. Brown, M.G., 1996. Keeping score: using the right metrics to drive world-class performance, Quality Resources, New York. Butler, J., Morrice, J. & Mullarkey, P.W., 2001. A Multiple Attribute Utility Theory Approach to Ranking and Selection, Management Science, 47, 800-816. Charnes, A., Cooper,W.W. & Rhodes, E., 1978. Measuring Efficiency of Decision Making Units, European Journal of Operational Research, 3, 429-444. Collins, T.R., Rossetti, M.D., Nachtmann, H.L. & Oldham J.R., 2006. The use of multi-attribute utility theory to determine the overall best-in-class performer in a benchmarking study, Benchmarking: An International Journal, 13, 431-446. Cross, K.F. & Lynch, R.L., 1989. The "SMART" way to define and sustain success, National Productivity Review, 8, 23-33. Dixon, J.R., Nanni, A.L. & Vollmann, T.E., 1990. The new performance challange: measuring operations for world-class competition. Dow Jones-Irwin, Homewood, Illinois. Easton L. , Murphy D.J. & Pearson J.N., 2002. Purchasing performance evaluation: with data envelopment analysis, European Journal of Purchasing & Supply Management, 8 ,123–134. Eccles, R.G., 1991. The Performance Measurement Manifesto, Harvard Business Review, 69, 131137. Folan, P., Browne, J. & Jagdev, H., 2007. Performance: Its meaning and content for today's business research, Computers in Industry, 58, 605-620. Fitzgerald, L., Johnston, R., Silvestro,T.J. & Voss, C., 1991. Performance measurement in service business, The Chartered Institute of Management Accountants, London. Flapper, S., Fortuin, L. & Stoop, P., 1996. Towards consistent performance management systems, International Journal of Operations & Production Management, 16, 27-37. Gomes, C.F., Yasin, M.M. & Lisboa, J.V., 2004. An examination of manufacturing organizations’ performance evaluation, International Journal of Operations & Production Management, 24, 488-513. Gilleard, J.D. & Yat-lung, P.W., 2004. Benchmarking facility management: applying analytic hierarchy process, Facilities Valume, 22, 19-25. 9
Proceedings of the International Symposium on the Analytic Hierarchy Process 2009
Goldratt, E.M. & Cox, J., 1992. Great Barrington, The goal: a process of ongoing improvement, North River Press, MA. Haugland, S.A., Myrtveit, I. & Nygaard, A., 2007. Market orientation and performance in the service industry: A data envelopment analysis, Journal of Business Research, 60, 1191–1197. Hui, P.C.L, Chan, K.C.C, Yeung, K.W. & Ng, F.S.F., 2007. Application of artificial neural networks to the prediction of sewing performance of fabrics, International Journal of Clothing Science and Technology, 19, 291-318. Jimenez, A., Rios-Insua, S. & Mateos, A., 2003. A decision support system for multiattribute utility evaluation based on imprecise assignments, Decision Support Systems, 36, 65-79. Kaplan, R. S. & Norton, D.P., 1992. The balanced scorecard-measures that drive performance, Harvard Business Review, 70, 71–79. Kaplan, R.S. and Norton, D.P., 1996. Translating Strategy into Action: The Balanced Scorecard, Harvard Business School Press, Boston. Keeney, R.L. and Raiffa, H., 1976. Decisions with Multiple Objectives, Wiley, New York. Kennerley, M. & Neely, A., 2002. Performance measurement frameworks: A review, Cambridge University Press, Cambridge, New York, NY. Keegan, D.P., Eiler, R.G. & Jones, C., 1989. Are your performance measures obsolete? Management accounting, June, 12, 45-50. Kong, C., Ki J., Kang, M. & Kho, S., 2004. Intelligent performance diagnostics of a gas turbine engine, Aircraft Engineering and Aerospace Technology V, 76, 391–397. Lebas, M., 1995. Performance measurement and performance management, International, Journal of Production Economics, 41, 23–25. Marr, B., Schiuma, G. & Neely, A., 2004. The dynamics of value creation: mapping your intellectual performance drivers, Journal of Intellectual Capital, 5, 312-325. McCormack, K. & Rauseo, N., 2005. Building an enterprise process view using cognitive mapping, Business Process Management Journal, 11, 63-74. Meyer, M.W., 2002. Rethinking performance measurement: beyond the balanced scorecard, Cambridge University Press, New York. Min, H., 1994. Supplier Selection: A Multi-attribute Utility Approach, International Journal of Physical Distribution & Logistics Management, 24, 24-33. Monge, C.A.M., Rao, S.S., Gonzaler, E.M. & Sohal, A.S., 2006. Performance measurement of AMT: a cross-regional study, Benchmarking: An International Journal, 13, 135-146. Neely, A., Richards, H., Milles, J., Platts, K. & Bourne, M., 1997. Designing performance measures: a structure approach, International journal of Operations & Production Management, 17, 1131-1152. Ohdar, R. & Ray, P.K., 2004. Performance measurement and evaluation of suppliers in supply chain: an evolutionary fuzzy-based approach, Manufacturing Technology Management, 15, 723–734. Öztaysi, B., 2009. Müşteri İlişkileri Yönetiminde Etkinliği Arttırmak İçin Bir Bulanık Model Önerisi, PhD Thesis, Istanbul Technical University, Turkey. Partovi, F.Y., 1994. Determining What to Benchmark Determining What to Benchmark: An Analytic Hierarchy Process Approach, International Journal of Operations & Production Management, 14, 25-39. Pu, H. & Hung, Y., 1995. Use of artificial neural networks, Environmental Management and Health, 6, 16-27. Rangone, A., 1996. An analytical hierarchy process framework for comparing the overall performance of manufacturing departments, International Journal of Operations & Production Management, 16, 104-119. Senior, B., 1996. Team performance: using repertory grid technique to gain a view from the inside, Journal of Managerial Psychology, 11, 26-32. Sharma, M.K. & Bhagwat, R., 2007. An integrated BSC-AHP approach for supply chain management evaluation, Measuring Business Exellence, 11, 57-68.
10
B. Öztayşi, İ. Uçal/ Comparing MADM Techniques For Use In Performance Measurement
Stalk, G., 1988. Time – the next source of competitive advantage, Harvard Business Review, 64, 41-51. Thakkar, J., Deshmukh, S.G., Gupta, A.D. & Shankar, R., 2007. Development of a balanced scorecard; An integrated approach of Interpretive Structural Modeling (ISM) and Analytic Network Process (ANP), International Journal of Productivity and Performance Management, 56, 25-59. Tolman, E., 1948. Cognitive Maps in Rats and Men, Psychological Review, 55, 189-208. Turney, P.B., 1991. Common Cents: The ABC Performance Breakthrough, Cost Technology, Hillsboro, OR. Wedman, J.F. & Graham, S.W., 1998. Introducing the concept of performance support using the performance pyramid, Journal of Continuing Higher Education, 46, 8-20. Wood, E.H., 2006. The internal predictors of business performance in small firms: A logistic regression analysis, Journal of Journal of Small Business and Enterprise Development, 13, 441-453. Wright, R.P. & Cheung, F.K.K., 2007. Articulating appraisal system effectiveness based on managerial cognitions, Personnel Review, 36, 206-230. Wu, D.D., 2009. Performance Evaluation: an Integrated Method Using Data Envelopment Analysis and Fuzzy Preference Relations, European Journal of Operational Research, 194, 227-235. Wholey, J., 1996. Formative and summative evaluation: related issues in performance measurement, Evaluation Practice, 17, 145-149. Xiao, H. & Proverbs, D., 2003. Factors influencing contractor performance: an international investigation, Engineering, Construction and Architectural Management, 10, 322-332. Venkata R. R.,2007. Decision Making in the Manufacturing Environment, Chapter 3: Introduction to Multi Attribute Decision-making (MADM) Methods. Youngblood, A. and Collins, T., 2003. Addressing Balanced Scorecard Trade-Off Issues Between Performance Metrics Using Multi-Attribute Utility Theory, Engineering Management Journal, 15, 11-17.
Yurdakul, M., 2002. Measuring a manufacturing system’s performance using Saaty’s system with feedback approach, Integrated Manufacturing Systems, 13, 25-34.
11