Hindawi Publishing Corporation BioMed Research International Volume 2014, Article ID 297808, 8 pages http://dx.doi.org/10.1155/2014/297808
Research Article Comparing Microspheres with Different Internal Phase of Polyelectrolyte as Local Drug Delivery System for Bone Tuberculosis Therapy Gang Wu,1,2 Long Chen,1,2 Hong Li,3 Chun-Ling Deng,1,2 and Xiao-Feng Chen1,2 1
School of Materials Science and Engineering, South China University of Technology, Guangzhou 510640, China National Engineering Center for Tissue Restoration and Reconstruction, Guangzhou 510006, China 3 Department of Materials Science and Engineering, Jinan University, Guangzhou 510632, China 2
Correspondence should be addressed to Gang Wu;
[email protected] Received 7 November 2013; Revised 31 December 2013; Accepted 12 January 2014; Published 23 February 2014 Academic Editor: Jiang Chang Copyright © 2014 Gang Wu et al. This is an open access article distributed under the Creative Commons Attribution License, which permits unrestricted use, distribution, and reproduction in any medium, provided the original work is properly cited. We use hydrophobic poly(lactic-co-glycolic) acid (PLGA) to encapsulate hydrophilic ofloxacin to form drug loading microspheres. Hyaluronic acid (HA) and polylysine (Pls) were used as internal phase additives to see their influences on the drug loading and releasing. Double emulsion (water-in-oil-in-water) solvent extraction/evaporation method was used for the purpose. Particle size analysis display that the polyelectrolytes have low impact on the microsphere average size and distribution. Scanning electron microscope (SEM) pictures show the wrinkled surface resulted by the internal microcavity of the microspheres. Microspheres with HA inside have higher drug loading amounts than microspheres with Pls inside. The loading drug amounts of the microspheres increase with the HA amounts inside, while decreasing with the Pls amounts inside. All the polyelectrolytes adding groups have burst release observed in experiments. The microspheres with Pls internal phase have faster release rate than the HA groups. Among the same polyelectrolyte internal phase groups, the release rate increases with the amounts increasing when Pls is inside, while it decreases with the amounts increasing when HA is inside.
1. Introduction Tuberculosis (TB) is a potentially fatal contagious disease which mainly affects pulmonary system. General method for the disease treating is 9 to 12 months of multidrug chemotherapy. In all diagnosed with this disease, 10 to 20 percent bone infection is reported [1, 2]. In complicated bone infection cases, infection foci debridement and internal fixation were chosen by doctors [3]. Apart from the surgery, antitubercular drug therapy was still indispensable for a time period [4, 5]. Filling the cavity after the debridement using autograft/allograft and implanted materials would remodel the defected bone and restore the function. The material implanted in the cavity after debridement serves as an “in vivo bioreactor” wherein the engineering of the neotissue is achieved by invocation of a healing response within the bioreactor space. Providing the implanted scaffold with the in situ
drug release function is a promising drug administration mode to therapy the patients infected by bone tuberculosis. It offers a more effective method for specific site delivery, drug dosage optimizer, and release duration simultaneously with new bone regeneration [6, 7]. Furthermore, when combining the growth factors in scaffold, better recovering results are expected [8–13]. That will be very attractive for bone TB therapy in the future. Ofloxacin has antitubercular activity and has lower hepatotoxicity than the traditional first-line antitubercular drugs (ATD). Moreover, comparing more and more TB involving strains resistant cases to the first-line ATD [14, 15], only a few cases reported the strain resistant to ofloxacin. That makes it currently the most commonly used agents against TB [16], especially for treating patients with underlying chronic liver diseases [17]. To encapsulate this drug effectively is important for the bone TB local drug release systems [18–20].
2
BioMed Research International Table 1: Concentration of internal phase additives.
Internal phase Hyaluronic acid Polylysine
None (Wt/V%) 0 0
Group 1 (Wt/V%) 0.1 0.25
Group 2 (Wt/V%) 0.3 0.75
Group 3 (Wt/V%) 0.7 1.0
Table 2: Diameters at the particle cumulated volume ratio of 90%, 50%, and 10%.
None HA-1 HA-2 HA-3 Pls-1 Pls-2 Pls-3
𝐷[V, 10] (𝜇m) 5.24 ± 0.43 6.82 ± 0.67 6.75 ± 0.35 7.75 ± 0.43 8.29 ± 0.81 6.90 ± 0.57 8.55 ± 0.82
Until now, emulsification is still the most common method for drug encapsulation [21, 22]. However, the hydrophilic ofloxacin always results in the low drug loading efficiency in hydrophobic polymeric drug carriers such as polylactide-glycoside and also faces high burst release [18, 19]. Approaches used to prevent the hydrophilic drugs partitioning to the external aqueous phase during emulsification and hardening procedure include presaturation of external phase with drug, altering the aqueous phase pH and using more water-miscible solvents [23–27]. But the efficiency of all these endeavors is still needed to be improved. Ofloxacin is positively charged drug at the pH value of body fluid. The negatively charged polyelectrolyte would embed ofloxacin in it. Migration of the macromolecular would be more difficult than the small drug molecular during the emulsification procedure. That is hypothesized to retain more ofloxacin in the final microsphere. This would be another alternative method to improve hydrophilic drug loading efficiency. In this paper, ofloxacin was loaded in PLGA microparticles through water-in-oil-in-water emulsification solvent evaporation technique. We were going to add the HA internal phase additives to increase the drug retaining in the microparticles. Positively charged Pls was added and none additive microspheres were also fabricated to compare the loading efficiency and to testify the hypothesis. The effects of physical adsorption and electrostatic interaction of the polyelectrolytes with the drug on final loading efficiency and release behavior would be discussed.
2. Materials and Methods 2.1. Materials. PLGA (50/50, Mn = 60000) with an intrinsic viscosity of 0.78 dL g−1 was purchased from Jinan Daigang Biomaterial Co. Ltd. Hyaluronic acid (HA) was purchased from Shanghai Qisheng Biological Preparation Co. Ltd. Polyl-lysine (Pls) was purchased from Sigma. Methyl cellulose (MC) was purchased from Sinopharm Chemical Reagent Co. Ltd. Dichloromethane (DCM) was purchased from Guangzhou Chemical Reagent Factory.
𝐷[V, 50] (𝜇m) 16.17 ± 1.21 17.28 ± 0.68 18.09 ± 0.59 19.47 ± 0.27 17.74 ± 0.33 16.78 ± 1.44 18.02 ± 2.42
𝐷[V, 90] (𝜇m) 45.18 ± 1.08 35.13 ± 3.16 39.57 ± 0.65 40.06 ± 0.09 47.29 ± 1.01 50.55 ± 0.38 49.46 ± 0.67
2.2. Preparation of Ofloxacin Loaded Microspheres. PLGA microspheres were prepared by a water-in-oil-in-water double emulsification solvent evaporation technique as the following steps. 500 𝜇L ofloxacin/PBS solution (10% w/v) was added into 5 mL PLGA/DCM (10%, w/v) solution and emulsified with the speed of 7200 rpm for 10 minutes using a high-speed stirrer (T10, IKA, German). Then, the primary emulsion was added into 20 mL MC solution (0.5%, w/v) and emulsified for another 10 minutes with the same speed. The emulsions were then transferred into 400 mL 35∘ C deionized water stirred for 4 h with the speed of 800 rpm and filtered to get the PLGA particles. Finally, The drug loading PLGA spheres were dried at 30∘ C for 24 hours. Table 1 displays the formulation of the control group and the HA and poly-llysine microspheres with different internal phase amounts added in the ofloxacin/PBS solution. 2.3. Material Characterization. The sphere size distribution was measured using a laser diffraction particle size analyzer (Mastersizer 2000, Malvern, UK). The sample was dispersed ultrasonically in deionized water with stirring speed of 2000 rpm, adding samples until an obscuration rate of 5–18% was obtained. Background and sample were measured for 12 s. Optical properties of the sample were defined as follows: refractive index 1.460 and absorption 0.00. Each sample was measured in triplicate. Span index was calculated according to span index =
𝐷 [V, 90] − 𝐷 [V, 10] . 𝐷 [V, 50]
(1)
𝐷[V, 90], 𝐷[V, 10], and 𝐷[V, 50] are the diameters at the particle accumulated volume ratio of 90%, 50%, and 10%, respectively (Table 2). The microsphere surface morphology was examined by an environmental SEM (quanta 200, FEI, American). The samples were observed by simply being mounted onto double-sided adhesive tape on the sample stage and with gold presputtering. The test was performed in the low vacuum model (60 Pa) at the acceleration voltage of 10 Kv.
BioMed Research International
3
2.4. Loading Efficiency Determination. The calibration curve was prepared at the maximum ofloxacin absorption peak of 293.8 nm before the experiment by using an ultravioletvisible spectrophotometer (Lambda950, Perkinelmer, USA). The equation regarding the calibration curve was 𝑦 = 13.21847 ∗ 𝑥 − 0.55224 with the 𝑅2 = 0.9997. In the equation, 𝑦 refers to the absorbance data read from the spectrophotometer and 𝑥 is the concentration of the prepared ofloxacin solution. Ofloxacin loading efficiency of PLGA microsphere was measured as the following steps. 0.05 g sphere samples were dissolved into 5 mL DCM. 10 mL deionized water was added into the solution to extract the ofloxacin. Then the aqueous solution with the extracted drug was measured at the 293.8 nm to determine the loading amount according to the calibration curve. Drug incorporation efficiency was expressed as in (2). The individual values for three replicate determinations and their mean values were reported:
20 Average particle size (𝜇m)
0.5% (Wt/V) sample solution was filled in the testing cell and measured by a potential meter (Malvern Nano ZS) at the temperature of 25∘ C under the applied voltage of 80 V. Each sample was measured for three times to get the mean value of zeta potential.
15
10
5 None
HA Internal additives
Pls
1 2 3
Figure 1: Average particle sizes of ofloxacin-loaded PLGA microspheres with varying amounts of internal additives.
Loading Efficiency (%) mass of drug in particles × 100. mass of drug used in formulation
2
(2)
2.5. Drug Release Study. 50 mg PLGA microsphere was suspended in 6 mL PBS solution. The microsphere suspensions were generally bathed in water at 37∘ C. At predetermined time intervals, samples were centrifuged at 2000 rpm for 5 min. 5 mL supernatant was taken for analyzing ofloxacin concentration. After this, 5 mL PBS was added in microsphere suspensions. All samples were taken in triplicate. 2.6. Particle Size and Distribution of PLGA Microsphere. Figure 1 displays the average particle size of the drug loaded PLGA microspheres without and with different varying amounts of internal polyelectrolytes. The mean particle sizes of different groups are in the range of 17 𝜇m∼20 𝜇m. No big difference is noted among all of them, except the HA groups. The polyelectrolytes added in the internal aqueous phase would increase the aqueous phase osmatic pressure/viscosity and result in difficult aqueous dispersion and larger partial size. As that reported in the paper, the particle size depends largely on processing condition, including mixing shear force, solution mixing ratio, temperature, surfactant amount, and osmatic pressure [20]. In this paper, aqueous solution osmatic pressure of HA groups has increased, since the HA concentration in the aqueous solution resulted in relatively high osmatic pressure. It was also noticed that the solution viscosity of HA groups increased during the experiment. Figure 2 displays the particles span index. It reflects the particle size polydispersion according to (1). The particle distribution is affected by the internal phase additives. The span index of HA internal phase group is smaller than the control
Span index
=
0 None
HA Internal additives
Pls
1 2 3
Figure 2: Span index of ofloxacin-loaded PLGA microsphere with varying amount of internal additives.
group since the HA solved inside the aqueous solution increased the viscosity and osmatic pressure. It suggested that the higher the internal phase viscosity, the more difficult for the emulsification procedure to get a wide-range microparticles. Since the viscosity of polylysine aqueous solution is not as high as HA aqueous solution, so the impact of polylysine on the particle span index is not as high as that of HA. 2.7. Morphological Examination. Figure 3 displays the surface morphology of the microparticles produced by this double emulsion and evaporation method. The surface of PLGA microsphere is smooth and without visible pores when
4
BioMed Research International
(a)
(b)
Figure 3: Surface morphology of ofloxacin-loaded microsphere ((a): none, HA-1, HA-2, and HA-3, (b): Pls-1, Pls-2, and Pls-3).
(a)
(b)
(c)
Figure 4: Sketch of the main type of internal morphology for microparticles.
observed by the environment SEM without gold presputtering (Figure 3(a): none). But after vacuum gold sputter coating, collapsed and wrinkled surface morphology could be observed as those displayed in Figure 3. This could be resulted by the microsphere internal cavities. The internal structure varied from dense solid to empty cavity, multivesicular structure, and matrix like structure depending on the primary emulsion stability [28, 29], as that displayed in Figure 4. With those internal cavities, when the vacuum chamber ventilated after gold coating, the interior and exterior pressure imbalance of the microparticles would cause the surface collapsing. The microcavities would provide more spaces for hydrophilic drug loading. But the uncontrollable internal structure would also result in uneven loading efficiency in different batches. 2.8. Loading Efficiency. Figure 5 displays the encapsulation efficiency when HA and polylysine are added in the inner
aqueous phase. Ofloxacin loading efficiency in HA internal phase group is higher than the control group and increased with its amounts inside, from 33% to 51%. This could be the reason of the interaction between the HA macromolecular and the drug. The zeta potential of the HA, polylysine, and the drug is 24 mV, 2.5 mV, and −14 mV, respectively, measured by a Malvern Nano sizer-potential meter. HA is an acidic mucopolysaccharide. Negatively charged carboxyl groups on the HA would facilitate it to combine positively charged drugs on it through the electrostatic attraction. The entanglement of the HA molecular increases the internal phase viscosity and prevents the emigration of HA to the external aqueous solution during emulsification procedure. This helps to retain more drugs inside the internal phase. When polylysine was added into the internal aqueous phase, the loading efficiency decreased dramatically as that in Figure 5. When the polylysine amount increased to 1%,
BioMed Research International
5
25 Burst release (%)
40 30 20
20 15 10 5
10
None
HA Internal additives
0 HA Internal additives
Pls
1 2 3
Figure 5: Loading efficiency of PLGA microsphere with varying amount of internal additives.
ofloxacin encapsulation was decreased to 6.84% in PLGA microsphere. Besides the repulsion between the positively charged drug and the positively charged polylysine, the emulsification efficiency decreasing of the anionic surfactant MC in Pls groups could be another reason for this. The emulsification efficiency is directly related to the macroscopical phase separation time. The macroscopical phase separation time is the time of an emulsion which becomes two phases when this could be observed by naked eye. This describes the stability of the primary emulsion. The average times of the initial macroscopic phase separation for none, HA, and Pls internal phase microsphere were 32 minutes, 67 minutes, and 12 minutes, respectively. The unstable primary emulsion of Pls group results in easier demulsification in the final microparticle formation procedure and lower drug loading efficiency. Furthermore, the electrostatic repulsion between polylysine and ofloxacin will speed the drug migration into the external aqueous solution following the demulsification. 2.9. In Vitro Release Study. Figure 6 presents the burst release of day 1. All groups with polyelectrolytes additives have the higher burst release than the control group. The burst release is mainly caused by the drug adhesive on the surface. During the microsphere fabrication procedure, the drug distributed in the external aqueous solution would be adsorbed onto the formed microspheres’ surface. Furthermore, since the HA and polylysine were added in the formulation, the embedded polyelectrolytes in the microspheres would increase the surface hydrophilicity. This would result in more drug surface adsorbed on the particle. Surface drug adsorption depends on the drug concentration in exterior aqueous solution. As we know from Figure 5, the lowest loading efficiency, the highest drug concentration in exterior aqueous solution. More drugs would be probably adsorbed on the microsphere surface. The drug adsorption
1 2 3
Figure 6: Burst release of PLGA microsphere with varying amount of internal additives at the first day.
Accumulated release (%)
None
Pls
20 10 0
3 2 1 0 0
10 None HA-1
20 Time (days)
30
Drug concentration (𝜇g/g sphere· mL PBS)
Loading efficiency
50
HA-2 HA-3
Figure 7: Release profile of ofloxacin/HA/PLGA microparticles.
and desorption are also influenced by the charged polyelectrolytes embedded in the microspheres. Negatively charged HA would facilitate the adsorption and hindering the desorption. So, the higher HA inside the microsphere, the lower exterior drug concentration and the least burst release observed. In contrast, positively charged Pls would speed the desorption of the adsorbed drug. High burst release of the Pls groups was observed in the experiment. Figure 7 displays the released profiles of the microparticle with different HA amounts in the internal phase for 35 days. With deduction of the burst release, the ofloxacin cumulated releases for 34 days were 15.2% of HA-1, 11.4% of HA-2, and 7.1% of HA-3, respectively. The cumulated release of the none additive microsphere was 23.1% at that time. The release speed of all the HA internal phase microspheres was slower than none additive microsphere. It was also noticed that the release speed decreased with the increase of HA amounts added into the internal phase.
3. Discussion Biodegradable polylactide and polylactide-co-glycolide polymers have been widely and intensively investigated for the control release of many drugs. However, the low entrapment efficiency of hydrophilic drug by these hydrophobic polymers is still a big problem since those drugs in general have very low affinity to them. Those would result in the drugs moving from the particles to the outer aqueous phase when they were produced by emulsion methods. Several works had been done in improving this hydrophilic drug’s loading efficiency in PLGA microsphere, such as altering the emulsion stabilizer, and changing emulsification time, changing the dilution volume between aqueous and
60 40 20 0
3 2 1 0 0
10 None Pls-1
20 Time (days)
30
Drug concentration (𝜇g/g sphere· mL PBS)
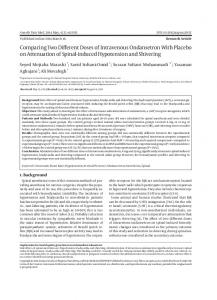
Though the HA entrapped in the PLGA membrane material would improve particles’ hydrophilicity and speed up PLGA degradation, a slower releasing is observed from Figure 7. That could be caused by the electrostatic attraction between the negative HA and the positive drugs. Furthermore, the slow migration of the HA from the PLGA entrapment is also retarding drug’s diffusion from the capsules. The releasing speed could be controlled to be very slow as the HA contents increased to 0.7% in the internal phase by this method. The minimum inhibitory concentration (MIC) of ofloxacin against the typical tuberculosis bacterium of mycobacterium is 1.0-2.0 𝜇g/mL [30]. Figure 7 displays that the drug concentration in the solution is about 1.0 𝜇g/g microsphere⋅mL. The drug concentration in the solution depends on two factors, the release rate and drug loading amounts in the microspheres. Though the release rate of the HA-3 internal phase group is slow, the loading amount is high; this group can still maintain the proper drug concentration in the solution. When the microsphere is added in the tissue engineering scaffold or used directly as a microsphere scaffold, the total weight of the microsphere should be properly adjusted regarding the size of the implanting cavity. Figure 8 presents the release pattern of the microparticles with different polylysine amounts in inner phase for 35 days. With deduction of the first-day burst release, the ofloxacin cumulated releases for 34 days are 30.1% of polylysine-1, 39.6% of polylysine-2, and 58.1% of polylysine-3, respectively. The release pattern is different as that of HA internal phase microsphere. The release speed of all polylysine internal phase microsphere is faster than none additive microsphere and the release speed increased with the increase of HA amounts added into the internal phase. The polylysine entrapped in the PLGA membrane material would improve particles’ hydrophilicity and speed up PLGA degradation. In addition to that, the electrostatic repulsion between the positively charged polylysine and the positive drugs would benefit the drug diffusion to the external solution. Figure 8 displays that the drug concentration in the solution is about 1.0 𝜇g/g microsphere⋅mL. The concentration falls in the MIC range. The cumulated releasing is high in this group. The total sustain releasing time is shorter than the HA internal phase microspheres.
BioMed Research International Accumulated release (%)
6
Pls-2 Pls-3
Figure 8: Release profile of ofloxacin/polylysine/PLGA microparticles.
organic phase [29, 31, 32]. The most efficient method to solve this problem is to increase PLGA concentration in DCM solution. But the preparation process was hard to control since that the higher PLGA concentration in the solution would result the higher solution viscosity. And at the same time, many visible pores in the microsphere surface result in as high as 45% burst release [29]. In the future, multipurpose sustained release scaffold implanted into the cavity after surgical bone infection foci debridement should be a promising expectation for bone tuberculosis therapy. This complicated multipurpose carrier system might probably involve hydrophilic, hydrophobic, positively and negatively charged drugs, and bioactive factors. Their sustained and/or procedure releasing would be a big challenge. In this paper, we presented the possibility that the loading efficiency and release profile could be adjusted by changing the internal phase. This provides alternatives for future sustained hydrophilic drug and protein control release besides previous methods. The method described in the paper also makes it easier for us to tailor the drug releasing profile together with the other methods to gain the best therapy effect.
4. Conclusions We have demonstrated effects of internal phase polyelectrolytes on the encapsulation efficiency, initial burst, and release profile of the hydrophilic drug ofloxacin. Promoting hydrophilic drug loading efficiency was dominated by adsorption and electrostatic attraction between the internal phase additives and the drug. Release profile and initial burst release were a balance between the wall materials’ degradation and the interactions between the internal phase additives and the drug. As for the bone tuberculosis therapy, the 0.7% HA internal phase presented the lowest initial releasing,
BioMed Research International longest releasing time, and relatively high loading efficiency. That could be a promising regiment for that disease therapy. The results of this research also revealed the importance of the internal phase controlling of the microparticles. When combining the controlling wall material’s degradation with this method, that will be easier to fabricate a multipurpose in situ drug releasing scaffold for clinic application in the future.
7
[11]
[12]
Conflict of Interests The authors declare that there is no conflict of interests regarding the publication of this paper.
[13]
Acknowledgments [14]
The authors acknowledge the financial support by Basic Research Project of China (2012CB619105, 2011CB606204), NSFC project (51173053), National High Technology Research and Development Program of China (2011AA030105), and Guangzhou science and technology program (2012J4100124).
[15]
References [1] I. Grosskopf, A. B. David, G. Charach, I. Hochman, and S. Pitlik, “Bone and joint tuberculosis—a 10-year review,” Israel Journal of Medical Sciences, vol. 30, no. 4, pp. 278–283, 1994. [2] M. Martini and M. Ouahes, “Bone and joint tuberculosis: a review of 652 cases,” Orthopedics, vol. 11, no. 6, pp. 861–866, 1988. [3] P. C. Jutte and J. H. Van Loenhout-Rooyackers, “Routine surgery in addition to chemotherapy for treating spinal tuberculosis,” Cochrane Database of Systematic Reviews, no. 1, Article ID CD004532, 2006. [4] E. E. Vogelpoel, J. J. Been, and A. A. de Gast, “Two-stage treatment of acetabular bone defect in tuberculosis of the hip by intended ankylosis followed by total hip arthroplasty: a case report,” Cases Journal, vol. 2, article 6532, 2009. [5] S. Ramachandran, I. J. Clifton, T. A. Collyns, J. P. Watson, and S. B. Pearson, “The treatment of spinal tuberculosis: a retrospective study,” International Journal of Tuberculosis and Lung Disease, vol. 9, no. 5, pp. 541–544, 2005. [6] W. Wu, Q. Zheng, X. Guo, and W. Huang, “The controlledreleasing drug implant based on the three dimensional printing technology: fabrication and properties of,” Journal Wuhan University of Technology, Materials Science Edition, vol. 24, no. 6, pp. 977–981, 2009. [7] W. Wu, Q. Zheng, X. Guo, J. Sun, and Y. Liu, “A programmed release multi-drug implant fabricated by three-dimensional printing technology for bone tuberculosis therapy,” Biomedical Materials, vol. 4, no. 6, Article ID 065005, 2009. [8] D. H. R. Kempen, L. Lu, A. Heijink et al., “Effect of local sequential VEGF and BMP-2 delivery on ectopic and orthotopic bone regeneration,” Biomaterials, vol. 30, no. 14, pp. 2816–2825, 2009. [9] T. N. Vo, F. K. Kasper, and A. G. Mikos, “Strategies for controlled delivery of growth factors and cells for bone regeneration,” Advanced Drug Delivery Reviews, vol. 64, no. 12, pp. 1292–1309, 2012. [10] X. Wang, E. Wenk, X. Zhang, L. Meinel, G. Vunjak-Novakovic, and D. L. Kaplan, “Growth factor gradients via microsphere
[16] [17]
[18]
[19]
[20]
[21]
[22]
[23]
[24]
delivery in biopolymer scaffolds for osteochondral tissue engineering,” Journal of Controlled Release, vol. 134, no. 2, pp. 81–90, 2009. M. Lee, W. Li, R. K. Siu et al., “Biomimetic apatite-coated alginate/chitosan microparticles as osteogenic protein carriers,” Biomaterials, vol. 30, no. 30, pp. 6094–6101, 2009. J. Zhao, M. Shinkai, T. Takezawa, S. Ohba, U. I. Chung, and T. Nagamune, “Bone regeneration using collagen type I vitrigel with bone morphogenetic protein-2,” Journal of Bioscience and Bioengineering, vol. 107, no. 3, pp. 318–323, 2009. S. S. Kim, S. J. Gwak, and B. S. Kim, “Orthotopic bone formation by implantation of apatite-coated poly(lactide-coglycolide)/hydroxyapatite composite particulates and bone morphogenetic protein-2,” Journal of Biomedical Materials Research A, vol. 87, no. 1, pp. 245–253, 2008. G. B. Migliori, R. Centis, C. Lange, M. D. Richardson, and G. Sotgiu, “Emerging epidemic of drug-resistant tuberculosis in Europe, Russia, China, South America and Asia: current status and global perspectives,” Current Opinion in Pulmonary Medicine, vol. 16, no. 3, pp. 171–179, 2010. C. K¨odm¨on, V. Hollo, E. Huitric, A. Amato-Gauci, and D. Manissero, “Multidrug- and extensively drug-resistant tuberculosis: a persistent problem in the European union European union and European economic area,” Euro Surveillance, vol. 15, no. 11, article 2, 2010. S. E. Berning, “The role of fluoroquinolones in tuberculosis today,” Drugs, vol. 61, no. 1, pp. 9–18, 2001. S. Saigal, S. R. Agarwal, H. P. Nandeesh, and S. K. Sarin, “Safety of an ofloxacin-based antitubercular regimen for the treatment of tuberculosis in patients with underlying chronic liver disease: a preliminary report,” Journal of Gastroenterology and Hepatology, vol. 16, no. 9, pp. 1028–1032, 2001. S. M. Hwang, D. D. Kim, S. J. Chung, and C. K. Shim, “Delivery of ofloxacin to the lung and alveolar macrophages via hyaluronan microspheres for the treatment of tuberculosis,” Journal of Controlled Release, vol. 129, no. 2, pp. 100–106, 2008. S. Harsha, R. Chandramouli, and S. Rani, “Ofloxacin targeting to lungs by way of microspheres,” International Journal of Pharmaceutics, vol. 380, no. 1-2, pp. 127–132, 2009. M. Nasr, G. A. S. Awad, S. Mansour, I. Taha, A. A. Shamy, and N. D. Mortada, “Different modalities of NaCl osmogen in biodegradable microspheres for bone deposition of risedronate sodium by alveolar targeting,” European Journal of Pharmaceutics and Biopharmaceutics, vol. 79, no. 3, pp. 601–611, 2011. M. J. Heslinga, E. M. Mastria, and O. Eniola-Adefeso, “Fabrication of biodegradable spheroidal microparticles for drug delivery applications,” Journal of Controlled Release, vol. 138, no. 3, pp. 235–242, 2009. V. Tran, J. Benoˆıt, and M. Venier-Julienne, “Why and how to prepare biodegradable, monodispersed, polymeric microparticles in the field of pharmacy?” International Journal of Pharmaceutics, vol. 407, no. 1-2, pp. 1–11, 2011. M. Barzegar-Jalali, M. Alaei-Beirami, Y. Javadzadeh et al., “Comparison of physicochemical characteristics and drug release of diclofenac sodium-eudragit RS100 nanoparticles and solid dispersions,” Powder Technology, vol. 219, pp. 211–216, 2012. X. Song, Y. Zhao, W. Wu et al., “PLGA nanoparticles simultaneously loaded with vincristine sulfate and verapamil hydrochloride: systematic study of particle size and drug entrapment efficiency,” International Journal of Pharmaceutics, vol. 350, no. 1-2, pp. 320–329, 2008.
8 [25] L. Peltonen, J. Aitta, S. Hyv¨onen, M. Karjalainen, and J. Hirvonen, “Improved entrapment efficiency of hydrophilic drug substance during nanoprecipitation of poly(l)lactide nanoparticles,” AAPS PharmSciTech, vol. 5, no. 1, article E16, 2004. [26] W. S. Cheow and K. Hadinoto, “Enhancing encapsulation efficiency of highly water-soluble antibiotic in poly(lactic-coglycolic acid) nanoparticles: modifications of standard nanoparticle preparation methods,” Colloids and Surfaces A, vol. 370, no. 1-3, pp. 79–86, 2010. [27] M. Ayoub, N. Ahmed, N. Kalaji et al., “Study of the effect of formulation parameters/variables to control the nanoencapsulation of hydrophilic drug via double emulsion technique,” Journal of Biomedical Nanotechnology, vol. 7, no. 2, pp. 255–262, 2011. [28] S. Mao, Y. Shi, L. Li, J. Xu, A. Schaper, and T. Kissel, “Effects of process and formulation parameters on characteristics and internal morphology of poly(d,l-lactide-co-glycolide) microspheres formed by the solvent evaporation method,” European Journal of Pharmaceutics and Biopharmaceutics, vol. 68, no. 2, pp. 214–223, 2008. [29] Z. Wang, “Effects of the process parameters on the initial burst release of poly(lactide-co-glycolide) microspheres containing bovine serum albumin by the double-emulsion solvent evaporation/extraction method,” Journal of Applied Polymer Science, vol. 115, no. 5, pp. 2599–2608, 2010. [30] A. S. Ginsburg, J. H. Grosset, and W. R. Bishai, “Fluoroquinolones, tuberculosis, and resistance,” The Lancet Infectious Diseases, vol. 3, no. 7, pp. 432–442, 2003. [31] Y. Y. Yang, T. S. Chung, X. L. Bai, and W. K. Chan, “Effect of preparation conditions on morphology and release profiles of biodegradable polymeric microspheres containing protein fabricated by double-emulsion method,” Chemical Engineering Science, vol. 55, no. 12, pp. 2223–2236, 2000. [32] N. Nihant, C. Schugens, C. Grandfils, R. Jerome, and P. Teyssie, “Polylactide microparticles prepared by double emulsion/evaporation technique. I. Effect of primary emulsion stability,” Pharmaceutical Research, vol. 11, no. 10, pp. 1479–1484, 1994.
BioMed Research International