Comparing Move Choices of Chess Search Engines
COMPARING MOVE CHOICES OF CHESS SEARCH ENGINES Mark Levene1 and Judit Bar-Ilan2 London, U.K. and Jerusalem, Israel
ABSTRACT Anecdotal evidence exists that in many positions two distinct chess engines will choose different moves and, moreover, that their top-n ranking of move choices also differ. Here we set out to quantify this difference, including the difference between move choices by chess engines and those made by humans. For our analysis we used F RITZ 8 and J UNIOR 9 as representative chess search engines and the P OWERBOOK opening book as representing human choices. We collected the top-5 ranked moves and their scores as reported by F RITZ and J UNIOR, after 15 and 30 minutes of thinking time, and the top-5 moves recorded in the P OWERBOOK, for the Nunn2 test positions and the initial board position. The data analysis was carried out using several nonparametric measures, including the amount of overlap in the top-5 choices of the engines and their association as measured by three variants of Spearman’s footrule. Our preliminary results show that, overall, the engines differ substantially in their choice of moves, and, furthermore, the engines’ choices also differ substantially from human choice. 1. INTRODUCTION Computer chess has been an active area of research since Shannon’s (1950) seminal paper, where he suggested the basic minimax search strategies and heuristics, which have been refined and improved over the years. The many advances since then in improving the search-engine algorithms, representing and learning chess knowledge, using large opening and endgame databases, and the exploitation of computer hardware including parallel processing and special-purpose hardware (Marsland and Bj¨ornsson, 2000), have resulted in the development of computer-chess programs, some of which are of top-Grandmaster-level strength. The ultimate test for a chess-playing program is to play a match against the World Champion or one of the leading Grandmasters. In May 1997 an historic match was played between between IBM’s D EEP B LUE chess computer and Garry Kasparov, then World Champion, resulting in a spectacular win for the machine, 3.5 – 2.5. (See www.chess.ibm.com for the archived web site of this historic match.) Although the computer won the match there has been an ongoing debate since then on whether the highest ranking computer-chess programs are at the world-championship level. In any case, most agree that it is inevitable that eventually chess machines will dominate. Using special-purpose hardware and parallelization D EEP B LUE (Hsu, 2002) was capable of analysing up to 200 million positions per second, while the only other chess program to-date, known to run at a comparable speed, is H YDRA (Donninger and Lorenz, 2005) currently also capable of analysing up to 200 million positions per second. The H YDRA team, whose lead developers are Chrilly Donninger and Ulf Lorenz, consider their program to be successor of D EEP B LUE and their goal is to create the strongest chess-playing computer having the ability to defeat the human world chess champion. 1 School of Computer Science and Information Systems,Birkbeck College, University of London, London WC1E 7HX, U.K. Email:
[email protected]. 2 Bar-Ilan University and The Hebrew University of Jerusalem, Israel. Email:
[email protected].
67
68
ICGA Journal
June 2005
Two of the strongest available chess engines are F RITZ 8 and J UNIOR 9, both marketed by ChessBase (www.chessbase.com) and running under a common user interface. F RITZ 8 has been developed by Frans Morsch and Mathias Feist, and its Elo rating as published in late 2004 on the Swedish computer-chess rating list was 2752, putting it in 8th place on the list (Karlsson, 2004). D EEP F RITZ, is a multiprocessor version of F RITZ, which is capable of analysing several million positions per second. In October 2002 it played a match against Kramnik, then World Champion, achieving a 4–4 draw (M¨uller, 2002), and in November 2003 it played a match against Kasparov achieving a 2–2 draw (Levy, 2003). J UNIOR 9 has been developed by Amir Ban and Shay Bushinsky, and its Elo rating as published in late 2004 on the Swedish computer-chess rating list was 2796, putting it in 3rd place on the list (Karlsson, 2004). D EEP J UNIOR is a multiprocessor version of J UNIOR, which is capable of analysing several million positions per second. In January-February 2003 it played a match against Kasparov achieving a 3–3 draw (Ross, 2003). Presumably F RITZ and J UNIOR both use state-of-the-art minimax search with extensions and evaluation heuristics to guide the search and make it as efficient as possible (Marsland and Bj¨ornsson, 2000). As these products are commercial their algorithmic details are kept as trade secrets. There are also several strong non-commercial chess programs, the most notable being C RAFTY (www. cis.uab.edu/info/faculty/hyatt/craftydoc.html), which has been developed by Robert Hyatt. Its Elo rating as published in late 2004 on the Swedish computer-chess rating list was 2617, putting it in 34th place on the list (Karlsson, 2004). Being open source, C RAFTY has allowed researchers to experiment with new ideas by modifying its code. The encoded game features and their weights will vary from program to program and will have a substantial impact on their chess-playing style. The styles of F RITZ and J UNIOR could not be more distinct, although being computers they both possess tremendous tactical insight. While F RITZ is considered to be a solid and dynamic positional player, J UNIOR is known to be aggressive and even speculative. Although Grandmaster chess programs excel in executing combinations spanning over a long series of moves, J UNIOR will take more risks than others. An example of J UNIOR’s style is the astonishing bishop sacrifice on h2 that it played on move 10 in the fifth game of the match against Kasparov in 2003. Due to their different styles it is inevitable that F RITZ and J UNIOR will not play all positions in the same way. This is despite similar computational abilities and, in a broad sense, both using similar state of the art evaluation and search algorithms. There is anecdotal evidence that F RITZ and J UNIOR will rank their move choices from a given position differently, but how different are they in reality? Herein we set out to provide a methodology for comparing the move choices by chess engines. There are three dimensions in which the choice of move may be compared. The first is a comparison of the ranks that the engines attach to the move choices, and the second is a comparison of the move scores output by the engines’ evaluation functions. Scores are more informative than ranks as they quantify how “good” (or “bad”) the current position is from the point of view of the player to move. Moreover, scores allow us to quantify how much “better” (or “worse”) one move is from another. The third involves the comparison of the principal variations leading the engines to choose one move above another. Herein we are only concerned with the decisions made by the chess engines rather than the process by which the decisions were made, so we only considered the first two dimensions of comparison. The third dimension was addressed in (Alth¨ofer, 1997), where a measure of similarity between principal variations was considered. The methodology we have chosen to use is based on our previous work in the area of comparing the rankings of web search engines (Bar-Ilan, Mat-Hassan, and Levene, 2005). As strong chess programs are being regularly used by human chess players for game analysis and tournament preparation (Smith, 2004), the comparison of chess engines could have an impact on the engines one would choose when using computers as assistants or for training purposes. (The use of computers to check analysis is very common in chess correspondence games.) For the purpose of data analysis we used the Nunn2 test devised by Grandmaster Dr. John Nunn to test chess engines’ strength on a variety of late opening/early middle-game positions. The Nunn2 test was
Comparing Move Choices of Chess Search Engines
chosen, since its 25 positions arise form a variety of openings with different characteristics, and for all these positions there are several candidate moves. We augmented the Nunn2 test with the initial position, as we were interested to find out what first moves do F RITZ and J UNIOR prefer. Each position was run for 15 and 30 minutes on both F RITZ and J UNIOR, using the k-best mode feature (Alth¨ofer et al., 2003), where the k-best moves are computed and ranked; in our experiments we used k=5. As these positions were not yet out of the opening stage, we were also able to obtain the move choices made by strong human players using the P OWERBOOK 2005 opening book marketed by ChessBase, which contains 20 million opening positions derived from over a million high-class tournament games. It is worth mentioning the older analysis presented in (Yazgac, 1989) involving 14 different chess computers and about 500 different positions from World Champion games, which compared the candidate moves of the different engines at 3 minutes thinking time. As this comparison is over 15 years old and, moreover, tested only the candidate moves (i.e., the 1-best moves) we believe that the our present analysis is justified. In addition, the measures we have used for the comparison of the chess engines are novel in this context, and may be extended in further work. Our analysis was carried out using the same nonparametric measures we have previously used in comparing rankings of search engines (Bar-Ilan et al., 2005). The first three measures are the number of overlapping move choices, whether the top-move choice overlaps, and the number of overlapping move choices in the top-2 ranked moves. The other three measures are normalised variants of Spearman’s footrule nonparametric measure of association (Diaconis and Graham, 1977), we call F, G, and M. The F measure looks at the overlapping moves, ranks them in relative order and then applies the standard Spearman footrule to the pairs of ranks. The G measure considers two ranked lists, where some of the items in the first (second) list may not be present in the second (first). The modification, suggested by Fagin, Kumar, and Sivakumar (2003) assigns these items rank k+1, where the lists of each engine is of length k. The G measure puts much emphasis on the size of the overlap, which is the reason we have proposed the M measure, giving higher weight to move differences at higher ranks (Bar-Ilan et al., 2005). We also measured the engines’ score differences between the top-2 ranked moves and the top and bottom moves. The results confirm that, overall, the engines differ in their choice of moves. Although the overlap in the top-5 move choices is about 3 on average, the top-1 overlap is close to 0 and the top-2 overlap is close to 1. The F, G, and M measures show that F RITZ and J UNIOR rank moves in a different order, and when there is agreement, it is not necessarily in the top-3 move choices. There is higher agreement between F RITZ’s ranking and that of humans than there is between J UNIOR’s and humans’ rankings. Both F RITZ’s and J UNIOR’s rankings are stable over time, on average, although there are still fluctuations in the rankings. Furthermore, F RITZ’s score difference between moves is slightly higher than J UNIOR’s, possibly indicating that F RITZ is ‘more confident’ in its ranking than J UNIOR is. Finally, the average scores of moves per rank are similar and decreasing with rank, and they indicate a small advantage for White in the positions tested. The rest of the paper is organised as follows. In Section 2 we describe the nonparametric measures we used to compare the rankings of the two chess engines. In Section 3 we give the detail of the data collection phase. In Section 4 we present the data analysis carried out and interpret the results. Finally, in Section 5 we give our concluding remarks. 2. THE MEASURES We used several measures to test the correspondence between the chess engine’s ranking of the top-5 moves. The simplest measure is the number of overlapping move choices between the two top-5 lists (overlap). We also considered whether there is an overlap in the top choice of move (top-1) and the size of the overlap in the top-2 move choices (top-2). To illustrate the F, G, and M nonparametric association measures, consider the initial position and the moves chosen by F RITZ and J UNIOR after 15 minutes thinking time. The overlap between the rankings in this case was 4, the moves being, d4, Nf3, e3, and Nc3. The move e4 appeared in F RITZ’s top-5 but
69
70
ICGA Journal
June 2005
not in J UNIOR’s, and the move c4 appeared in J UNIOR’s top-5 but not in F RITZ’s. All moves that do not appear in the overlapping set of moves are assigned rank 6. Table 1 gives the detailed ranks, so for example e4 was assigned rank 1 by F RITZ but did not appear in the top-5 in J UNIOR’s ranking (and therefore its assigned rank is 6), d4 was ranked 2 by F RITZ and 1 by J UNIOR, and Nf3 was assigned the same rank by both engines. Spearman’s Footrule (F) only considers the overlapping moves, i.e., in this case, d4, Nf3, e3 and Nc3 and assigns them their relative rank according to the original ordering as shown in Table 2. Fagin’s modified Spearman’s footrule (G) takes into account all the moves considered by the two engines as shown in Table 1. The modified weighted counterpart (M) takes into account all the moves considered by the two engines and assigns them their reciprocal rank, as shown in Table 3. Move e4 d4 Nf3 e3 Nc3 c4
F RITZ 1 2 3 4 5 6
J UNIOR 6 1 3 5 4 2
Table 1: Ranking example to illustrate measures.
Move d4 Nf3 e3 Nc3
F RITZ 1 2 3 4
J UNIOR 1 2 4 3
Table 2: Ranking for F.
Move e4 d4 Nf3 e3 Nc3 c4
F RITZ 1 1/2 1/3 1/4 1/5 1/6
J UNIOR 1/6 1 1/3 1/5 1/4 1/2
Table 3: Ranking for M.
Now, to compute the measures, we sum the absolute difference of the ranks (or the reciprocal ranks in case of the M measure) for each pair, normalise the result by dividing by the maximum value of the measure, and finally subtract the result from one to arrive at a similarity measure rather the a dissimilarity measure. More formally, the association measure, F, G, or M, is given by Pn (| rank1 (i) − rank2 (i) |) 1 − i=1 , M ax where n is the number of moves being compared, rank1 (i) is the F RITZ rank (or reciprocal rank for the M measure) for the ith move, rank2 (i) is the corresponding J UNIOR rank for this move, and M ax is the maximum value of the measure under consideration, i.e., F, G, or M. The reader can verify that for our illustrative example, F = 0.75, G = 0.6 and M = 0.3908. We note that the F measure is only sensitive to the order of the moves and does not take into account moves that are not in the overlapping set. Thus if we compare a given ranking of the top-5 moves to one obtained by reversing the order of moves we would have F = 0. In contrast, the G measure is sensitive, not only to the order, but to the amount of overlap. Thus, when considering the top-5 moves, if we compare a ranking and one in the reverse order we would arrive at G = 0.6. Finally, the M measure is sensitive to the order, the amount of overlap, and it gives higher weight to moves which overlap at a higher rank. Thus, when considering the top-5 moves, if we compare a ranking and one in the reverse order we would arrive at M = 0.2759. As we are able to obtain the scores that the engine assigns to the positions in pawn units, we also measure the absolute value of the difference in scores between the top-2 ranked moves and between the top and bottom ranked moves. Finally we compute the average score an engine assigns at a given rank to see how the scores change with the rank. 3. DATA COLLECTION The experiments were carried out on a laptop with a 1GHz Intel Pentium processor and 512MB of RAM, on a Windows XP platform. F RITZ 8 and J UNIOR 9 were run concurrently each with the default parameters and a hash table of 148MB. F RITZ was running in infinite analysis mode while J UNIOR was running as a
Comparing Move Choices of Chess Search Engines
71
Kibitzer, and each engine was set up to display its top-5 move choices. In such an environment both F RITZ and J UNIOR each analyse about a few hundred thousand positions per second. The 25 positions from the Nunn2 test collection were used for the experiments, augmented with the initial board configuration as position 26. Each position was run for 15 and 30 minutes respectively, and the top-5 move choices and their scores in pawn units were recorded for both F RITZ (f15 and f30) and J UNIOR (j15 and j30). (We note that in many rapidplay chess tournaments players have between 15 and 60 minutes each to complete the game, and in blitz tournaments they have less than 15 minutes each; for rated tournaments 120 minutes for 40 moves is standard.) In order to test the stability of the ranking, positions 8 (Sicilian Dragon Yugoslav attack) and 17 (Queen’s Gambit declined Tartakower variation), were run for 2.5 hours, with data collection taking place at 15 minute intervals. To compare the move choices made by the engines to those made by strong human players we used the P OWERBOOK 2005 (pb) opening book, which is a ChessBase product containing 20 million opening positions derived from over 1 million high-class tournament games over a lengthy period up until late 2004. For each position in the test set we recorded the most popular 5 move choices according to the P OWERBOOK, except for position 18 where only 4 moves are available and position 24 where only 3 moves are available. To illustrate the data collection, Table 4 shows the results for position 26 (the initial position). We observe that in this case F RITZ is slightly favouring White for the top-3 move while J UNIOR is relatively neutral. Moreover, it is notable that the most popular move, i.e., e4, was not present in J UNIOR’s top-5 after 30 minutes of thinking time. In fact, it was ranked at position 6, J UNIOR believing that the reply d5 (the Scandinavian defence) gives a slight advantage to Black. (At long last after 60 minutes thought J UNIOR elevated e4 into the top-5.) Experiment Rank 1 2 3 4 5
f15 Move Score e4 0.14 d4 0.09 Nf3 0.09 e3 0.08 Nc3 0.05
f30 Move Score e4 0.24 d4 0.10 Nf3 0.09 e3 0.05 Nc3 0.04
j15 Move Score d4 0.04 c4 0.00 Nf3 -0.01 Nc3 -0.06 e3 -0.07
j30 Move Score d4 0.01 Nf3 0.01 c4 0.01 e3 -0.05 c3 -0.06
pb Move e4 d4 Nf3 c4 g3
Table 4: Data for position 26.
4. DATA ANALYSIS We compared F RITZ and J UNIOR on the 15 and 30 minute data sets, and in addition we compared the engines to the P OWERBOOK, on all the measures described in Section 2. We also compared F RITZ and J UNIOR to themselves to see how the ranking changed between the data-collection points at 15 and 30 minutes. To illustrate the data analysis we show the individual result for position 26 (the initial position) in Table 5. These results are higher than the average of the results for the complete set of all positions, although the M measure between F RITZ and J UNIOR (top 2 rows) is comparable to the average indicating that, although the overlap is substantial (between 3 and 4) the order in the rankings differ. For positions 8 and 17 we compared the engines to themselves over the longer period of 2.5 hours, to see how the rankings changed between the data-collection points at 15 minute intervals. This was carried out to test whether the choice of moves was stable over a longer time period. Finally, for the F RITZ and J UNIOR data sets, we looked at the absolute value of the score differences, between the top-ranked move and the second-ranked and fifth-ranked moves, and at the average scores the engines assigned to moves at each rank. The motivation for this was to ascertain whether there was a significant difference, on average, in the score values that the engines assigned to moves.
72
ICGA Journal
Experiment f15-j15 f30-j30 f15-pb f30-pb j15-pb j30-pb f15-f30 j15-j30
Overlap 4 3 3 3 3 3 5 4
Top-1 0 0 1 1 0 0 1 1
June 2005
Top-2 1 1 2 2 1 1 2 2
F 0.75 1.00 1.00 1.00 0.50 1.00 1.00 0.75
G 0.6 0.6 0.8 0.8 0.6 0.6 1.0 0.8
M 0.3908 0.4023 0.9195 0.9195 0.4023 0.4023 1.0000 0.8276
Table 5: Summary of the results for position 26. In Table 6 we show the averages for all the measures we computed for each experiment, and in Table 7 we show the standard deviations for these experiments. The overlap is seen to be, on average, about 3 between engines (column 2, rows 1–6), including the P OWERBOOK, and over 4 between an engine and itself (column 2, rows 7–8). We observe that for the overlap measure the standard deviation is high indicating the high variability of this result. Between engines the top-1 overlap is closer to zero than to one and the top-2 overlap is close to one (columns 3–4, rows 1–6), while between an engine and itself the top-1 overlap is close to 1 and the top-2 overlap about 1.5 (columns 3–4, rows 7–8). We emphasise that the disagreement on the top move, implies that, when in playing mode, the engines will play different moves. Looking at the F, G, and M measure between engines, we see that the M measure is, in general, lower than the F and G measures (columns 5–7, rows 1–6). This indicates that the agreement is not necessarily in the top-3 moves, since otherwise the M measure would be higher. For all three measures F RITZ has a higher correspondence to the P OWERBOOK than J UNIOR, which may imply that F RITZ’s style is closer to that of humans’ than J UNIOR’s style. All three measures between an engine and itself are high, indicating a high correspondence between the two time points (columns 5–7, rows 7–8). As expected, for all the measures, the results are substantially higher when comparing an engine to itself (rows 7–8). We also note that the standard deviations are relatively high in rows 1–6, when comparing between engines, and less in rows 7–8, when comparing an engine to itself. This may be due to the correspondence between engines (including the P OWERBOOK) depending, to some degree, on the individual characteristics of a position. It would be interesting to try and cluster the positions according to the level of correspondence with respect to a given measure, but more test positions are needed to carry out such an analysis. Experiment f15-j15 f30-j30 f15-pb f30-pb j15-pb j30-pb f15-f30 j15-j30
Overlap 3.0769 3.0385 3.1538 3.1538 2.8846 3.0000 4.3846 4.3077
Top-1 0.2692 0.2308 0.2692 0.2692 0.1923 0.2692 0.8846 0.7692
Top-2 0.8462 0.8077 1.1154 1.1154 0.6923 0.7308 1.5385 1.4231
F 0.5910 0.5507 0.5833 0.5000 0.4062 0.4400 0.7981 0.7867
G 0.5205 0.5257 0.5923 0.5641 0.5026 0.5257 0.8487 0.7872
M 0.4049 0.3895 0.4898 0.4779 0.3811 0.4125 0.8448 0.7582
Table 6: Summary of the averages of the results. In Table 8 we show the averages for all the measures between an engine (F RITZ or J UNIOR) and itself that we computed for positions 8 and 17 over 2.5 hours, where the data was collected every 15 minutes. Correspondingly, in Table 9 we show the standard deviations for these experiments. The results indicate that the rankings are indeed relatively stable over time for this test set. Moreover, we observe from columns
Comparing Move Choices of Chess Search Engines
Experiment f15-j15 f30-j30 f15-pb f30-pb j15-pb j30-pb f15-f30 j15-j30
Overlap 0.9767 0.9992 1.0077 0.8806 0.9089 0.8485 0.6972 0.8840
Top-1 0.4523 0.4297 0.4523 0.4523 0.4019 0.4523 0.3258 0.4297
Top-2 0.6127 0.5670 0.7114 0.7656 0.4707 0.4523 0.5818 0.6433
F 0.3672 0.3515 0.3428 0.3873 0.3597 0.3629 0.2616 0.2382
G 0.1789 0.2007 0.2016 0.2168 0.1916 0.1647 0.1380 0.2066
73
M 0.2243 0.2079 0.2336 0.2411 0.2246 0.2071 0.1661 0.2646
Table 7: Summary of the standard deviations of the results. 5–7 in Table 8, comparing rows 1 and 2 for position 8 and rows 3 and 4 for position 17, that, on average, J UNIOR changes over time more than F RITZ. Experiment f-p8 j-p8 f-p17 j-p17
Overlap 4.6667 4.6667 4.7778 4.4444
Top-1 1.0000 0.7778 0.7778 0.6667
Top-2 1.8889 1.6667 2.0000 1.5556
F 0.9537 0.8704 0.8981 0.8333
G 0.9630 0.8889 0.9407 0.8667
M 0.9668 0.8429 0.8953 0.7965
Table 8: Summary of the averages for positions 8 and 17. Experiment f-p8 j-p8 f-p17 j-p17
Overlap 0.5000 0.5000 0.4410 0.5270
Top-1 0.0000 0.4410 0.4410 0.5000
Top-2 0.3333 0.7071 0.0000 0.7265
F 0.0942 0.2606 0.1303 0.2500
G 0.0484 0.1633 0.0619 0.1700
M 0.0540 0.2844 0.1562 0.2967
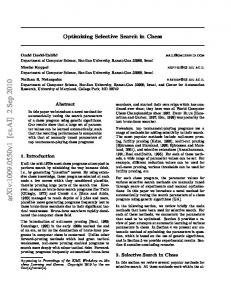
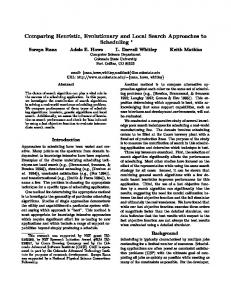
Table 9: Summary of the standard deviations for positions 8 and 17. In Figure 1 we show how the M measure changes over time when comparing an engine to itself. Despite relative stability of the rankings as time goes by, there are still fluctuations in the ranking. For example, note how the M measure for position 17 at time 120 dropped in F RITZ from 1 to 0.6552, and for position 8 at time 135 it dropped to a lesser extent in J UNIOR from 1 to 0.9425. In the first case for position 17, F RITZ swapped the moves at rank 1 and rank 2, while in the second case for position 8 J UNIOR elevated the move at rank 5 to rank 4 and introduced a new move at rank 5. In Figure 2 we show how the G and M measures change when comparing between F RITZ and J UNIOR over a time period of 2.5 hours, where the comparison, as before, is taken in 15 minutes intervals. We see that the measures are not necessarily increasing over time, so our choice of restricting most of the data collection to 15 and 30 minutes does not seem to impair the results. We observe from Table 10 that the score differences are slightly higher for F RITZ than for J UNIOR, which may indicate that F RITZ is ‘more confident’ in its ranking than J UNIOR is. The separation between the top2 ranked moves is less than 0.1 of a Pawn for F RITZ and about 0.05 for J UNIOR, which indicates that, on average, the top-2 moves are comparable in strength. Moreover, we observe from Table 11 that the average scores for both engines are similar and decreasing with rank, indicating, on average, a small advantage for White in the positions tested.
74
ICGA Journal
June 2005
1 0.9 0.8
M measure
0.7 0.6 0.5 f−p8 f−p17
0.4
j−p8 j−p17
0.3 0.2 30
45
60
75 90 105 Data analysis time point
120
135
150
Figure 1: Change in M measure for positions 8 and 17 for each engine. Score-diff Experiment f15 f30 j15 j30
| score(1) − score(2) | Avg Std 0.0827 0.0861 0.0738 0.0742 0.0538 0.0535 0.0465 0.0596
| score(1) − score(5) | Avg Std 0.2023 0.1122 0.2015 0.1019 0.1377 0.0887 0.1435 0.0896
Table 10: Summary of score differences. 5. CONCLUDING REMARKS We carried out a preliminary analysis comparing the move choices of two Grandmaster strength chess search engines, namely F RITZ 8 and J UNIOR 9, and those made by humans as recorded in the P OWERBOOK opening book. Our results provide evidence that distinct chess engines differ substantially in their choice of moves, and that chess engines choices also differ substantially from human choices. Our results also show the general stability of chess engine’s ranking of moves across two time points. We found that F RITZ’s score differences between the top-2 moves and the top and bottom moves are slightly higher than J UNIOR’s, possibly implying that F RITZ is ‘more confident’ in its ranking than J UNIOR is. Moreover, the choice of which move is best is a difficult one, since the difference between the top-2 moves is, on average, small. Finally, the average scores returned from the two engines are similar, indicating a small advantage for White in the positions tested. We note that by the results in Fagin et al. (2003) we would expect to obtain similar results when using Kendall’s tau instead of the measures we have chosen based on Spearman’s footrule.To substantiate the results of our preliminary analysis further experiments need to be carried out, with more frequent data-collection points, and possibly over longer time periods. It would be interesting to extend the analysis to some of the other strong chess engines such as S HREDDER , C HESS T IGER, and H IARCS.
Comparing Move Choices of Chess Search Engines
75
0.9 M−fj−p8 M−fj−p17 G−fj−p8 G−fj−p17
0.8
Measure
0.7
0.6
0.5
0.4
0.3
0.2 15
30
45
60 75 90 105 Data analysis time point
120
135
150
Figure 2: Change in G and M measures for positions 8 and 17 between engines. Rank Experiment f15 f30 j15 j30
rank1 Avg Std 0.237 0.238 0.215 0.228
0.198 0.180 0.205 0.200
rank2 Avg Std 0.220 0.219 0.209 0.217
0.181 0.177 0.244 0.249
rank3 Avg Std 0.188 0.191 0.195 0.210
0.194 0.184 0.274 0.274
rank4 Avg Std 0.176 0.178 0.189 0.204
0.195 0.201 0.300 0.307
rank5 Avg Std 0.170 0.163 0.177 0.195
0.217 0.218 0.317 0.329
Table 11: Summary of scores per rank. A related research question is whether in the last few years there is an increased similarity between the chess-playing style of strong human players and that of chess programs such as F RITZ and J UNIOR as a result of using these programs for analysis and training purposes. To answer this question longitudinal analysis must be carried out, which may necessitate extending the techniques described in this paper. 6. REFERENCES Alth¨ofer, I. (1997). On the k-best mode in computer chess: Measuring the similarity of move proposals. International Computer Games Association Journal (ICGA), Vol. 20, pp. 152–165. Alth¨ofer, I., Lieberum, J., de Koning, J., Meyer-Kahlen, S., Rolle, T., and Sameith, J. (2003). Five visualisations of the k-best mode. International Computer Games Association Journal (ICGA), Vol. 26, pp. 182–189. Bar-Ilan, J., Mat-Hassan, M., and Levene, M. (2005). Methods for comparing rankings of search engine results. Computing Research Repository (CoRR). http://arxiv.org/abs/cs.IR/0505039. To appear in Computer Networks.
76
ICGA Journal
June 2005
Diaconis, P. and Graham, R. (1977). Spearman’s footrule as a measure of disarray. Journal of the Royal Statistical Society, Series B (Methological), Vol. 39, pp. 262–268. Donninger, C. and Lorenz, U. (2005). The Hydra project. Xcell Journal, Issue 53, pp. 94–97. Fagin, R., Kumar, R., and Sivakumar, D. (2003). Comparing top k lists. SIAM Journal on Discrete Mathematics, Vol. 17, pp. 134–160. Hsu, F.-H. (2002). Behind Deep Blue: Building the Computer That Defeated the World Chess Champion. Princeton University Press, Princeton, NJ. Karlsson, T. (2004). The Swedish rating list. International Computer Games Association Journal (ICGA), Vol. 27, p. 261. Levy, D. (2003). Kasparov vs X3D Fritz. International Computer Games Association Journal (ICGA), Vol. 26, pp. 289–290. Marsland, T. A. and Bj¨ornsson, Y. (2000). From minimax to Manhattan. Games in AI Research (eds. H. J. van den Herik and H. Iida), pp. 5–17. Institute for Knowledge and Agent Technology IKAT, Universiteit Maastricht, Maastricht, The Netherlands. M¨uller, K. (2002). The classh ot the titans: Kramnik – Fritz Bahrain. International Computer Journal Association Journal, Vol. 25, pp. 233–238. Ross, P. (2003). Silicon shows its mettle. IEEE Spectrum, Vol. 40, pp. 24–26. Shannon, C. (1950). Programming a computer for playing Chess. Philosophical Magazine, Vol. 41, pp. 256–275. Smith, R. (2004). Modern Chess Analysis. Gambit Publications, London. Yazgac, N. (1989). Schachcomputer was sie wirklich k¨onnen. Beyer Verlag, Hollfeld.