minneapolis, minnesota, usa • 20-25 april 2002
Paper: Ubiquity
Comparing Paper and Tangible, Multimodal Tools David R. McGee
Philip R. Cohen, R. Matthews Wesson, and Sheilah Horman
Rich Interaction Environments Pacific Northwest National Laboratory M/S K7-28, 906 Battelle Boulevard Richland, WA 99352 USA
[email protected]
Center for Human-Computer Communication Oregon Health and Sciences University 20000 NW Walker Road Portland, OR 97006 USA {pcohen, wesson, shorman}@cse.ogi.edu
Abstract In command posts, officers maintain situational awareness using paper maps, Post-it notes, and hand-written annotations. They do so because paper is robust to failure, it is portable, it offers a flexible means of capturing information, it has ultra-high resolution, and it readily supports face-to-face collaboration. We report herein on an evaluation comparing maps and Post-its with a tangible multimodal system called Rasa. Rasa augments these paper tools with sensors, enabling it to recognize the multimodal language (both written and spoken) that naturally occurs on them. In this study, we found that not only do users prefer Rasa to paper alone, they find it as easy or easier to use than paper tools. Moreover, Rasa introduces no discernible overhead in its operation other than error repair, yet grants the benefits inherent in digital systems. Finally, subjects confirmed that by combining physical and computational tools, Rasa is resistant to computational failure. Keywords Augmented reality, invisible interfaces, mixed reality, multimodal interfaces, and tangible interfaces. INTRODUCTION Although information systems provide demonstrable advantages over paper, the disadvantages associated with technology often deter professionals from relying on such systems for time-critical, collaborative tasks. In particular, automation frequently suffers from an inordinately high cost for data capture and manipulation before its advantages can be delivered. In fact, researchers have noted that users often reject automation in favor of pre-existing paper-based processes [4, 5, 7]. These researchers have found that paper continues to be maintained in medical and transportation-control environments because paper tools are readily at hand, robust to failure, and offer a more accessible platform for face-to-face collaboration. Similar observations apply to military command posts [9]. Therein, we explained that users relied on their paper tools for the aforementioned reasons and because of these tools resolution, portability, and flexibility of use. Copyright 2002 Association for Computing Machinery. ACM acknowledges that this contribution was authored or co-authored by a contractor or affiliate of the U.S. Government. As such, the Government retains a nonexclusive, royalty-free right to publish or reproduce this article, or to allow others to do so, for Government purposes only. CHI 2002, April 20-25, 2002, Minneapolis, Minnesota, USA. Copyright 2002 ACM 1-58113-453-3/02/0004…$5.00.
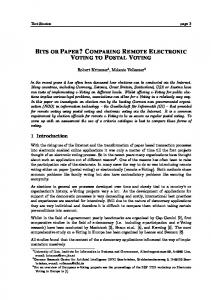
For example, in Figure 1 officers engaged in an exercise are turning their backs on standard computational systems (19 of them, in fact) in favor of an 8-foot-high paper map, annotations on the plastic overlay, and Post-it notes. Arrayed on the ceiling- Figure 1. Officers in a military high map are hundreds command post. Photo courtesy of of Post-it notes repre- William Scherlis. senting particular units (groups of people and machinery) in the field. These objects are added, removed, replaced, diminished, augmented, moved, etc. on the map in order to reflect the on-going situation in the real-world as accurately as possible. Additionally, they are used to support hypothetical reasoning about the opposition forces current activities or future plans and any friendly responses. Despite the efforts of technologists to digitize the ground armed forces, the vast majority of command staffs continue to use this traditional paper-based methodology for the reasons stated. Consequently, we chose to develop tangible multimodal systems in which users can continue to employ their familiar physical tools with computational enhancement (e.g., among other things, remote users gain real-time access to critical information assets placed into remote data repositories by manipulation of the paper tools). The purpose of this paper is to describe an initial quantitative and qualitative comparison of such a tangible system with its physical counterpart and to provide guidance to the designers of future tangible media systems. OVERVIEW In previous papers, we presented Rasa [8], a system designed to support situation assessment in military command posts. Rasa tracks the use of existing physical tools (e.g., Post-its, maps, and plastic map overlays) and understands users’ multimodal language (speaking, writing, pointing, drawing) in a command post environment. In this paper, we present empirical findings of a comparison between Rasa and the paper tools that it augments. We demonstrate that the additional cost of using Rasa over paper and pen is the cost for repairing recognition errors. We present evidence that by combining paper and digital tools, we have constructed a hybrid sys-
Volume No. 1, Issue No. 1
407
CHI
Paper: Ubiquity
tem that supports the continuation of work in spite of power, communications, and hardware or software failures. In the next section, we provide a brief description of how Rasa is used. We then present the goals of this comparison, our methodology, and results. We conclude by comparing Rasa to that of prior systems, suggesting implications for tangible design in general and describing our future research. RASA Rasa is a tangible, multimodal system that offers the benefits of both digital systems and paper. It does so by allowing a user to draw entities on Post-it notes and position those notes on a paper map. The paper artifacts themselves are overlaid on digitizers, so that input on paper is simultaneously supplied to the digital system. Setup To use Rasa, officers tape a paper map to a large touchsensitive, opaque, front-projection digitizing board. Two Post-it “buttons” are then created multimodally and added to the map. By pushing these “buttons,” users can confirm or reject Rasa’s hypotheses of what actions are taking place there. Once this is done, the user registers two coordinates of the paper map using speech and touch. Assuming a Euclidean geometry, the system can interpolate all remaining coordinates on the paper’s surface and can then accept input and project output on the map as though it were a highresolution, digital, touch-sensitive, geo-referenced display. Any other ordinary piece of paper can be similarly enabled so long as common referential coordinates can be established. Using the system When an officer receives the report of a new unit, he or she captures information about the unit’s type, size, status, name, association, etc., by drawing a symbol from an established language of military symbol- Figure 2. Typical unit symbol ogy on each Post-it. Figure 2 shows an example of a mechanized infantry regiment. As the user draws the symbol, digital ink is captured by the system through a tablet that can track the movement of its pen and that also leaves a real ink trail on a Post-it. Rasa’s symbolic “gesture” agent uses this digital ink to recognize the symbols in the language. While the user is touching or drawing on a digitizing surface, he can also speak distinguishing information, e.g., giving the unit a designation, such as “ADVANCED GUARD.” As a result, the Rasa fuses the spoken and gestural information, creating an enemy mechanized infantry regiment called “advanced guard.” Immediately after drawing the symbol, the Post-it can be placed on the map at the desired location, thereby positioning the unit denoted by the Post-it in the digital system. It is this entire act of drawing a symbol, optionally naming it, and placing it on the map that we call a Create command. The physical act that Rasa observes, i.e., drawing the symbol and placing it on the map, is unchanged from the users’ natural behavior. Similarly, users Move units by touching their
408
Volume No. 1, Issue No. 1
changing the world, changing ourselves
old location, then their new location. By touching an entity and issuing a voice command, users can Update the entity’s properties (e.g., touching a company icon and speaking “FIFTY PER CENT”). To Remove a unit from the map, users touch it and say something such as “DELETE THIS UNIT.” In addition to these four basic commands, which we emphasized in our study, users can also (1) draw a line on the map and speak or draw its type “FORTIFICATION,” draw a closed curve and speak “LANDING ZONE ZULU,” or point at the map or entities on the map and ask questions such as “WHERE IS SCOUT SIX?” How Rasa works Continuous speech and handwriting are recognized in parallel. The speech recognition agent supports any Microsoft Speech API-compliant, continuous, speaker-independent recognizer, including Dragon Systems Naturally Speaking and Microsoft’s Whisper. A context-free grammar is provided to the selected engine for interacting with Rasa (over 2000 phrases). Our symbol recognition agent uses a hierarchical machine learning technique [12], and is thus far capable of understanding 200 unit symbols in the language. Written words are recognized by Paragraph’s Calligrapher handwriting engine. A definite clause natural language parser interprets the speech. In general, analyses of spoken and written language each produce a list of interpretations with recognition scores. The multimodal integration process is based on typed feature structure unification. It searches among the sets of interpretations of the individual modalities for the best joint interpretation based on a set of declarative fusion rules [6]. Fusion rules within the multimodal integrator include those for registering the map; adding confirmation and cancel buttons; and adding, moving, updating, and removing units and control measures (e.g., lines, points, and areas that describe proposed or suspected plans). Once the appropriate rule is selected from the list of complete fused commands—in this case, the one for adding a unit symbol to the map—a request is sent to Rasa’s database agent, which performs an insert operation. Upon insertion, information about the unit (information captured in the spoken and written denotation as well as information from external sources) can be projected onto the map. Multimedia feedback is provided throughout Rasa’s use; text-to-speech, video projections, and non-speech audio are used so that Rasa is capable of providing feedback even when one mode of communication (e.g., video projection) is unavailable or situationally infeasible. More complete descriptions of Rasa, its architecture, and components can be found in [8, 10]. THE STUDY Rasa’s development was informed by on-site observations at exercises conducted at the U.S. Marine Corps Base at Twentynine Palms, California and U.S. Army Fort Leavenworth. An initial version of the system was pilot-tested at the First Marine Expeditionary Force, Camp Pendleton, California. In that pilot test there were nine subjects, eight male and one
minneapolis, minnesota, usa • 20-25 april 2002
female, six of which worked individually and three as a team. Subjects ranged in experience from two officers who were mostly unfamiliar with maps and their requisite symbology language to experienced commanders with 20 years on the battlefield. Qualitative descriptions of their opinions are included below. Unfortunately, problems in design and execution of the pilot prevented the quantitative results from yielding a useful comparison. Numerous improvements were made, and the system was then evaluated at the Center for Human Computer Communication’s human interfaces laboratory on the Oregon Graduate Institute campus. In this study, six male subjects from the Oregon Army National Guard used Rasa and paper alone to track an ongoing military situation. The purpose of this study was to address the following questions: Is it possible to design computationally augmented artifacts and processes: 1. That retain all of the important properties of the physical objects, such as their malleability, resolution, permanence, and tangibility? 2. That are as easy to use as or easier to use than the natural, physical tools? 3. That are resistant to power and digital communication failures? 4. That do not significantly increase the task-based performance cost of digitally capturing the information represented by the physical objects? Questions 1 and 2 were addressed through questionnaires filled out by the subjects after their participation. With respect to the system’s failure-resistance (question 3), we measured (a) the amount of work stoppage when a failure occurred during the task and (b) the amount of recovery time. With respect to question 4, we measured (c) the cost of annotating, moving, and removing Post-its and (d) the number, types, and cost of errors imposed by the system. METHOD The subjects acted as the “map plotter,” whose job was to ensure that the annotated map was as accurate as possible, while attempting to establish situational awareness for a report to their commander. One of the authors acted as the “radio man” for the subjects, providing the reports as time elapsed, and verifying the reports as questions arose; the other authors ensured the system remained functional, conducted the interviews, and took notes as interesting behavior developed. Instrumentation and materials Two Windows NT© workstations were configured with Rasa. The first was an HP Vectra, 850 MHz Pentium III workstation with 512 MB of RAM running all of the Rasa agents described above and attached to a front-projected SMARTBoard™. The other system was a Fujitsu Stylistic 2300, 233 MHz Pentium II hand-held with 96 MB of RAM running the Rasa user interface only, with the Cross iPenPro digital pen tablet attached to it. The speech recognition cho-
Paper: Ubiquity
sen was the Dragon Systems’ speech recognizer, Naturally Speaking. Subjects interacted verbally with the map and Post-it notes using an EmKay close-talking wireless microphone. An iPenPro radio frequency-based digital pen tablet from Cross Company’s Pen Computing Group enabled pen-based interaction with the Post-it notes. By placing the officers’ paper map on the SMARTBoard, touch-sensitive interaction with the map was available. A visible overlay of the digital objects that were created was projected onto the SMARTBoard whenever Rasa was online. All subjects’ interactions were videotaped. Moreover, digital ink was logged and spoken audio was recorded for each interaction either at the map or when Post-it notes were being created. Messages passed from one agent to another within the agent architecture over a wireless LAN (including results of speech and gesture processing, parsing, multimodal fusion, etc.) were logged. Training, task, and procedure Each subject was introduced to Rasa’s use, to the map, and to the simulated military scenario, then trained for approximately 15 minutes. During this introduction, each person used Rasa to place several units on a map and move, update, and remove them. They were instructed on how to perform confirmations, how to cancel commands that were in error, and how to reconcile Post-its that had already been physically added to the map in case Rasa or the user had made an error. Subjects were told that Rasa would not understand everything that might need to be added to the map. For example, there was no symbol for a downed pilot, even though the scenario contained such. Indeed, in service of scenario realism and to observe subject reactions to error conditions, the scenario contained no fewer than four requests to add symbols to the map that the system could not recognize. Invariably, these attempts produced errors. Their instruction was to make multiple attempts to ensure that the paper map and the projected symbols from Rasa were reconciled, but the most important thing was to keep the paper map up-to-date and reconcile the computer system later, if need be. Each subject was asked to complete a short written form regarding his or her participation in the experiment. Finally, at the conclusion of the simulation, an interview was conducted to elicit open-ended responses. Task Scenario The scenario was a 90-minute simulation of a realistic twoday-long event. During the scenario there were 14 reports of new units on the scene (requiring the construction of a symbol on the Post-it denoting the unit), 13 reports of unit movement (requiring Post-it movement on the map), 2 reports of units leaving the scene or being destroyed (requiring the units’ removal from the map), several reports that required no immediate action at the map, and 1 update (a report of damage requiring the subject to further augment the unit with spoken language). This is only the minimum num-
Volume No. 1, Issue No. 1
409
CHI
Paper: Ubiquity
ber and types of commands possible. Many of these operations, such as updates, were often used either to complete an operation only partially specified in one modality or during error repair. Moreover, subjects often chose to adjust their physical tokens (i.e., Post-its) multiple times, resulting in additional commands. For example, several subjects performed a correct move action, but revised the placement of the unit on the map anyway. Simulated Power Failure Approximately midway through the scenario, we simulated a system failure by disabling Rasa. Subjects, unaware of the deception, were told to ignore the failure and continue with their task using paper alone, just as they would in the field. After approximately nine reports, Rasa was turned back on and subjects were instructed to reconcile the paper map information with that displayed by Rasa, which projects on the map the last known position of the units in its database. The subjects were asked to update the position of those units that moved and to create digital counterparts for any new units created only on paper while Rasa was disabled. RESULTS Combined, the subjects produced 171 initial commands (first-time Create, Move, or Update commands) to Rasa with an additional 80 related commands (e.g., naming a new unit already added to the map, which is also an Update), for a total of 251 commands. Multimodal utterances fashioned to repair Rasa errors, correct subject’s mistakes, or recover from system failure accounted for an additional 191 commands. On average, for each command the system required 1.22 seconds (s=1.98) to respond, accounting for the time taken to recognize, fuse, and distribute the results for presentation. Overall we were not surprised by the quantitative findings in this study. For the basic operations (i.e. Move and Create), Rasa emulates the typical way that this information is captured by the paper artifacts. Therefore, we hypothesized that Rasa would not contribute to the cost of using these tools. Throughout this section, we will use the standard symbols: x to represent mean observation, s to represent standard deviation, and n to represent number of observations.
changing the world, changing ourselves
t-test results are a two-tailed comparison (unequal variances) between the two modes. Creates When an officer received a report that a new unit had been spotted, they proceeded to draw the unit and then post it on the map. They spent approximately 7 seconds drawing the Post-it, another 4 seconds walking to the board, and the remainder of time, approximately 24 seconds, finding the grid for placement; times were averaged over both Rasa and paper conditions. The mean paper Create time, taken over all subjects, was slightly higher than the mean Rasa Create time. The t-test between paper and Rasa showed only a non-significant trend toward differences between the two modes. A two-way analysis of variance showed no interaction between subject and mode. This is evidence that individual subjects did not interact differently with regard to observed times to perform Create operations whether using Rasa or paper. Moves Subjects adopted their own strategies regarding how to move units. Some would find the unit to move, grab it from the map, locate its new place on the map, and then put it down. Other subjects would find both locations on the map, and then move the unit from one location to the other. Most subjects used each strategy at one time or another but relied primarily on the latter when interacting with Rasa. When moving units, more time was spent finding the unit and its new location (24 sec) than actually moving the unit (less than 6 sec). Because of these variations, move operations were measured from the moment that the report was received to include the time spent searching for locations on the map. The variations in subject behavior would account for the strong subject effect observed when we performed a twoway analysis of variance with interactions on the time users spent looking either for locations on the map or for particular units before moving each unit: F=11.1325, Pr(>F)=2.78e-7. A two-tailed t-test on error-free move times, which includes the search time, does not demonstrate that the time to move units in the paper condition is discernibly different from the Rasa condition.
Rasa-only operations Comparing paper and Rasa Two operation types were measured that occurred only in the The paper condition was measured during the so-called outRasa condition (1) removal of units from the map, and (2) age of Rasa. The breakdown of commands was 2/3 in the the updating of unit information (such as status and identifiRasa condition and 1/3 in the Paper condition. There were a cation) via spoken interaction and pointing. The performance total of 55 initial commands and 9 repairs in the paper condition. Because there were fewer repairs and updates Table 1. Means and standard deviations of operations in Paper and Rasa in the Paper condition, the proportion of Rasa to Pamode conditions and two-tailed t-test results. per commands was 5 to 1. OperaCompariPaper Rasa Table 1 summarizes the quantitative results for the tion son operation time (e.g., time spent drawing the unit and (sec) putting it on the map = Create operation time) of the x x s n s n t-test initial commands given to Rasa that did not produce an error, and compares them to the same operations Create 38.29 12.48 17 32.10 13.30 54 p < 0.0898 performed in the paper condition without error. The Move 39.83 18.59 35 33.50 14.31 28 p < 0.1318
410
Volume No. 1, Issue No. 1
minneapolis, minnesota, usa • 20-25 april 2002
Paper: Ubiquity
summaries of correctly executed (initial or related) commands are given in Table 2. Table 2. Means and standard deviations of Rasa-only operations.
x
s
n
Other updates: status, etc.
1.85
0.64
58
Removal of unit
2.15
0.67
15
Operation (sec)
Errors Table 3 is a classification of “errors” found during our experiments. Twenty-eight percent (57) of all initial or related commands resulted in an error of one of four types: recognition, performance, Table 3. Errors for Rasa: initial or system, or guaranrelated (251) commands teed. Commands were Error type # Percentage flagged as recognition Recognition 10 5.3% errors whenever the system misunderstood Performance 27 10.8% what the user inSystem 15 6.0% tended and the utterance was one that the Guaranteed 15 6.0% system should otherwise understand. Of the 10 recognition errors, one was a gesture recognition error; the remainder were speech errors. All of the speech errors but one were single-word utterances. If the subject made a mistake by producing an utterance form that the system was not programmed to understand, this utterance was tagged as a performance error. These utterances may have been either “out-of-grammar” or a user mistake (e.g. the subject drew the wrong symbol). If the system made an error due to a correctable experimental or system design flaw, we counted these as system errors (e.g. static produced by wireless microphone). At times the scenario indicated that the subject should perform an operation that the subject would consider valid but that could not be properly recognized by Rasa. These operations were classified as guaranteed errors. These were out-of-grammar utterances for which system understanding at least in one modality was entirely impossible, whereas with performance errors there did exist a phrase to capture the meaning intended. In addition to the errors reported in Table 3, which were made while using Rasa, the subjects made two performance errors on initial commands while in the paper condition. Effect of system failure Subjects responded to the simulated failure of Rasa with only a moment’s hesitation in the task. The explanation of the failure and direction to proceed was the only time spent dealing with the failure because the tools for continuing the task were unchanged. Cost of repairing errors or recovering from failure In this section, we examine the performance cost for correcting errors and report on the number of spirals based on recognition errors observed in the experiment. Table 4 summarizes the human performance time for individual repair operation times that resulted in a correct com-
Table 4. Means and standard deviations of error-free repair operation times (74/82).
x
s
n
32.97
12.95
9
3.11
0.84
19
5.30
8.23
20
2.01
1.10
15
Repair of Update
1.88
0.64
19
Repair of Delete
2.11
0.857
16
Operation (sec) Repair of Create (gesture) Repair of Create (verbal)
+
++
*
Repair of error: Move
Recovery of failure: Move
**
mand. In the Rasa condition, 82 of the 191 repair attempts resulted in successful completion of the command (i.e., errors corrected on the first attempt); the remaining errors required more than one repair attempt (i.e., spirals of length two or more). However, on the whole, these spirals were not due to recognition failures but were rather a mix of the error types listed. Indeed, the guaranteed errors ensured that spirals would occur for each subject. Recovering/repairing a create Subjects could use two methods to correct an error made when placing a new unit on the map. They could draw the symbol representing the unit again, almost doubling the amount of time needed to complete the command (21 cases, 9 were successful on the first attempt).+ Otherwise, if the symbol was correct, they could point at the unit on the map and speak its type and size, which is the same technique used when recovering from system failure (53 cases; 19 were successful on the first attempt).++ If the repair was successful on the first attempt, this operation added on average only an additional 10% to the operation time. A t-test demonstrates that this reduction is significant. (t = 17.8419, df = 59.423, pvalue = 2.2e-16). Recovering/repairing a move Recovering from errors in moving units is accomplished by repeating the simple pointing operation: once on the old location and then at the new location.* For repairs, this operation took significantly less time than original move operation attempts (t = 10.3797, df = 70.126, p-value = 8.122e-16). The move operation took even less time after Rasa itself has recovered from a failure (i.e., after the downtime that we simulated).** In this case, the new location is marked by the Post-it, while Rasa projects the old location from the data that it stored prior to the outage. The mean time for recovery of move operations after a systems failure was only 6% (2.01/33.50 seconds) of the original time (t = 10.059, df = 31.027, p-value = 2.232e-11). Because subjects typically need not search again for the unit that is being moved or its new location, this time is eliminated during repair and explains the reduction in time seen here. Error spirals Recall that there were 191 repair attempts, of which 82 were corrected on the first attempt. The remaining 109 repair attempts clustered into 38 spirals. Five of these spirals were never completed. Eight of them were exclusively made up of
Volume No. 1, Issue No. 1
411
CHI
Paper: Ubiquity
recognition errors (i.e., error spirals). These were three spirals of length 2, two of length 3, one of length 4; and two of length 5. Noteworthy is that all of these spirals were from single-word utterances. Compound costs of errors We measured the end-to-end time for each operation regardless of the initial error type. These total times include the operation, any subsequent repairs, system presentation of results, confirmation by the user, etc. Because system and guaranteed errors are correctable and do not accurately reflect expected error conditions, they are excluded here. Therefore, only 41 of the original 54 Create and 29 of the original 35 Move commands from Table 1 can be used for this comparison. Once the correct location is found during the initial command attempt, there is no searching for coordinates during repair. Therefore, this time does not factor in when comparing Move operations in Table 5. Create operations that include repairs take an average of 50% more time than non-repairs. Moves that include repairs take only slightly more time than non-repairs (non-significant). Updates require much more time for repairs than for nonrepairs, but the variation in repair times is so large that the difference is not statistically significant.
changing the world, changing ourselves
Essentially, subjects told us that Rasa was as easy or easier to use than paper alone, generally did not impede (or even improved) performance, and was preferred to paper alone. These sentiments were also shared in the interview session. We were concerned about the number of errors that were encountered. However, most subjects told us the number of errors was acceptable, and those present were easy to correct. Finally, after working through the simulated failure, subjects generally believed work continued unhindered and that recovery from errors was easy. Quotes from two of the more experienced National Guard officers capture the essence of why the errors may be of less concern than we initially expected and are representative of the responses in general. “I like the idea that it was overlaid over a map. Because when the system went down, everything was just there, and you just could continue on. For me it was seamless.” “You don’t have to be a rocket scientist to [use Rasa]. That’s why it’s nice.” DISCUSSION Tangible tools must demonstrate (1) whether they are an adequate replacement for the existing set of physical tools, and (2) whether they are a more effective replacement than
Subjects response Subjects provided feedback on their experiences with Rasa, first by completing a post-test questionnaire and then in an open interview session. The Table 5. Rasa-only total time in performing error-free operations, compared to those of operations that had errors, including all repair time. questionnaire and responses are given in TaError-free Compound repair Comparison ble 6. We have included in the table the re- Operation (sec) operation operation sponses from our nine USMC pilot test subjects, who experienced considerably more x x s n s n t-test p-value system errors than these six Guardsmen using Create 40.11 10.456 41 60.20 23.845 18 0.002648 an earlier version of the system. Move
38.42
15.801
29
42.76
26.994
11
0.6246
Updates
3.478
1.033
58
9.324
16.199
17
0.1564
Table 6. Subjective responses to post-test questionnaire Response Always too long
Performance
1 Impossible
Compared to paper
Preference
# of errors
Error Correction
Work stoppage
Recovery
Not nearly as easy to use
Paper preferred over Rasa
Too many
Extremely difficult
Complete
Impossible
Paper preferred over similar systems
More than I would have liked
More than 10 minutes
Extremely difficult
Occasionally too long
Impeded 1 significantly
Not as easy as 2 paper
Within tolerance
Impeded 9 somewhat
As easy as 1 paper
7 No preference
1 Acceptable
Moderately 7 difficult
Several 2 minutes
Difficult
Better than expected
Impeded 3 slightly
Easier than 3 paper
Yes. With 7 improvements
7 Few
3 Easy
13 Briefly
Moderately 1 difficult
2
Immediate
Did not im1 pede
Much easier 6 than paper
1 Rasa
Almost none 7 or none
2
14 Easy
13
Improved*
412
3 Difficult
None
3 *Subjects added a new value to the performance measure to indicate their belief that Rasa improved it.
Volume No. 1, Issue No. 1
minneapolis, minnesota, usa • 20-25 april 2002
traditional computer interfaces. We attempted to answer the first question with this initial research (i.e., “Is Rasa at least as good as, if not better than, the real thing?”). Although we cannot prove the null hypothesis, we found no evidence that the cost of using Rasa is significantly greater than the cost of using paper for error-free operations. Moreover, system response and human activity that we would typically characterize as computer interaction were both brief. Because Rasa parallels the use of the paper map and Post-its (i.e., most of the activity mimicked the expected physical actions), adding additional tasks only when there are mistakes made by the system, this finding is not surprising. It is the repair of these mistakes that, at least for some individual operations, measurably increases the cost over that of the paper tools. The use of Rasa and of paper for this task is dominated by the time to find locations and objects on the map. In order to investigate the potential for Rasa to improve the paper-based process, we conducted a follow-on study in which five male subjects each issued 20 commands whose purpose was to get Rasa to find various grid locations. For example, users said something like “SHOW LOCATION FIVE-ONE-SEVEN, TWO-THREE-SIX.” In response, Rasa displayed a circle at the desired location and confirmed via text-to-speech. Across all subjects, the mean time taken to find a location was 6.9 seconds, including time needed to correct recognition errors. Overall, Rasa provided a 93% utterance recognition rate and a 99.5% word recognition rate. Comparing the 7 seconds spoken time to find a coordinate with the 24 seconds observed in the main study, we hypothesize that Rasa could improve the overall process substantially. Future research needs to test this hypothesis with military users in a realistic scenario. Finally, we were surprised that in general subjects’ preferred Rasa to paper and found it as easy or easier to use, despite the abundance of errors. We can attribute many of these errors to inadequate training (performance errors), the introduction of tasks intended to guarantee errors, and the prototypical nature of the system (system errors and lack of adequate language coverage: performance errors). Because the tool is part of their natural work environment, its cost is negligible despite the errors, explaining in part the users’ reaction. RELATED WORK The first system to combine inputs multimodally was Bolt’s ‘Put-That-There’ [1]. Rasa’s multimodal framework is derived from QuickSet [2], one of the earliest multimodal systems to combine ink-based map-interfaces (with semantics beyond deixis) and speech input, in real-time. In attempting to augment paper-based work practices, we draw inspiration from the early work on the DigitalDesk [11], which first introduced paper as an element of computation within an augmented environment by combining machine vision with optical character recognition. With the DigitalDesk, users transferred portions of text from the paper into
Paper: Ubiquity
computational tools (e.g., a calculator) by pointing at first one and then the other. Most recently, Berkeley’s Designer’s Outpost is most similar to Rasa in approach. Both are concerned with augmenting existing paper-based work practices. The Outpost allows users to construct an affinity diagram rapidly by labeling Postits, connecting them with arcs by drawing lines between Post-its, and rearranging the nodes on the diagram by moving the notes themselves. Similarly, a vision-enabled Rasa [10] can track the Post-its, allowing them to be moved about the map without needing a touch-sensitive surface. Rasa’s ability to recognize the spoken and written language during task execution, thereby attributing new meaning in the computational system that reflects those established on paper distinguishes it from these systems. Moreover, to our knowledge, despite the contributions of these and other authors, there have been no previous attempts to empirically evaluate tangible systems. FUTURE WORK Command post staff do not merely track battles, nor do they restrict themselves to a single map. Rather, they coordinate multiple maps that support different job roles, deconflict information reports, and collaborate at multiple levels. Paper tools aid in these tasks by making the information visible at a high-resolution in a shared physical location. However, the costs of coordination, deconfliction, and collaboration remain high, especially with remote collaborators. Rasa enables collaboration among multiple maps. For example, an officer can circle a set of Post-its on the map’s overlay and have her “gesture” and the units being circled projected onto her remote collaborator’s paper map. Currently, the cost of achieving this level of collaboration in real command posts—even simply capturing free-hand drawings on these overlays—is prohibitive. Rasa may be better equipped to support the kind and quality of collaborative activity present in command posts than current paper systems and existing computational systems developed for battle tracking. Despite the apparent disadvantages of digital systems for users and their resulting preference for paper, it is important to measure any solution against the perceived technological state-of-the art. Similar comparisons between multimodal and GUI-based systems for simulation initialization have shown both a preference and an efficiency advantage for multimodal map systems [3]. This research showed that we can expect significant performance improvement of multimodal systems (on the order of eight to ten-fold) over traditional WIMP interfaces for map-based tasks, including the costs associated with errors in recognitional systems. Future research will compare Rasa’s tangible multimodal interface, with the standard GUIs employed in modern command and control systems. Finally, several open questions remain with respect to tangible, multimodal systems designed for field use: speech systems are notoriously error-prone in highly noisy environments, the utility of front-projection systems in active rooms
Volume No. 1, Issue No. 1
413
CHI
Paper: Ubiquity
are limited in their usefulness, and a sufficiently high percentage of the naturally occurring language must be covered by the speech, handwriting, and multimodal design. Experimental examination of the benefits of tangible tools must assuredly reach beyond the single-user, empirical, laboratory study conducted in this case to a series of multi-user field trials, directly comparing paper, Rasa-like tools, and state-ofthe-art GUIs. CONCLUSIONS Officers prefer paper because it is fail-safe, malleable, lightweight, cheap, and high in resolution. By developing Rasa, we hoped to achieve the integration of these benefits with those that we can expect from computation—e.g., data distribution, remote collaboration, etc., along with a superior human interface. We have described an experiment that compares the cost of using Rasa that of using the paper tools it is based upon. This comparison demonstrates that the only new cost in using Rasa is due to the repair of errors. Despite the costs, these users prefer Rasa to their paper tools because they gain access to computing and do not have to give up what the paper has to offer. Moreover, due to the distinct persistence properties of paper combined with those of computer systems, Rasa exhibits a synergistic robustness to failure seldom seen in computing tools. Finally, we argue that with a few straightforward enhancements (e.g., grid and unitfinding via speech), users would likely see an immediate and measurable performance improvement in their task. ACKNOWLEDGMENTS This research was supported in part by DARPA’s Command Post of the Future Program (contract number N66001-99-D8503), also, in part, by ONR grants: N00014-99-1-0377, and N00014-99-1-0380. This work was conducted at Oregon Health and Science University’s School of Engineering (formerly OGI) and at Pacific Northwest National Laboratory, which is operated by Battelle for the U.S. Department of Energy under contract DE-AC06-76RLO 1830. We wish to thank particularly our colleagues Sharon Oviatt, and Charles LoPresti for their support, and Col. Steven Fisher, USMC (ret.) for his patronage. Most importantly, we wish to acknowledge the men and women of the 41st Separate Infantry Brigade, Oregon Army National Guard, who participated as subjects in this research. REFERENCES [1] Bolt, R.A., Put-That-There: Voice and gesture at the graphics interface. Computer Graphics, 14(3) (1980): 262-270. [2] Cohen, P.R., Johnston, M., McGee, D.R., Oviatt, S., Pittman, J., Smith, I., Chen, L., and Clow, J. QuickSet: multimodal interaction for distributed applications, in the Proceedings of the International Multimedia Conference, ACM Press, (Seattle, WA, November 1997), 31-40.
414
Volume No. 1, Issue No. 1
changing the world, changing ourselves
[3] Cohen, P.R., McGee, D.R., and Clow, J. The efficiency of multimodal interaction, in the Proceedings of the Applied Natural Language Programming Conference, Association for Computational Linguistics Press, (Seattle, WA, April 2000). [4] Gorman, P., Ash, J., Lavelle, M., Lyman, J., Delcambre, L., and Maier, D., Bundles in the Wild: Managing Information to Solve Problems and Maintain Situation Awareness. Library Trends, 49(2) (2000): 266-289. [5] Heath, C. and Luff, P., Technology in Action. Learning in Doing: Social, Cognitive and Computational Perspectives, R. Pea, J.S. Brown, and C. Heath (Eds.). Cambridge, UK: Cambridge University Press, (2000). [6] Johnston, M. Unification-based multimodal parsing, in the Proceedings of the International Joint Conference of the Association for Computational Linguistics and the International Committee on Computational Linguistics, Association for Computational Linguistics Press, (Montreal, Canada, August 1998), 624-630. [7] Mackay, W.E., Is paper safer? The role of flight strips in air traffic control. ACM Transactions on ComputerHuman Interaction, 6(4) (1999): 311-340. [8] McGee, D.R. and Cohen, P.R. Creating tangible interfaces by transforming physical objects with multimodal language, in the Proceedings of the International Conference on Intelligent User Interfaces, ACM Press, (Santa Fe, NM, Jan. 14-17 2001), 113-119. [9] McGee, D.R., Cohen, P.R., and Wu, L. Something from nothing: Augmenting a paper-based work practice with multimodal interaction, in the Proceedings of the Conference on Designing Augmented Reality Environments, ACM Press, (Helsingor, Denmark, April 12-14 2000), 71-80. [10] McGee, D.R., Pavel, M., Adami, A., Wang, G., and Cohen, P.R. A visual modality for the augmentation of paper, in the Proceedings of the Workshop on Perceptive User Interfaces (PUI'01), ACM Press, (Orlando, FL, Nov. 15-16 2001). [11] Wellner, P. The DigitalDesk calculator: tangible manipulation on a desktop display, in the Proceedings of the Symposium on User Interface Software and Technology, ACM Press, (Hilton Head, SC, November 1991), 27-33. [12] Wu, L., Oviatt, S.L., and Cohen, P.R., From members to teams to committee -- a robust recognition approach to gestural and multimodal signal processing. IEEE Transactions on Neural Networks, (special issue on Intelligent Multimedia) (2002): in press.