INLICON-10-19882 PREPRINT
Comparing Safe vs. AtRisk Behavioral Data to Predict Accidents NPIC&HMIT 2010 Jeffrey C. Joe November 2010
The INL is a U.S. Department of Energy National Laboratory operated by Battelle Energy Alliance
Idaho National laboratory
This is a preprint of a paper intended for publication in a journal or proceedings. Since changes may be made before publication, this preprint should not be cited or reproduced without permission of the author. This document was prepared as an account of work sponsored by an agency of the United States Government. Neither the United States Government nor any agency thereof, or any of their employees, makes any warranty, expressed or implied, or assumes any legal liability or responsibility for any third party's use, or the results of such use, of any information, apparatus, product or process disclosed in this report, or represents that its use by such third party would not infringe privately owned rights. The views expressed in this paper are not necessarily those of the United States Government or the sponsoring agency.
COMPARING SAFE VS. AT-RISK BEHAVIORAL DATA TO PREDICT ACCIDENTS Jeffrey C. Joe Idaho National Laboratory PO Box 1625, Mail Stop 3605, Idaho Falls, ID 83415-3605
[email protected]
ABSTRACT The Safety Observations Achieve Results (SOAR) program at the Idaho National Laboratory (INL) encourages employees to perform in-field observations of each other's behaviors. One purpose for performing these observations is that it gives the observers the opportunity to correct their co-worker's at-risk work practices and habits (i.e. , behaviors). The original underlying premise of conducting theses observations is that major injuries (e.g., OSHA-recordable events) are prevented from occurring because the lower level at-risk behaviors are identified and corrected before they can propagate into culturally accepted unsafe behaviors that result in injuries or fatalities. Unlike other observation programs, however, SOAR also emphasizes positive reinforcement for safe behaviors observed in order to help establish a strong positive safety culture. Since the SOAR program collects both safe and at-risk leading indicator data, this provides a unique opportunity to assess and compare the two kinds of data in terms of their ability to predict future adverse safety events. This paper describes the results of analyses performed on SOAR data to assess their relative predictive ability. Implications are discussed. Key Words: Safety culture, Behavior based safety
1
INTRODUCTION
The ability to predict accidents reliably and prevent major injuries would be a welcome and profitable development in terms of human lives and money saved. A considerable amount of time and money is invested in safety programs designed to collect data that are presumably leading indicators for events adverse to safety. However, independent empirical research on the various safety programs has not provided definitive proof that data they collect on "lower-level" incidents are reliable indicators of major injuries or overall future safety performance [1-2]. This leaves those who must make decisions about how to allocate resources (e.g., to safety, production, etc.) in a quandary. Even those decision makers that prioritize safety over production can struggle with precisely how they should allocate their resources to ensure safe operations. Of the myriad safety programs on the market that also claim to have leading indicators, which one potentially offers the greatest return on investment? Clarity on these issues would be most welcome; especially for high-risk industries that have had high-profile accidents and are continuing to experience greater public scrutiny. One recent (20 April 2010) and notable example was in the petrochemical industry, when multiple safety systems on the Deepwater Horizon offshore oil drilling rig failed, in part because data that could have been used as leading indicators were misinterpreted, discounted, not deemed reliable, or ignored, resulting in the largest oil spill in U.S. history. While there are many different approaches, methods, and tools that have been developed to predict major injuries or adverse safety events, they tend to fall in one of two general categories. The first general category is exemplified by Heinrich's law and his safety pyramid [3]. According to [4], Heinrich
NPIC&HMIT 2010, November 7-11,2010, Las Vegas, Nevada
1439
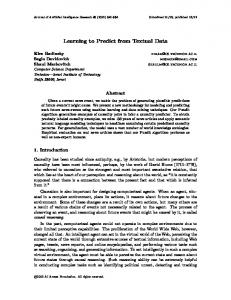
law states, "That for every major injury there are 330 accidents with no injury and 29 minor injuries". The familiar safety pyramid, as seen in Fig. 1, is typically how this law is depicted.
29 Minor Injuries
330 Accidents/Incidents
Figure 1. Heinrich's Safety Pyramid.
The pervasive use of Heinrich's work as the underlying theoretical model or basis for an approach results in many safety programs that focus on identifying, understanding, and eliminating (or mitigating) the pre-cursors to accidents and incidents. This is because Heinrich's work and conventional wisdom suggest a causal relationship between "lower-level" incidents and major injuries. However, use of this model can result in an inordinately strong focus on at-risk behaviors and other precursors to major injuries and major events, and a failure to focus on normal performance and the precursors to success. Moreover, this 'focus on the negative' is detrimental to a strong positive safety culture. A strong positive safety culture can never come from an environment where there is an constant focus on correcting minor accidents and incidents committed by workers, and no positive reinforcement or praise for their successful execution of work. The second general approach is advocated by various safety experts, but is explained quite clearly in Erik Hollnagel's work on the Efficiency-Thoroughness Trade-Off (ETTO) principle [5]. While the ETTO principle itself is about the trade-off decisions people necessarily must make between being efficient or thorough, Hollnagel also describes and argues for an underlying theoretical model that focuses on understanding normal (e.g., error free or successful) performance. The underlying theoretical model for this approach is that understanding why and how successful performance occurs allows for safety programs, processes, tools, and techniques to be developed that can positively reinforce future successful safety performance and help foster a strong positive safety culture. Table I summarizes some of the key differences between the first general approach, as exemplified by Heinrich, and the second general approach, as exemplified by Hollnagel.
Table I. Key differences between general approaches to safety "Heinrich" approach
"Hollnagel" approach
Focus on Failure
Focus on Success
Reacti velPrevention Focused
Proactive/Promotion Focused
Detrimental to a Strong Positive Safety Culture
Supportive of a Strong Positive Safety Culture
The Safety Observations Achieve Results (SOAR) program at the Idaho National Laboratory (INL) is a behavior based safety program founded upon the principles of Heinrich's law as well as the Hollnagel
NPIC&HMIT 2010, November 7-11 , 2010, Las Vegas, Nevada
1440
approach. The SOAR program encourages employees to perform in-field observations of each other's work performance (i.e., behaviors). An in-field observation can occur at any time and at any place - in experimental facilities, production facilities, office buildings, transportation, work-related travel, and even off-work personal time. The purpose of the observation is to provide feedback on both the safe and atrisk behaviors observed. At-risk behaviors are those that were less safe than the ideal, yet did not result in any kind of negative outcome or adverse safety event. The original underlying premise in SOAR of observing at-risk behaviors is based on Heinrich's law, and that major injuries (e.g., OSHA-recordable events) are prevented from occurring because the lower level at-risk behaviors are identified and corrected before they can propagate into culturally accepted unsafe behaviors that result in injuries or fatalities . This has been the standard approach for many behavior based observation programs. SOAR, however, has evolved and is unique in that it also emphasizes positive reinforcement for safe behaviors observed. The underlying premise of doing this is consistent with Hollnagel's work on the ETTO principle, and that positive reinforcement of safe behaviors helps establish a strong positive safety culture. The SOAR program yields both safe and at-risk leading indicator data, which enables their comparison in terms of their ability to predict future major injuries. Thus, the SOAR program provides an opportunity to gain insights into the validity of the two different approaches and their underlying philosophies. The remainder of this paper describes the analyses performed on both the safe and at-risk SOAR data to assess their relative ability to predict future OSHA-recordable events.
2
METHOD
The general strategy for the analyses was to perform a series of log Poisson regression analyses on both the safe and at-risk behavior data to compare how well they predict the OSHA-recordable events that occurred. Because the SOAR and OSHA data are frequency data, a non-parametric statistical version of regression (i.e., a log Poisson regression analysis) was used. In addition, for these analyses, a time series approach (i.e. , time lagging) was used such that the safe or at-risk data from a previous month was used to predict the number of OSHA-recordable events for the current month, while also controlling for the number of OSHA-recordable events from the previous month. The controlling factor was added to address the rival hypothesis that the previous month's number of OSHA-recordable events might reliably predict the next month's number of adverse safety events. As the saying goes, "Past performance is often the best predictor of future performance". In addition, there was considerable variability in the SOAR data in terms of the number of SOAR observations performed in a month, and in the number of safe or atrisk behaviors that can be counted in a single observation (from 0 to the total number of all behaviors observed). To address these variability issues, the SOAR data were normalized by converting the safe and at-risk frequency data into two separate rates by dividing the total number of safe (or at-risk) behaviors observed in a month by the total number of observations performed in that month. Data from April 2008 to September 2009 were selected for the analyses. This was done so that the results of this study could be compared with previous results [1]. During this time period 28,364 SOAR observations were performed, whereby 57,831 people were observed engaging in 455,291 separate behaviors. It is also important to note that the vast majority of the behaviors were viewed as safe (97%), and that very few OSHA-recordable events occurred during this time period. In order to maximize the likelihood that a predictive relationship would be found between SOAR observations and the OSHA-recordable events, these analyses included only the most frequent OSHArecordable events that occurred at the INL during this time, which were cuts (i.e., lacerations and abrasions), and people falling down due to environmental and/or working conditions (i.e., slips and trips), and to use only those safe and at-risk behaviors that would be logical precursors to those OSHArecordable events. In the SOAR data, there were a number of frequently occurring behaviors that were logical behavioral precursors to these two OSHA-recordable events. For cuts, the safe and at-risk use of
NPIC&HMIT 2010, November 7-11,2010, Las Vegas, Nevada
1441
cut resistant gloves was a frequently observed and logical precursor behavior to getting cut. For talIs, the safe and at-risk use of footwear with proper traction, and use of/failing to use a safe travel path were both frequently observed behaviors and were also logical precursors to falling. Consequently, the first series of log Poisson regression analyses examined how well the OSHArecordable event, cuts, can be predicted by the safe behavior, using cut resistant gloves, relative to the atrisk behavior - failing to use cut resistant gloves, while controlling for the previous number of cuts. The second set of log Poisson regression analyses examined how well the OSHA -recordable event, slips/trips/falls , can be predicted by safe and then at-risk behaviors: using/failing to use footwear with proper traction, and then using/failing to use a safe travel path, while again controlling for the number of falls that occurred previously.
3
RESULTS
3.1 Results for the OSHA-Recordable Event: Cuts As reported previously in [1], one log Poisson model regressed the rate normalized at-risk behavior of failing to use cut resistant gloves on cuts, while controlling for the number of cuts that occurred in the previous month. The results indicated that the overall model was significant (Chi-square = 31.63, df = 13, p = .003). Moreover, the analysis showed that the at-risk hand rate variable for a given month was a significant predictor of the number of cuts the following month (Chi-square = 5.81 , df = 1, P = .016). Specifically, as the rate of failing to wear cut resistant gloves increases, the number of cuts also tends to Increase. For the comparative analysis using safe behaviors, the rate normalized safe behavior of using cut resistant gloves was regressed on to cuts, while controlling for the number of cuts that occurred in the previous month. The results showed that this overall model was also significant (Chi-square = 22.61 , df = 13, p = .047), and that the proper use of cut resistant gloves was also a significant predictor of the number of cuts the following month (Chi-square = 7.47, df = 1, P = .006). Specifically, as the rate of safe behaviors increases, the number of cuts tends to decrease, as expected. Table II summarizes these results.
Table II. Summary of Analyses to Predict Cuts Factor
Significant Predictor of Future Cuts
At-risk behavior of failing to wear cut resistant gloves
Yes
Safe behavior of wearing cut resistant gloves
Yes
Number of Cuts from the Previous Month
No
3.2 Results for the OSHA-Recordable Event: Slip/Trips/Falls As reported previously in [1], the rate normalized at-risk behaviors of failing to wear footwear with proper traction and failing to take a safe travel path were regressed on falls , while controlling for the number of falls that occurred the previous month. The results of the best overall model were only marginally significant (Chi-square = 19.91 , df = 13, p = .098). Moreover, the analysis showed that the
NPIC&HMIT 2010, November 7-11,2010, Las Vegas, Nevada
1442
best predictor of falls for a given month was the number of falls the previous month (Chi-square = 3.91 , df = 1, P = .048), and the at-risk behavior of wearing proper footwear was at best only a marginally significant predictor of future falls (Chi-square = 3.08, df = 1, P = .079). The at-risk behavior of proper travel path was not statistically significant as a predictor of future falls. Given the results in this previously reported regression model provided only tepid support for the hypotheses of interest, additional regression models were performed to ascertain whether they could predict falls more effectively. These additional analyses isolated the two SOAR at-risk precursor behaviors (e.g., improper footwear and unsafe path), and created two separate regression models to predict OSHA-recordable falls. The first model regressed the rate normalized at-risk behavior of failing to wear proper footwear on falls , while controlling for the number of falls from the previous month. The results from this model showed only the previous number of falls were a reliable predictor of future falls (Chi-square = 5.l5, df = 1, P = .02). The second model regressed the rate normalized at-risk behavior of failing to take a safe travel path on falls , while controlling for the number of falls from the previous month. The results for this model were similar in that they showed only the previous number of falls were a reliable predictor of future falls (Chi-square = 12.85, df = 1, P = .0003). For the comparative analyses using safe behaviors, the rate normalized safe behavior of wearing proper footwear was regressed on to falls , while controlling for the number of falls from the previous month. The results from this model showed again that the previous number of falls was a reliable predictor of future falls (Chi-square = 6.27, df = 1, P = .012), but that the wearing of proper footwear was also a marginally significant predictor of future falls (Chi-square = 3.48, df = 1, P = .062). Specifically, as the rate of wearing footwear with proper traction increased, the number of falls tended to decrease, but very modestly. The second comparative model regressed the rate normalized safe behavior of taking a safe travel path on falls , while controlling for the number of falls from the previous month. The results for this model showed only the previous number of falls were a reliable predictor of future falls (Chisquare = 3.88, df = 1, P = .049). Table 3 summarizes these results.
Table III. Summary of Analyses to Predict Falls Factor
Significant Predictor of Future Falls
At-risk behavior of failing to wear proper footwear
No*
At-risk behavior of failing to take a safe travel path
No
Safe behavior of wearing proper footwear
No*
Safe behavior of taking a proper travel path
No
Number of Falls from the Previous Month
Yes
*Factor was margmally sIgmficant m certam regressIOn models.
4
CONCLUSION
The purpose of this study was to follow up and enhance the results obtained previously in [1], by further analyzing the relationship between SOAR data and OSHA-recordable events at the INL. The previous study found equivocal empirical support for the hypothesis that at-risk behaviors would be a
NPIC&HMIT 2010, November 7-11,2010, Las Vegas, Nevada
1443
good predictor of future OSHA-recordable events. Specifically, only the at-risk behavior of failing to wear cut resistant gloves proved to be a reliable predictor of future cuts. No at-risk behaviors that were logical precursors to falls were significantly predictive of future falls . Unfortunately, this current study was only marginally more successful in finding empirical support for the hypothesis that safe behaviors would be a good predictor of future OSHA-recordable events. Specifically, the safe behavior of wearing cut resistant gloves was a reliable predictor of preventing future cuts, such that as the observed rate of wearing cut-resistant gloves increased, the number of cuts tended to decrease. Moreover, the safe behavior of wearing proper footwear was a marginally significant predictor of future falls , but no other safe behaviors that were logical precursors to falls were significantly predictive of falls . As with the previous study [1], two particular challenges for the current analyses were the sparseness of OHSA-recordable event data, and the variability in the SOAR data. There are very few cuts, falls , or other injuries and illnesses at the INL, which is a sign of a safe work environment. However, the sparseness of these data makes this analysis somewhat challenging because events that are irregular and occur with relatively low frequency are difficult to predict. Combine this with the fact that the data used to make the prediction has a significant amount of variability, and the likelihood that a simple relationship will be present and easily modeled is low. This study attempted to overcome some of these limitations by using more of the SOAR data. As mentioned previously, the vast majority of the SOAR data were observations of safe behaviors, and the hope was that these data would be less variable and be better predictors of OHSA-recordable events. In addition, the statistical techniques and experimental design employed for these analyses were relatively simple. More complex hypotheses should be tested on these data, such as, whether a 'third moderating variable' is present (e.g., availability of resources, seasonal variations, changes in management), through the application of more sophisticated statistical techniques. Including a longer time period than 18 months may also help reveal a meaningful relationship between the SOAR and OSHA data. On a more positive note, it is worth noting that in the case of cuts, both the at-risk and safe behaviors of failing to wear/wearing cut resistant gloves were independently reliable predictors of future cuts, even when controlling for the past number of cuts. (For falls , the at-risk and safe behaviors of failing to wear/wearing proper footwear were marginally significant predictors, even when controlling for past falls). This supports the inference that there is merit to both the 'Heinrich approach' and the 'Hollnagel approach' to safety. As such, this paper contributes to the empirical basis for both approaches, and this is meaningful given that both approaches have been accepted and used without an overwhelming amount of empirical evidence to support the veracity of either. These findings also provide some support to the notion that safety culture, which is not a fully established and accepted concept, does have, in fact, some empirical basis. It is also interesting to note that relatively speaking, the Chi -square for the model with the safe behavior factor was larger than the Chi-square for the model with the at-risk behavior. Additional statistical tests should be performed to determine if the difference in the amount of error variance accounted for by the two different models is significantly different from each other. That is, does the safe behavior model significantly account for more error variance than the at-risk behavior model? If so, then there is some evidence to support those who endorse the Hollnagel approach to safety, and that focusing on success and being proactive can meaningfully impact safety performance in a manner that is likely more cost effective than the Heinrich approach in terms of return on investment. At the very least, while more research can be done, knowing that a 'focus on the positive' can yield meaningful and measurable safety results and can foster a positive safety culture should be seen as a new opportunity that management and decision makers can seize as they continue to search for additional approaches to improve safety performance. The quest for continual improvement can be never-ending, and any new tools that can help accomplish that quest should be a welcome addition.
NPIC&HMIT 2010, November 7-11,2010, Las Vegas, Nevada
1444
5
ACKNOWLEDGMENTS
Work supported by the U.S . Department of Energy, Office of Nuclear Energy, under DOE Idaho Operations Office Contract DE-AC07-05ID14517.
6 1.
REFERENCES
J. C. Joe, "Mining Behavior-Based Safety Data to Predict Safety Performance," Proceedings of the IOth International Conference on Probabilistic Safety Assessment and Management, PSAM-85-I , Seattle, WA, 7-11 June 2010 (2010).
2. B. P. Hallbert, J. C. Joe, D. D . Dudenhoeffer, L. G. Blackwood, K . Hansen, S. Mahadevan, and J. Wreathall, "Developing human performance measures," NRC Technical Letter Report, ML061000459. 3.
H.W. Heinrich, Industrial Accident Prevention, 4th Edition, McGraw-Hill Book Company, Inc., New York, USA (1959).
4. E. Hollnagel, Safer Complex Industrial Environments: A Human Factors Approach, Ch. 9, CRC Press, Taylor & Francis Group, Boca Raton, USA (2009) 5.
E. Hollnagel, The ETTa Principle: Efficiency-Thoroughness Trade-Off, Ashgate, Aldershot, England (2009).
This manuscript has been authored by Battelle Energy Alliance, LLC under Contract No. DE-AC0705ID14517 with the U.S. Department of Energy. The United States Government retains and the publisher, by accepting the article for publication, acknowledges that the United States Government retains a nonexclusive, paid-up, irrevocable, world-wide license to publish or reproduce the published form of this manuscript, or allow others to do so, for United States Government purposes.
NPIC&HMIT 2010, November 7-11,2010, Las Vegas, Nevada
1445