398
JOURNAL OF DISPLAY TECHNOLOGY, VOL. 4, NO. 4, DECEMBER 2008
Comparing Signal Detection Between Novel High-Luminance HDR and Standard Medical LCD Displays M. Dylan Tisdall, Gerwin Damberg, Paul Wighton, Nhi Nguyen, Yan Tan, M. Stella Atkins, Hiroe Li, and Helge Seetzen
Abstract—DICOM specifies that digital data values should be linearly mapped to just-noticable differences (JNDs) in luminance. Increasing the number of JNDs available requires increasing the display’s dynamic range. However, operating over too wide a range may cause human observers to miss contrast in dark regions due to adaptation to bright areas or, alternatively, miss edges in bright regions due to scattering in the eye. Dolby Inc.’s high dynamic range (HDR) LCD display has a maximum luminance over 2000 cd/m2 ; bright enough to produce significant in-eye scatter. The display combines a spatially variable backlight producing a low-resolution 8-bit “backlight image” with a high-resolution 8-bit LCD panel, approximating a 16-bit greyscale display. Alternatively, by holding the backlight constant at 800 cd/m2 , a standard medical LCD display can be simulated. We used two-alternative forced choice (2AFC) signal-detection experiments to quantify display quality. We explored whether the full-power HDR display’s optical characteristics (scattering and low resolution backlight) have a negative effect on signal detection in medical images compared with a standard LCD. We used 8-bit test images derived from high-field MRI data combined with synthetic targets and synthetic Rician noise. We suggest signal detection performance with the HDR display is comparable to a standard medical LCD. Index Terms—High dynamic range, high luminicense, medical studies, user studies.
I. INTRODUCTION
G
REYSCALE medical image displays rely on the observer’s sensitivity to spatially varying luminance in order to communicate a 2D array of digital values. Given an liquid crystal display (LCD) display that can produce a finite set of greyscale luminance values, the DICOM standard formalizes a function for selecting the appropriate luminance for each pixel to best represent some digital value in a medical image [1]. The core principle behind the choices suggested by the DICOM standard is that equal differences in digital values should be represented by equal perceptual differences. Thus, it proposes units of just-noticeable differences (JNDs) as the perceptual equivalent of the digital data’s units. A mapping between luminance and JNDs is established in the DICOM Manuscript received February 01, 2008; revised March 28, 2008. First published August 15, 2008; current version published November 19, 2008. M. D. Tisdall, P. Wighton, N. Nguyen, Y. Tan, and M. S. Atkins are with the School of Computing Science, Simon Fraser University, Burnaby, BC V5A 1S6, Canada (e-mail:
[email protected]). G. Damberg, H. Li, and H. Seetzen are with Dolby Inc., Vancouver, BC V5M 4X7, Canada. Digital Object Identifier 10.1109/JDT.2008.2001198
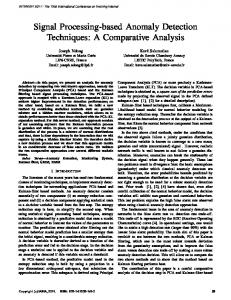
standard based on previous human experiments. Using this relationship, one can convert digital values into luminances by ensuring that equal steps in the digital domain are mapped to equal steps in the JND space and determining the relevant luminances from the desired JND values. In practice, LCD-based displays can achieve a finite range of luminances. The ratio of the maximum to minimum luminances is generally referred to as the display’s contrast ratio. Further they have limited discrete luminance values inside this range that are available for display. The base-2 logarithm of the number of discrete luminance settings is called the display’s greyscale bit depth. The difference between minimum and maximum luminance provides an upper limit on the number of JNDs that a human could perceive on a perfectly controllable display. The bit depth determines how well we can approximate this ideal display. Previous work has suggested that, for regular medical displays with maximum and minimum luminances of approximately 900 cd/m and 1.5 cd/m respectively, there is little value in producing monitors with more then 12-bit greyscale bit depth [2]. Dolby has demonstrated a new high-dynamic range (HDR) LCD-based technology that allows the minimum luminance of the display to be zero, producing an effectively infinite contrast ratio. Medical LCD displays normally use a uniform backlight that provides approximately equal illumination to the back of the LCD panel at every pixel. The LCD panel is then used to filter this light. However, current LCD technology cannot block all the light, even when the LCD is set to full black. Thus, on a normal LCD the minimum luminance level is some value greater than zero. The new Dolby display technology uses a spatially variable backlight to illuminate a standard LCD panel. The spatial variability of the backlight allows it be turned off completely in regions where the image should be black, making for regions with effectively zero luminance. Furthermore, the Dolby technology relies on high-power light-emitting diodes (LEDs) for the backlight, making the maximum luminance of displays in the thousands of cd/m . However, the Dolby HDR LCD also introduces some compromises compared to a standard LCD. The spatially variable backlight system cannot be controlled individually at each pixel in the image. Instead, a low-resolution array of white backlight LEDs is used and the illumination behind the LCD at any location is the sum of the contributions from all the LEDs whose point spread functions (PSFs) extend to that location (see Fig. 1). Thus, while the backlight LEDs each individually
1551-319X/$25.00 © 2008 IEEE Authorized licensed use limited to: IEEE Xplore. Downloaded on February 2, 2009 at 20:04 from IEEE Xplore. Restrictions apply.
TISDALL et al.: COMPARING NOVEL HIGH-LUMINANCE HDR AND STANDARD MEDICAL LCD DISPLAYS
Fig. 1. Dolby HDR display uses a standard LCD panel as a front plane and a grid of LEDs to produce a spatially variable backlight. Each LED in the backlight illuminates a region of the LCD panel defined by the LED elements’ point spread functions. When operating as an HDR display, the backlight is varied to increase the dynamic range of the display. For example, since the bottom region of the example image is desired to be black, the LEDs behind this region would be turned off to make the region truly black. Since there are fewer LEDs than LCD pixels, in regions where there are more detail (like the top of the example image), a low-resolution version of the data is projected from the LEDs and then high-frequency spatial variations are added again via the LCD panel.
have 8-bits of luminance depth and the LCD panel also has 8-bit of greyscale depth, the resulting display does not have 16 bit of independent greyscale depth at every pixel. Instead, we have an approximation to a 16-bit display where neighboring pixels’ luminance values are coarsely correlated. This correlation is the result of the PSFs of the LEDs, where lighting one pixel necessarily requires lighting the neighboring pixels as well. However, for pixels that are sufficiently distant that the PSFs of their respective backlight LEDs do not overlap, we have complete decoupling and can independently vary these pixels from true black (backlight off) to full brightness (backlight on full-power) as illustrated in Fig. 1. The low-resolution backlight is partially justified by the imperfect nature of the human optical system. In particular, light scattering in the media of the eye causes bright regions to be blurred [3]. This is commonly observed as a “blooming” or “halo” effect where a bright region with a sharp edge abutting a dark region will have a halo that extends over the edge. In practice, this scattering-induced halo will be larger than the PSF of the LEDs, meaning that the approximation artifacts from the Dolby technology are less than the dominant source of error in the human eye [4]. However, since this blooming effect can obscure fine details and edges, it may be that there is still an effective upper limit on the brightness that is useful in medical displays. We were interested in determining whether the artifacts introduced by the low-resolution Dolby backlight, combined with the potential effect of scattered light, would impact the use of these screens in a medical context. To this end, we have conducted an experiment based on a two-alternative forced-choice (2AFC) signal known exactly (SKE) signal-detection task. To control the effects of the variable backlight and scattered light, we tested the Dolby display in two configurations. In the first, we made full use of the brightness and spatial variation available
399
from the backlight. In the second configuration we set the backlight to be spatially uniform and produce a maximum display luminance of 800 cd/m ; approximately the same luminance as a high-end medical display. We then compared task performance between these two conditions. While the spatially variable backlight mode represents a novel form of medical display, when in uniform backlight mode the Dolby display becomes a standard LCD display. The Dolby prototype screen we used employed an off-the-shelf LCD display panel; the only novel aspect of the display is the backlight. While most uniformly backlit LCD displays rely on a small light source and a diffuser to ensure uniform illumination, the Dolby display in uniform backlight mode simply turns on all the backlight LEDs to the same intensity, uniformly lighting the rear of the panel due to the overlapping PSFs of the LEDs. By choosing a uniform LED intensity that is comparable to current medical displays, we can effectively simulate a medical-grade LCD display. We refer to our uniformly backlit LCD as a simulation of a medical LCD display because our prototype’s resolution, while suitable for our task, was not medical grade and we do not mean to imply that our Dolby prototype has met the quality standards demanded of true medical displays. However, given the focus of our experiments, we feel this was an adequate exemplar of a normal LCD. Additionally, the ability to switch the same display from spatially variable backlight to uniform backlight mode allowed us to control all the other possible confounding effects that might occur if we compared two different pieces of hardware. With our setup we use the same LCD panel and other physical aspects of the display are constant across conditions, ensuring that we really are able to test the effect of the increased brightness and spatially variable backlight. We will interchangeably use the term “displays” (“standard LCD” or “HDR LCD”) or “modes” (“uniform backlight” or “spatially variable backlight,” respectively) when discussing the setup and results of our experiments. The display was not DICOM-calibrated in either backlight condition. We instead used the native calibration functions of the display. While the Dolby HDR system has ramifications in terms of uniformity and calibration [5], and thus the useful bit depth available if the display were DICOM calibrated, our goal in these experiments was to explore the effects of veiling luminance and the Dolby HDR technology on the detection of fine details. Due to this focus, we felt that using the native calibration of the displays was acceptable for our task. Despite our choice of experimental calibration, our experiment is motivated by the DICOM calibration function in that, if we are to display more perceivable shades of grey simultaneously on a medical display, we will need greater dynamic range and higher bit-depth than currently available in medical LCD hardware. Our interest in the present experiment is whether the prototype Dolby HDR screen we used exceeded an upper limit on the dynamic range that can be usefully employed on a Dolby HDR display for a realistic signal detection task. Such a limit, either resulting from the optics of the eye or the approximations inherent in the Dolby HDR technology, would then reduce the advantage in simultaneous grey shades that a DICOM-calibrated HDR LCD display would have over a traditional DICOM-calibrated LCD.
Authorized licensed use limited to: IEEE Xplore. Downloaded on February 2, 2009 at 20:04 from IEEE Xplore. Restrictions apply.
400
JOURNAL OF DISPLAY TECHNOLOGY, VOL. 4, NO. 4, DECEMBER 2008
In Section II we will describe the process used to produce our stimulus images, provide a description of the 2AFC task that our subjects performed, and provide more details about the display and how we used it. In Section III we present and analyze the results of our experiments, and discuss their implications for use of the Dolby display. Finally, in Section IV we present our conclusions.
at location . We can then write the final target-present image with simulated thermal noise as (2) and target-absent images are simulated with (3)
II. METHODS AND MATERIALS A. Stimulus Images Our stimulus images were generated using a similar methodology to previous work on the evaluation of MRI reconstruction [6]. Our goal in using anatomical MRI backgrounds was not to simulate a realistic pathology, but instead to provide a realistic background that stimulates the contrast sensitivity of the observer in the same way a real medical image would. This provides a visual distraction effect similar to that of real medical images. We began with several 16-bit magnitude-reconstructed 3D inversion recovery head MRI volumes of healthy volunteers Philips Gyroscan Intera scanner. The volumes acquired on a were sliced along the three major axes to produce a corpus of full-head images. From the full-size images, 128 128 pixel images were constructed along the three major axes by selecting 128 128 pixel regions randomly from the full-size images. Pixel values were then normalized to the range (0,1) to ensure consistency between images. To verify that our small images contained anatomy in the central part of the image, we computed the average intensity in the central 64 64 pixel sub image and ensured it was above 50% of the maximum intensity—well above the value that would be expected for pure noise. Images that were over the threshold were kept as backgrounds. Our backgrounds were randomly divided into target-present and target-absent sets. Images in the target-present set were summed with an anti-aliased circular target signal defined by the function if if otherwise (1) where is a 2D coordinate in image space, is the amplitude is of the target signal, is the index of the image center, the Euclidean norm, and is the radius of the feature. Location coordinates and and radii are specified in pixels. We set which was approximately equivalent to a 6 mm feature in the anatomy. To simulate Rician-distributed thermal MRI noise [7] in our target-present and target-absent images, we produced two for each random samples from a Gaussian distribution be the intensity pixel in each of our synthetic images. Let of a given anatomical background image at location , be the intensity of the target signal at location , and and be the two samples from the Gaussian distribution
When adding signals and noise, we subdivided our images into four conditions representing four different target contrast-to-noise ratios (CNRs). These four CNRs define four different levels of contrast between the target and whatever anatomical background it was summed with, relative to the noise power. Using the variables specified above, , these four conditions were , , and which give target CNRs of approx, , , imately . Naturally, we expect that targets with lower target CNRs will be harder to detect as they will blend in more with the background. It is important to distinguish these CNRs from the pixel SNRs of the targets in the final images. The target pixel SNRs were usually far higher than indicated by these target CNR values because the target’s intensity was summed with the intensity of the underlying anatomical background. Of course, while summing the target with a bright background will increase pixel SNR at these locations, we do not expect that this will improve detectability. As noted before, the background is expected to be a distracter. However, we highlight that the final pixel SNR is substantially higher than the target CNR in order to assure those familiar with peak SNRs in MRI data that we were not producing synthetic data with unrealistically low SNRs. Finally, we note that there is some real thermal noise already . However, because of present in our background images the quality of the scans used, this real thermal noise’s variance is far less than that of our simulated thermal noise, and thus we do not expect it had any impact on the final results. Once the signal and noise was added, the entire image corpus was normalized so that the darkest pixel over all the images was set to 0 and the brightest pixel over all the images was set to 255. Thus, most images spanned some slightly smaller range of values. We then stored the final images as 8-bit values. An example of one anatomical background in all four target-present conditions is shown in Fig. 2. Reducing our data to 8-bit values could be seen as missing the point of using a high-contrast display. Having increased the luminance range that the display can provide, we now have more JNDs available and can thus afford to show more than 8 bits of greyscale information simultaneously. Our reason for choosing 8-bit information as the final digital output for our experiment stems from the fact that, at this point, we are interested only in testing the effects of the Dolby display’s optical design and brightness. Thus, by using 8-bit data we can ensure that our images can be presented without further data reduction in both of our display modes, which are described in a later section.
Authorized licensed use limited to: IEEE Xplore. Downloaded on February 2, 2009 at 20:04 from IEEE Xplore. Restrictions apply.
TISDALL et al.: COMPARING NOVEL HIGH-LUMINANCE HDR AND STANDARD MEDICAL LCD DISPLAYS
Fig. 2. Example of one anatomical background in all four target-present conditions. The target signal is the small circle visible just under the cortical folds, in the center of the images. Note that, unlike what is depicted in this figure, in our experiment any given background was used in only one target-CNR/noisepower condition.
B. 2AFC Task Signal-detection tasks have a long history in measuring the quality of imaging systems, including the evaluation of medical imaging modalities and image reconstruction algorithms [6], [8]–[10]. Our particular experiment structure — the 2AFC experiment — has also been used previously in the evaluation of medical LCD displays [11]. Our seventeen volunteers were all non-radiologists with no previous medical image reading experience. All subjects had fully corrected vision and were graduate students or university graduates. The age range (early-20s to mid-40s) was well below the age significance threshold in the CIE General Disability Glare Equation [3] indicating that the age variation should not be a significant factor in the quantity of scatter in their eye, and thus their perception of the “blooming” effect. Similarly, eye color of the subjects was not an important factor as the experiment was setup to have viewing angles smaller than the CIE threshold of 30 deg at which eye color becomes significant [3]. The entire experiment was conducted in a fully darkened room, with the display being the only source of illumination. Subjects were seated on-axis both vertically and horizontally with the display and approximately 1.4 m from the screen—approximately three times the height of the display away from the screen as this is considered the optimal distance for HDTV viewing and our prototype screen was based on a restricted region of an HDTV screen. The display was shrouded in heavy black cloth to cover reflected light from the frame and ensure that participants saw only the portion of the screen containing the interface. Inside of this region, two images were displayed in a vertical orientation, with a gap between them in which we displayed the target feature for the trial. Images and target features were scaled by a factor of three to produce a 384 384-pixel image and a target with a radius of 10 pixels on the actual display. Each image
401
measured approximately 16.4 cm across and subtended approximately 6.8 in the observers’ visual field. The target feature in the center region was displayed on a black background with amplitude defined by , and thus varied from trial to trial depending on the condition being presented. The target feature’s displayed diameter was approximately 9 mm and subtended 0.37 in the observers’ visual field. This display method allowed users to see the same contrast between the target and black background as they would see between the target and anatomy in the candidate images. Note, however, that this means the amplitude of the target was substantially lower in the center region than in the candidate images, since the target’s amplitude in the target-present image would depend on the intensity of the underlying anatomy. We felt that presenting the target’s contrast was more important than its absolute intensity, since the intensity would depend substantially on which image it was summed with, while the target CNR, and thus contrast, was the experimental variable being held constant across all trials in each condition. In each trial the two images were chosen from the same target amplitude and noise power condition so that one was target-present and the other target-absent. Due to the large number of images produced from our subsampling described in Section II-A, and the fact that our images were being chosen without replacement, we treated this process as independent sampling from paired target-present and target-absent distributions, as is common in 2AFC experiments [6], [11]–[13]. In our experiment, the distributions in the pair were defined by the target amplitude, the noise power, and the backlight mode being chosen, giving a total of 8 distribution-pairs (4 target-CNR/noise-power combinations and two display modes). Note that this means different images were used in each of the target-CNR/noise-power conditions and so every trial on a given display was independently generated and observers saw 4 (conditions) 32 (trials) 2 (target-present/-absent) different backgrounds on each display. Subjects were told that, if the target was present in an image, the circular target would sum with the background to make the region brighter. They were then directed to compare both images with the target feature displayed in the center of the screen and select their best guess for which of the two images was target-present. To ensure that there was no confusion about the location of the target, we superimposed cross hairs on the images. These cross hairs could be toggled on and off by the users so that visual distraction could be minimized when desired. The interface is illustrated in Fig. 3. Since the users were shown both the target and where it would be located if it were added, this is a 2AFC SKE task. Users were given 10 minutes of training in the darkened room in order to allow for eye adaptation to the lighting conditions. Users were then shown the display configured either in uniform or spatially variable backlight mode (odd-numbered subjects saw the spatially varying backlit display first, even-numbered subjects were initially presented with the uniformly backlit display). The subjects were asked to perform the task for 128 image pairs (32 images in each of the four target-CNR/noise-power conditions). The display was then toggled into the opposite mode and the same 128 image pairs
Authorized licensed use limited to: IEEE Xplore. Downloaded on February 2, 2009 at 20:04 from IEEE Xplore. Restrictions apply.
402
JOURNAL OF DISPLAY TECHNOLOGY, VOL. 4, NO. 4, DECEMBER 2008
2
Fig. 3. Example of the 540 1080 pixel user interface. In this image cross hairs have been turned on to reduce localization errors. The target feature is located in the top image in the center of the cross hairs.
were repeated. In each of the two display conditions the order of the image pairs was randomized for every subject. C. Dolby Display The display we used in our experiment was a prototype Dolby display that was shrouded to produce a portrait-shaped visible region with a resolution of 540 1080 pixels. The display consisted of an 8-bit color LCD panel (Chi Mei V370H1-L01) backlit by an array of 377 white LEDs, each with 8-bits of luminance control. The LEDs were laid out in a hexagonal grid such that each of the images in the experimental interface were illuminated by approximately 110 LEDs, with the remaining 157 LEDs located such that they illuminated the space between the images where the target was displayed or around the periphery of the interface. Using this setup we can produce a normal, uniformly backlit LCD-based display by simply turning all the LEDs on to the same drive level and using only the LCD panel to modulate the brightness of the display at each pixel. In this case contrast is limited to that produced by LCD panel alone. However, to make full use of the Dolby display, we need to vary the drive levels of the LEDs to produce a spatially varying backlight. Every LED in the backlight, and each pixel in the LCD have 8 bits of dynamic range available. However, as discussed in our description of the simulated images, our input data was encoded in 8-bits as well. We have used the in-house algorithms developed by Dolby
to calculate the desired 8-bit LED and LCD drive levels from the 8-bit input image [14]. The basic principle though, is that the LEDs display a low-frequency image derived from the 8-bit input and the LCD is used to display a high-frequency correction to the LEDs [15]. This idea is illustrated in Fig. 4. Comparisons of the actual luminance output of the display and the observed luminance are discussed with figures in [4]. In our experiments, we were interested in comparing the Dolby HDR LCD display to a standard medical LCD display. As noted above, if we simply set the backlight LCD grid to all be the same intensity, our display is then the same as any other regular LCD. In the uniformly backlit mode we no longer need to calculate an LED drive image from the data, since the LEDs are fixed. Similarly, we no longer need to use the LCD panel to correct for errors caused by the low resolution backlight, but instead send the original 8-bit image to the LCD, just as we would with any other LCD display. We can then simulate a medical LCD display by simply choosing an LED backlight intensity comparable to that of a medical display. Thus our experiments compared the same LCD panel being lit two different ways: the spatially variable and high-luminance Dolby HDR backlighting representing the novel condition, and a standard uniform backlight representing the current LCD display configurations used in medicine. Although this uniform-backlight configuration is a standard LCD display (albeit one with an overbuilt backlight), we refer to it as a simulation of a medical display. As noted before, we use this terminology because we do not mean to imply that our LCD panel would meet the standards normally expected of the ones used in a medical LCD display. However, for the purposes of our experiment, with our emphasis primarily on the effects of variable and high-luminance backlighting, we believe our LCD panel did not reduce the applicability of our results. To measure the luminance of the display in each of the conditions we used a region the size of one of the images used in our 2AFC task. We recorded the luminance at the center of the image region as the digital drive level was increased in steps of 5. The choice of using a region of this size instead of varying the drive level of the whole screen is based on the nature of the backlight employed. The spatially variable backlight system is affected both by a limit on the power the system can safely draw and the fact that the brightest possible luminance value the screen can produce results from summing the overlapping light emissions of neighboring LEDs. Given the nature of the system, we felt the most realistic description of display luminance for our task was to vary an “image” of the same size as our data from minimum digital drive level to maximum. The results of these measurements are plotted in Fig. 5. As seen in Fig. 5, the maximum luminance of the display when in the uniform backlight mode was approximately the same as in a medical-grade LCD display. Luminance varied from 780 cd/m to 0.706 cd/m , giving a contrast ratio of approximately 1100:1. Although the display had dynamic range similar to a medical grade LCD display, our prototype display was lacking substantially in resolution. However, since we were displaying only 128 128-pixel images, the resolution constraint did not affect our simulation of a uniformly backlit medical LCD display.
Authorized licensed use limited to: IEEE Xplore. Downloaded on February 2, 2009 at 20:04 from IEEE Xplore. Restrictions apply.
TISDALL et al.: COMPARING NOVEL HIGH-LUMINANCE HDR AND STANDARD MEDICAL LCD DISPLAYS
403
Fig. 4. Three examples of the LCD drive levels and LED backlight luminance illustrating the interaction between these two layers when using the Dolby HDR variable backlight algorithm and hardware. The top row shows the 540 540 pixel, 8-bit input images that we wish to display — in uniform backlight mode this 8-bit data is simply sent directly as the LCD drive levels and the LED backlight luminance is uniform. The left image contains a 384 384 pixel solid white square, the center image is an example of our 2AFC target on a black background, the right image is a target-present example from our experimental set. The bottom row plots 8-bit input values (solid grey line), 8-bit LCD drive levels in variable backlight mode (dashed line), and LED backlight luminance in variable backlight mode (solid black line) along the centermost row in each of the images, running through the center of the target feature. 8-bit input images and 8-bit LCD drive values are plotted from 0–255, as shown on the left. LED backlight luminance profiles were computed based on a model using the known PSF of the LEDs and normalized so that the peak of the PSF for a single LED is 1. Since the PSFs overlap for neighboring LEDs, the total backlight luminance can be higher than one, and thus these profiles are plotted from 0–2.5, as shown on the right. In our experiments, the peak of the PSF (1 on the presented scale) was approximately equal to luminance of 950 cd/m when in variable backlight mode. Note that in the center column, because there is not an LED backlight directly under the target feature, the LCD must compensate for the PSF of the nearest LED to provide equal luminance output across the target.
2
Fig. 5. Luminance of the display in uniform (solid) and spatially variable (dashed) backlight modes for each digital drive level.
In comparison to the uniform backlight mode, the spatially variable backlight mode allows effectively infinite contrast, with luminance varying from 0 to a maximum of 2140 cd/m . In this respect, the performance of the Dolby display with spatially varying backlight resembles the dynamic range associated with film displayed on light boxes.
2
Despite the similarities between the Dolby display and film (refer to Fig. 5) there is a significant deviation from the performance of film when the Dolby display attempts to show highcontrast edges. Edges going from full white to full black in the digital data cannot be physically produced by the display. To understand this, note that essentially the same amount of backlight is shone on two neighboring pixels as the PSFs of the LEDs are far wider than two pixels. Thus, in order to go from full white to full black in the display would require the LCD to block all the light from the backlight. Of course, if this were feasible there would be no need for spatially variable backlights in the first place, and so we might suspect that the Dolby display is not useful for medical images that contain many edges. However, as we noted previously, a great deal of scattering occurs in the eye when observing bright objects [3]. This scattering causes neighboring regions to appear brighter than they actually are, regardless of the light emitted by the display in the dark regions. This effect is known under many names; blooming, veiling luminance, and disability glare are the more common. Based on calculations of this effect, the Dolby display is setup such that the scattering in the eye will produce a “halo” around bright regions that is larger than the mismatch caused by the PSF of the LED backlights [4]. Thus, the display’s imperfect ability to represent high-contrast edges can be disregarded as the errors in the display are usually subsumed by the errors in the observer’s eye. In fact, we expect that the same scatter effect would occur for observers of film on light boxes as well. The range of lu-
Authorized licensed use limited to: IEEE Xplore. Downloaded on February 2, 2009 at 20:04 from IEEE Xplore. Restrictions apply.
404
JOURNAL OF DISPLAY TECHNOLOGY, VOL. 4, NO. 4, DECEMBER 2008
Fig. 6. Tufte-style box and whiskers plots of the first, second, and third quartiles and the minimum and maximum outliers of subject percentage correct in each of the 8 possible conditions (4 combinations of target and noise power, and two choices of backlight mode). The plot is divided into two halves. The left half shows results for the Dolby spatially variable backlight. The right half shows results for the uniform backlight. Each shape represents the median of the percentage correct in one target/noise power configuration. The innermost point of the vertical bars extending from the shape represent the first and third quartiles of the percentage correct, over all the subjects. The outermost point of the vertical bars represent the minimum or maximum outlier.
minance available on mammography light boxes provides approximately four orders of dynamic range [16], which suggests that sharp edges on these displays should be equally obscured by scatter in the eye. However, while these effects have apparently not been a substantial detriment to film reading, we felt it was possible that the combined effects of in-eye scatter and approximation artifacts induced by the prototype Dolby display would be different and detrimental to signal detection, necessitating our present evaluation. Another deviation from normal medical displays in our experiments involved the function from digital drive levels to luminance, which we refer to as the luminance calibration function. In our experiments we decided to use the native relationship between digital drive and luminance, instead of the more standard DICOM luminance calibration function. One reason for this choice is that it is unclear how a display using the Dolby system can be made to comply with the DICOM standard, given that the available range of luminance available at any pixel is dependent on the luminance of the neighboring pixels. In fact, this problem holds for any attempt to calibrate the display. If we used a luminance calibration function that linearized the measured values when we used the full-sized square image, we would almost certainly end up with highly nonlinear response in regions of medical images. As we were interested mostly in the veiling luminance due to scatter and the approximations being made by the Dolby variable backlight system, we felt that the luminance calibration function was not likely to be a significant contributor to error between displays as long as it was of a reasonable shape. Ideally we would pick some calibration standard (e.g., luminance-linear, DICOM) and ensure both backlight modes were consistently calibrated. However, since it was unclear how to usefully calibrate the variable backlight mode, we could not setup such equivalent environments. Instead, we left the display with its default luminance calibration function and, having measured the display and viewed many images on it, were satisfied that it provided a usable display for our experiments. Regardless, if we found significant veiling effects in the variable-backlight mode, we could be assured these effects would occur if we were to approximately DICOM calibrate the monitor, as
they result from the maximum luminance being displayed near darker regions, which would still occur under any reasonable calibration. III. RESULTS AND DISCUSSION We have plotted the first, second, and third quartiles of the subjects’ percentage correct choices in Fig. 6. While Fig. 6 is useful for illustrating the variability across readers in our experiment, we were most interested in determining whether the two display systems were equivalent for our task. In the remainder of this section we present our analysis of these results using the methods presented by Gallas et al. [17] to compute the necessary values for paired -tests of our hypotheses. A. Means and Variances of Percentage Correct As a first step towards this goal we computed the mean percentage correct for each of the two displays and the mean difference in percentage correct between the two displays in each of the four target/noise power conditions. Since our study uses a fully crossed design where all readers saw every case, we can safely compute our average percentage correct across all readers and cases in a given display and condition as [17] (4) where is a binary-valued function with 1 for a correct choice and 0 for an incorrect choice when the th subject looked at the th image selected from the set of images with target/noise to accentuate the power condition using display . We use fact that the th image in one target/noise power condition is not the same as the th image in the other three conditions. Inside of a given condition images are i.i.d. while between conditions images are merely assumed to be independent. We use the notato indicate that we are taking the mean over tion and with and held fixed. The mean difference in percentage correct between the two displays is then very similar
Authorized licensed use limited to: IEEE Xplore. Downloaded on February 2, 2009 at 20:04 from IEEE Xplore. Restrictions apply.
(5)
TISDALL et al.: COMPARING NOVEL HIGH-LUMINANCE HDR AND STANDARD MEDICAL LCD DISPLAYS
405
TABLE I MEAN PERCENTAGE CORRECT VALUES
TABLE II VARIANCE OF PERCENTAGE CORRECT VALUES
where indicates the spatially variable backlight and indicates the uniform backlight, which are treated as constants and thus not varied in taking the means. While we are interested in the performance of the human observers when viewing the displays in each of the four targetCNR/noise-power conditions, we are also interested in observer performance aggregated over all the conditions. Following the previous notation, the mean performance viewing display is then
backlit display and is the spatially variable backlit display (or vice versa) we have the covariance of the two displays. In computing these covariance estimates we use unbiased estimators of the various means, following the example of Gallas et al. [17]:
(13)
(6) (14)
and the mean difference between the displays is (7) The values we computed for these variables from our experimental data are shown in Table I. We also need to compute the variances of these values. The and , covariance of the percentage correct of displays with the target-CNR/noise-power condition held constant at is given by [17] and [18], as shown in (8) at the bottom of the page, where we have slightly modified the notation of Gallas et al. and define
(15)
(9)
While we are interested in comparing the performance of the two displays in the individual target CNR/noise power conditions, we are also interested in whether the two displays were equivalent over the aggregate of all the conditions. The mean response aggregated across all four conditions is just the mean of the four individual conditions’ mean responses. In Appendix, we demonstrate how estimators of the form suggested by Gallas can be used to produce variance and covariance estimates for the aggregated data of all conditions. The results of performing the variance and covariance computations on our experimental data, both in each condition individually and on the aggregate of all conditions, are shown in Table II.
(10) (11) (12) with being the number of subjects and being the number of images displayed in one of the four target/noise power condiand . When we have tions. In our data the variance of a single display while when is the uniformly
(16)
(8)
Authorized licensed use limited to: IEEE Xplore. Downloaded on February 2, 2009 at 20:04 from IEEE Xplore. Restrictions apply.
406
JOURNAL OF DISPLAY TECHNOLOGY, VOL. 4, NO. 4, DECEMBER 2008
TABLE III 95% CONFIDENCE INTERVALS OF MEAN DIFFERENCE PERCENTAGE CORRECT, AND PROBABILITY OF OBSERVED RESULTS UNDER NULL HYPOTHESIS
TABLE IV 10% EQUIVALENCE BOUNDS, ZERO-CENTERED 95% CONFIDENCE INTERVALS OF MEAN DIFFERENCE PERCENTAGE CORRECT VALUES, AND PROBABILITY OF OBSERVED RESULTS UNDER NULL HYPOTHESES
t-VALUES,
B. Hypothesis Tests In each of the four target/noise conditions we are interested in testing two hypotheses. First, we would like to test whether the simulated medical LCD display (uniform backlight mode) and the Dolby HDR LCD display (spatially variable backlight mode) are significantly different. Secondly, we would like to test if they are significantly equivalent. The structure of our experiments naturally admits the use of -tests under the assumption that the mean differences between displays are normally distributed in each target/noise condition. The difference test will use the standard paired -test for difference of means while the equivalence of means test will be made using the two-one-sided-test (TOST) on the means. 1) Test of Difference: We first test for difference in the means of the percentage correct between the two display modes. Since we do not know a priori that one backlight mode will be superior to the other, we use mean-centered confidence intervals for each target-CNR/noise-power condition computed via
(17) where is the quantile of Student’s distribution with degrees of freedom and is the desired confidence level of the interval. To compute the confidence interval for the display difference aggregated over all the conditions, we replace with and the condition-specific mean and variance estimates with the condition-aggregated estimates described above. If we cannot reject the null hypothesis that the two means are identical at . If the interval does not overlap zero, then we can reject the null hypothesis at . Alternatively we can compute the two-sided -values from the -value of the measured data and the distribution and compare them with . The calculated value of the statistic, the 95% confidence interval, and the equivalent -values calculated from the measurements in each condition and in the aggregate of all conditions are shown in Table III. In cases where the mean-centered confidence intervals enclose zero (the first, second, and fourth target-CNR/noise-power conditions), we cannot reject the null hypothesis, and thus we do not have statistically significant difference at . We
do have a statistically significant difference between the displays in the third condition and in the aggregate of all conditions. However, these differences, while statistically significant, may not be practically significant, which leads us to our tests of equivalence. 2) Test of Equivalence: Although we have shown that there are some statistically significant differences, we must now test if our displays are statistically equivalent. As in all equivalance tests, the TOST suggests that we define some bound on the difference between displays inside of which we will declare them equal for practical purposes. Standard approaches to choosing this include appeals to domain-specific knowledge in the field being tested or accepting an error of less than 10% (some authors suggest 20%) of the mean of the reference condition (in our case the uniform backlight) [19], [20]. Since we have no domain-specific knowledge for this test that allows us to define meaningful bounds, we will compute the 10% bounds for the four conditions from the uniform backlight mean in Table I, as shown in Table IV. Using the TOST procedure, we conclude that the means are statistically significantly equivalent if the entire confidence interval falls within the stated equivalence bounds [21]. To perform this test, we use zero-centered confidence intervals in order to minimize the probability of erroneously accepting the null hypothesis when it is actually false (i.e., accepting that the displays are not equivalent when in fact they are) [21]. For the distribution, zero-centered confidence intervals are constructed via (18) where and are chosen so that the integral of Students’ distribution from to equals where is the desired confidence level and is the quantile of Student’s distribution with degrees of freedom. However, unlike in the mean-centered intervals above, we chose different and values such that the resulting confidence interval bounds are symmetric around 0 (i.e., ). As with the mean-centered intervals, zero-centered confidence intervals for the aggregate of all conditions are produced by replacing the degrees of freedom in the distribution with and the condition-specific mean and variance estimates with their aggregate equivalents. The zero-centered 95% confidence intervals’ extrema are given in Table IV along with the -value of the TOST
Authorized licensed use limited to: IEEE Xplore. Downloaded on February 2, 2009 at 20:04 from IEEE Xplore. Restrictions apply.
TISDALL et al.: COMPARING NOVEL HIGH-LUMINANCE HDR AND STANDARD MEDICAL LCD DISPLAYS
equivalence test. Comparing the defined equivalence bounds (first column) with the calculated confidence intervals (second column) in Table IV, we see that we have statistically significant equivalence in the second and fourth target-CNR/noise-power conditions as well as in the aggregate case. C. Discussion Based on the means and variances we computed, our -tests have demonstrated detectable differences between the displays in one of the target-CNR/noise-power conditions and in the aggregate. We have also been able to show statistically significant equivalence in two of our target-CNR/noise-power conditions and in the aggregate of all conditions, using the 10% bound that is normally considered reasonable in other disciplines. The equivalence of the displays in the highest target CNR condition is not surprising, since our subjects were able to choose the target-present image correctly in almost every trial. However, the equivalence in the aggregate of all conditions is important as this is the test that most clearly addresses our original question: is the Dolby HDR LCD display equivalent to a standard LCD for viewing images? The aggregate test includes measurements for images whose detection difficulty ranged from very hard to very easy, and, considering this whole range, the two displays were significantly equivalent according to our test. We note that it is possible that with the addition of more subjects and/or cases per subject we might also find significant differences in more of the conditions. However, this does not negate our finding of significant equivalence. Statistically significant differences can co-exist with statistically significant equivalence because our definition of equivalence relies on a bound on differences. As long as we can be significantly confident that our differences lie within this bound, then we are asserting that whatever small differences exist between the displays are not large enough to have a practical effect.
407
boxes, that the veiling luminance caused by scatter in the observers’ eyes would not be a substantial impediment to signal detection. Additionally, our results indicate that the use of the approximations introduced by the low-resolution LED backlight display are not detrimental to signal detection in this context. More generally, we suggest that the displays with the Dolby spatially variable backlight system are useful platforms for further study of high-contrast displays in medical imaging. However, the development of a method for DICOM calibration will be an essential prerequisite to performing further validation studies using real medical data. We also suggest that further experiments are needed to verify that veiling luminance is not a substantial impediment to detection. Despite the long-standing use of film light boxes with dynamic range sufficient to induce veiling luminance via scatter in the eye, we are still concerned that this effect may play a role in hiding small, low-contrast lesions. To thoroughly test this hypothesis, detection experiments like this one could be run with the low-contrast target being located in regions calculated to be obscured by veiling glare based on a model of the display and the veiling luminance effect [3]. APPENDIX VARIANCE OF AGGREGATED CONDITION DATA To produce an estimate of the covariance between displays and aggregated over all target CNR/noise power conditions, we begin by noting that (19) and
IV. CONCLUSION We have presented a 2AFC SKE experiment for the exploration of the Dolby spatially variable backlight technology in medical LCD displays. We compared the Dolby HDR LCD display to the same LCD panel illuminated as it would be in a normal medical LCD display. The use of real MRI data as backgrounds ensured that our experiment used images with realistic contrast and structure. Our targets and noise power were chosen to cover the full range of difficulties from forcing users to essentially guess to making the task almost obvious. By using the same display with a spatially uniform backlight as a simulation of a medical-grade LCD we have kept the hardware-related variables consistent and minimized the number of possible confounds in our experiment’s design. The results of our experiment suggest that the detection of small, low-contrast features in complicated, high-contrast backgrounds on LCD displays using the high-luminance, spatially varying backlight is equivalent to the same task on a lower-luminance, uniformly backlit LCD. This result confirms our suspicion, based on the years of clinical experience with film light
(20) We expand the second moment and square of the mean, noting is i.i.d. for all and when and are fixed, to that produce an equation similar to that in Gallas et al. [17], as shown in (21) at the top of the next page, and
(22) If we substitute these two equations back into (19), we can further simplify, using the previous definition of to produce (23), shown at the top of the next page. We have used our notation to accentuate the important point that involves the same th
Authorized licensed use limited to: IEEE Xplore. Downloaded on February 2, 2009 at 20:04 from IEEE Xplore. Restrictions apply.
408
JOURNAL OF DISPLAY TECHNOLOGY, VOL. 4, NO. 4, DECEMBER 2008
(21)
(23)
subject in both measurements but different images because each condition and had its own images that were indexed with . Thus, the distribution of does not depend on whether or not. Further the images in each condition are i.i.d. as long as , , , and are fixed. Combining this with the fact that the distributions do not depend on the particular , we can simplify this to
To produce an unbiased estimate of
, we then use
(25)
(26)
(24)
As in the fixed-condition case, the variance of a single display is estimated by setting .
Authorized licensed use limited to: IEEE Xplore. Downloaded on February 2, 2009 at 20:04 from IEEE Xplore. Restrictions apply.
TISDALL et al.: COMPARING NOVEL HIGH-LUMINANCE HDR AND STANDARD MEDICAL LCD DISPLAYS
ACKNOWLEDGMENT The authors would like to acknowledge the assistance of Dr. B. Maedler at Philips Medical Systems for providing the high-field MRI images. REFERENCES [1] K. A. Fetterly, H. R. Blume, M. J. Flynn, and E. Samei, “Introduction to grayscale calibration and related aspects of medical imaging grade liquid crystal displays,” J. Digital Imag., Mar. 2007. [2] T. Kimpe and T. Tuytschaever, “Increasing the number of gray shades in medical display systems—How much is enough,” J. Digital Imag., vol. 20, no. 4, pp. 422–432, Dec. 2007. [3] J. J. Vos, B. L. Cole, H.-W. Bodmann, E. Colombo, T. Takeuchi, and T. J. T. P. van den Berg, CIE Equations for Diability Glare CIE, 2002, Tech. Rep. 146. [4] H. Seetzen and L. A. Whitehead, “A high dynamic range display using low and high resolution modulators,” in SID 03 Dig., 2003, pp. 1450–1453. [5] H. Seetzen, S. Makki, H. Ip, T. Wan, V. Kwong, G. Ward, Wolfga, and L. Whitehead, “Self-calibrating wide color gamut high dynamic range display,” in Human Vision and Electronic Imaging XII, ser. Proceedings of the SPIE. : SPIE—The Int. Soc. Opt. Eng., 2007, vol. 6492. [6] M. D. Tisdall and M. S. Atkins, “Using human and model performance to compare MRI reconstructions,” IEEE Trans. Med. Imag., vol. 25, no. 11, pp. 1510–1517, Nov. 2006. [7] H. Gudbjartsson and S. Patz, “The Rician distribution of noisy MRI data,” Magn. Reson. Med., vol. 34, pp. 910–914, 1995. [8] J. P. Rolland and H. H. Barrett, “Effect of random background inhomogeneity on observer detection performance,” J. Opt. Soc. Amer. A, vol. 9, no. 5, pp. 649–658, May 1992. [9] M. P. Eckstein, C. K. Abbey, and J. S. Whiting, “Human vs model observers in anatomic backgrounds,” in Proc. SPIE—Medical Imaging 1998. : , 1998, vol. 3340, pp. 16–26. [10] M. P. Eckstein, C. K. Abbey, F. O. Bochud, J. L. Bartoff, and J. S. Whiting, “The effect of image compression in model and human performance,” in Proc. SPIE, 1999, vol. 3663, pp. 243–252. [11] A. Badano and B. D. Gallas, “Detectability decreases with off-normal viewing in medical liquid crystal displays,” Acad. Radiol., vol. 13, pp. 210–218, 2006. [12] A. E. Burgess, X. Li, and C. K. Abbey, “Visual signal detectability with two noise components: Anomalous masking effects,” J. Opt. Soc. Amer. A, vol. 14, no. 9, pp. 2420–2442, Sep. 1997. [13] S. Park, “Efficiency of the human observer detecting random signals in random backgrounds,” J. Opt. Soc. Amer. A, vol. 22, no. 1, pp. 3–16, Jan. 2005. [14] A. G. Rempel, M. Trentacoste, H. Seetzen, H. D. Young, W. Heidrich, L. Whitehead, and G. Ward, “Ldr2hdr: On-the-fly reverse tone mapping of legacy video and photographs,” in SIGGRAPH ’07, pp. 39–44. [15] M. Trentacoste, “Photometric Image Processing for High Dynamic Range Displays,” Master’s, Univ. of British Columbia, Vancouver, Canada, 2006. [16] E. Siegel, E. Krupinski, E. Samei, M. Flynn, K. Andriole, B. Erickson, J. Thomas, A. Badano, J. A. Seibert, and E. D. Pisano, “Digital mamography image quality: Image display,” J. Amer. College of Radiol., vol. 3, pp. 615–627, 2006. [17] B. D. Gallas, G. A. Pennello, and K. J. Myers, “Multireader multicase variance analysis for binary data,” J. Opt. Soc. Amer. A, vol. 24, no. 12, pp. B70–B80, Dec. 2007. [18] B. D. Gallas and D. G. Brown, “Reader studies for validation of cad systems,” Neural Netw., vol. 21, pp. 387–397, 2008. [19] D. J. Schuirmann, “A comparison of the two one-sided tests procedure and the power approach for assessing the equivalence of average bioavailability,” J. Pharmacokinet. Biopharmaceut., vol. 15, no. 6, pp. 657–680, 1987.
409
[20] S. Wellek, Testing Statisical Hypotheses of Equivalence. London, U.K.: Chapman and Hall, 2003. [21] W. J. Westlake, “Symmetrical confidence intervals for bioequivalence trials,” Biometrics, vol. 32, no. 4, pp. 741–744, 1976. M. Dylan Tisdall received the B.Math. (Hons) degree from the University of Waterloo, Waterloo, Canada, in 2002, and the Ph.D. degree from Simon Fraser University, Vancouver, Canada, in 2007, both in computer science. He is currently a Research Fellow at the Athinoula A. Martinos Center for Biomedical Imaging, Boston, MA. His research focuses on the reconstruction of medical images using statistical estimation methods and the evaluation of reconstructions and displays using perceptual studies.
Gerwin Damberg is a Senior Research Engineer at Dolby Canada. In the Image Technologies Research Department one of his responsibilities is the Human Factors Study program.
Paul Wighton received the B.Sc. degree in engineering from the University of Guelph, Guelph, Canada, in 2003. He is currently working toward the M.Sc. degree in computing science from Simon Fraser University, Vancouver, Canada. His research focuses on methods to improve the automated diagnosis of melanoma.
Nhi Nguyen received the B.Eng degree in software engineering from The University of Sydney, Sydney, Australia, in 2005, and is currently working toward the M.Sc. degree from Simon Fraser University, Vancouver, Canada. She is a member of the Medical Computing lab at this university. Her research interests include medical image display and analysis, statistical signal processing and computer graphics.
Yan Tan received the B.Sc. degree in software engineering from Zhejiang University in 2007, and is currently working toward the M.Sc. degree from Simon Fraser University, Vancouver, Canada, in computer science. His research interests include medical data-mining and the use of eyetrackers.
M. Stella Atkins received the B.Sc. degree in Chemistry from Nottingham University in 1966 and the PhD degree in computer science from the University of British Columbia in 1985. She is a Professor in the School of Computing Science at Simon Fraser University (SFU), Vancouver, Canada, and Director of the Medical Computing Lab at SFU. Her research interests include telehealth applications, medical image display and analysis, in addition to medical image segmentation, image denoising and perception, and radiology workstation design. She is also interested in the use of eyetrackers for seeing inside the brain.
Hiroe Li is a Research Engineer for Image Technology Research at Dolby Canada. She is responsible for designing and conducting the Human Factors studies of the high dynamic range display.
Helge Seetzen is the Senior Manager for Image Technology Research at Dolby Canada. He is responsible for the development of high dynamic range display, video and capture technology.
Authorized licensed use limited to: IEEE Xplore. Downloaded on February 2, 2009 at 20:04 from IEEE Xplore. Restrictions apply.