This article has been accepted for inclusion in a future issue of this journal. Content is final as presented, with the exception of pagination. IEEE JOURNAL OF SELECTED TOPICS IN APPLIED EARTH OBSERVATIONS AND REMOTE SENSING
1
Comparing the Effect of Preprocessing Transformations on Methods of Land-Use Classification Derived From Spectral Soil Measurements Offer Rozenstein, Tarin Paz-Kagan, Christoph Salbach, and Arnon Karnieli, Member, IEEE
Abstract—Advanced classifiers, e.g., partial least squares discriminant analysis (PLS-DA) and random forests (RF), have been recently used to model reflectance spectral data in general, and of soil properties in particular, since their spectra are multivariate and highly collinear. Preprocessing transformations (PPTs) can improve the classification accuracy by increasing the variability between classes while decreasing the variability within classes. Such PPTs are common practice prior to a PLS-DA, but are rarely used for RF. The objectives of this paper are twofold: to compare the performances of PLS-DA and RF for modeling the spectral reflectance of soil in changed land-uses with different treatments and to compare the effects of nine different PPTs on the prediction accuracy of each of these classification methods. Differences in six physical, biological, and chemical soil properties of changed land-uses from the northern Negev Desert in Israel were evaluated. Significant differences were found between soil properties, which are used to classify land-uses and treatments. Depending on the dataset, different PPTs improved the classification accuracy by 11%–24% and 32%–42% for PLS-DA and RF, respectively, in comparison to the spectra without PPT. Out of the PPTs tested, the generalized least squares weighting (GLSW)based transformations were found to be the most effective for most classifications using both PLS-DA and RF. Our results show that both PLS-DA and RF are suitable classifiers for spectral data, provided that an appropriate PPT is applied. Index Terms—Generalized least squares weighting (GLSW), land-use changes, partial least squares discriminant analysis (PLS-DA), preprocessing transformations (PPTs), random forests (RF), soil spectroscopy.
I. I NTRODUCTION
R
ECENT assessments of soil ecosystem functions and their consequences for global sustainability accentuate the importance of soil resource management in different land-uses for both present and future societal welfare [1], [2]. Manuscript received August 09, 2014; revised October 25, 2014; accepted November 10, 2014. This work was supported by the Transnational Access to Research Infrastructures activity in the 7th Framework Program of the EC under the ExpeER project under REA Grant 262060. The work of O. Rozenstein was supported in part by Pratt Foundation. O. Rozenstein and T. Paz-Kagan contributed equally to the work. O. Rozenstein, T. Paz-Kagan, and A. Karnieli are with the Remote Sensing Laboratory, Blaustein Institutes for Desert Research, Ben-Gurion University of the Negev, Sede Boker Campus 84990, Israel (e-mail:
[email protected]). C. Salbach is with the Department of Computational Landscape Ecology, Helmholtz Centre for Environmental Research UFZ, D-04318 Leipzig, Germany. Color versions of one or more of the figures in this paper are available online at http://ieeexplore.ieee.org. Digital Object Identifier 10.1109/JSTARS.2014.2371920
Soil is a complex material that is extremely variable in its physical, biological, and chemical compositions. The soil body is a product of five factors: climate, time, organisms, topography, and parent materials [3]. The great variability in soils is the result of the interactions of these factors and their influence on the formation of different soil profiles [4]. Reflectance spectroscopy in the visible (VIS, 400–700 nm), near infrared (NIR, 700–1100 nm), and shortwave infrared (SWIR, 1100–2500 nm) regions is a well-established source of rich information about the composition of the Earth’s surface, in general, and about soil, in particular [5]. It is a rapid, nondestructive, reproducible, and cost-effective analytical method for soil management [6]. The relative amounts of energy reflected from surfaces vary as a function of wavelength. Several factors affect soil reflectance in the VIS-NIR-SWIR, such as the soil mineralogy (e.g., iron oxides, clay minerals, and carbonates), with additional effects due to soil water content, organic matter content, soil texture, and soil roughness [7]–[10]. Features in reflectance often result from vibrations in C–H, O–H, or N–H chemical bonds and minerals [11]. Therefore, reflectance can be used quantitatively to characterize soil properties. Reflectance spectroscopy is used in chemometrics to construct classification and regression models to predict target attributes. While regression methods are used to model the spectral signature of a target based on specific physical, biological, or chemical properties, classification is used to group spectral signatures into categories [12]–[15]. Recently, imaging spectroscopy has used chemometrics techniques for the classification of hyperspectral images [16]–[18]. Since hyperspectral data are highly collinear [19], and owing to their multivariate nature, multivariate analysis techniques are used in order to model the holistic relationship between samples [20]. In practice, the number of test samples is often smaller than the number of spectral bands used for classification. Spectral and hyperspectral data are similar, in this sense, to other complex multivariate datasets, such as metabolic data [21], [22], and genetic data [23], and, therefore, similar analysis techniques can be applied. Since multivariate regression and principle component analysis (PCA) performances are not optimal under the abovementioned conditions, more advanced methods are adopted to tackle the problem [24]. These methods can be divided into two groups: parametric and nonparametric approaches. In this paper, representatives of each group are explored.
1939-1404 © 2014 IEEE. Personal use is permitted, but republication/redistribution requires IEEE permission. See http://www.ieee.org/publications_standards/publications/rights/index.html for more information.
This article has been accepted for inclusion in a future issue of this journal. Content is final as presented, with the exception of pagination. 2
IEEE JOURNAL OF SELECTED TOPICS IN APPLIED EARTH OBSERVATIONS AND REMOTE SENSING
The partial least squares discriminant analysis (PLS-DA) [25] is an increasingly popular parametric method for the supervised classification of spectral data [26]. Its strength lies in performing dimensionality reduction while simultaneously carrying out classification. The PLS–DA is a variant of PLS modeling and aims to find the variables and directions in multivariate space that determine the known classes in a calibration set. It is similar to the unsupervised PCA [27] in the sense that both are methods for dimensionality reduction by projecting the original spectral bands into new components through the calculation of their loadings. However, PLS-DA rotates the PCA components to maximize the covariance between the samples of each class, to sharpen the separation of classes, whereas PCA maximizes the variance between the components. Consequently, PCA identifies variability in the whole dataset, and does not differentiate between variance within and between groups. For this reason, components, or latent variables (LV), produced by PLS-DA, are much more suited for the classification of hyperspectral data [28]. PLS-DA provides understandable graphical means of identifying the spectral regions of difference between the classes and also allows a statistical evaluation as to whether the differences between classes are significant. In addition to the generation of strong prediction models, the variable importance in projection (VIP) can be computed to rank the spectral band relevance and to determine a subset of spectral bands that are important for the model’s prediction [29]. Accordingly, PLS-DA exhibits properties desired by users of spectral data. A representative of the nonparametric methods group, random forests (RF), is a machine-learning method that possesses attractive features for the classification of hyperspectral data. RF is an ensemble classification technique that uses a majority vote of a combination of classification trees to classify the data [30]. Each tree is created from a randomly sampled subset of the data via bagging, or bootstrap aggregation [31]. Much like PLS-DA, RF also performs a predictor importance ranking, which allows the explicit elimination of irrelevant features [32]. Therefore, RF is suitable for hyperspectral data analysis [33], [34], owing to its ability to handle multivariate data that include redundant or irrelevant bands and a built-in accuracy assessment. Several studies have combined PLS and RF approaches. One study used a PLS approach for feature extraction and then applied RF for classification [35]. Another study used both PLS-DA and RF as complementary feature selection methods, to corroborate the selection of the most important features of the model by independent methods [36]. Therefore, it was shown that a combination of both feature selection strategies is beneficial. Other studies compared RF and PLS in terms of prediction accuracy [37]. Since the feature selection capabilities of the two approaches are of great interest, they are often compared [22], [24]. Even though the feature selection properties of both methods have not been specifically compared for spectral reflectance data, this issue has been sufficiently explored using similar datasets. In this regard, it should be noted that less attention has been given to research into the preprocessing effects on the modeling accuracy. The importance of selecting a proper preprocessing transformation (PPT) for modeling processes using
spectroscopy was previously discussed [38]. Spectral PPTs are employed to remove any inappropriate information that cannot be correctly handled by the modeling techniques. The purposes of preprocessing are to linearize the response of the variables and to remove extraneous sources of variance that are not of interest in the analysis. Prior to classification, PPTs are used to increase the variability between classes while, at the same time, decreasing the variability within classes and, thus, enabling better discrimination of classes. The different PPTs, or their combinations, need to be selected based on dataset type and its quality [38]. Therefore, data preprocessing can play an important role in increasing the accuracy of the classification. Two concurrent research gaps were identified. First, although both PLS-DA and RF classification have already been used for hyperspectral remote sensing applications [39]–[44], to the best of our knowledge, the performance accuracy of RF has not been compared with PLS-DA for the classification of reflectance spectroscopy or remote sensing data. Where variants of these methods were compared for regression analysis, standard preprocessing took place without individual optimization for each method [45]. This leads us to the second gap. Although the application of different PPTs to the spectra prior to the PLSDA classification of hyperspectral data is quite common [16], [46]–[48], we are not aware of publications that have examined the effect of similar PPTs prior to RF classification. In fact, RF is sometimes used without preprocessing the spectral data except for the removal of noisy bands [41], and thus, the potential of the RF classifier may be under-realized. Filling these two knowledge gaps will improve the use of these approaches in environmental science and engineering, in general, and the ability to classify spectral reflectance soil data, in particular. The aim of this study is to apply PLS-DA and RF classification techniques to the spectral reflectance of soil samples from changed land-uses in the semiarid area of the northern Negev Desert in Israel. Land-use classification based on spectral data was previously performed for this area [49], but in addition, classification of land-use based on soil function can improve the land management of these areas. Since land-use changes and management practices affect soil quality and function, monitoring the effects is essential. Using laboratory analyses of soil physical, biological, and chemical properties, to measure the response of soil to land-use practices is feasible but highly expensive, as well as time- and labor-consuming [13]. On the other hand, reflectance spectroscopy is a diagnostic screening tool that can aid the development of reliable, specific spectral definitions to characterize soil. This technique can assist in the environmental management of ecosystems going through landuse changes [50]. Consequently, the application of the abovementioned classification methods to classify soil responses to land-use changes is expected to be effective. We hypothesize that when spectral data are preprocessed to improve the class discrimination for one classifier, it may change the performance of another classifier as well. Furthermore, we hypothesize that differences in soil physical, biological, and chemical properties will be expressed in the ability to spectrally classify the dataset. Therefore, the objectives of this paper are twofold: 1) to compare the performance of PLS-DA and RF for the classification of spectral reflectance data, and 2) to compare the effects of
This article has been accepted for inclusion in a future issue of this journal. Content is final as presented, with the exception of pagination. ROZENSTEIN et al.: COMPARING THE EFFECT OF PPTs ON METHODS OF LAND-USE CLASSIFICATION
3
different PPTs on the prediction accuracy of each of these classification methods. II. M ETHODS A. Study Ecosystems The three study sites are all located in the northern Negev Desert of Israel, across the transition between the arid and semiarid zones. This area is characterized by a mean annual rainfall of 200–300 mm that is concentrated during the rainy season between November and April. Average daily temperature ranges from 10◦ C in the winter to 30◦ C in the summer. Three different land-uses were selected for the study: 1) afforestation; 2) traditional grazing; and 3) agro-pastoral grazing (Fig. 1). In addition, each land-use includes several treatments (management strategies) as presented in Table I. The afforestation land-use includes a natural shrubland and a planted forest. In each of these, both open and understory patches were studied. The traditional grazing land-use includes a natural area with no grazing (where grazing was excluded), compared to the traditional grazing area, in the north- and south-facing slopes. In the agro-pastoral land-use, three different treatments were compared, including an abandoned field, where grazing has been excluded, an abandoned field with grazing, and a monoculture agro-pastoral field (wheat field). None of the study plots were fertilized or irrigated. B. Data Description Soil samples were collected for laboratory and spectral analysis in August 2011, at the peak of the dry season, from a depth of 0–0.15 m. Thus, the soil water content in the samples was minimal. Sampling was conducted using a stratified random sampling strategy. For each treatment, the samples included five quadrates of 1 m2 , randomly placed (n = 5). In each quadrate, four soil samplings of about 700 gr of soil were collected for laboratory measurement (N = 55). Additionally, four more soil samples of about 500 gr were collected in each quadrate for spectral laboratory measurement (n = 55). In total, 220 soil samples were collected (repeated measurements of four soil samples from each quadrate) for laboratory measurement and an additional 220 soil samples for hyperspectral measurements. All soil samples were transferred to the laboratory and were stored unopened at room temperature until analysis. Six physical, biological, and chemical properties that include: soil texture (fractions of clay, silt, and sand), soil organic matter (SOM), pH, electrical conductivity (EC), extractable ammonium (NH4 + ), and extractable nitrate (NO3 − ) were selected. More details of these analyses are described by Paz-Kagan et al. [51]. All laboratory measurements were performed according to the Cornell soil health test (CSHT) standards [52]–[54]. In addition, the soil samples were taken to the laboratory for spectral measurements. Prior to the spectral measurements, the soil samples were ground and sieved through a 2-mm sieve. Soil samples were measured with the portable analytical spectral devices (ASD) Field Spec Pro spectrometer that measured the spectral range of 350–2500 nm through a 25◦ field of view. The position of the sensor was vertical in relation to the
Fig. 1. Studied ecosystem of the changed land-uses. Location map of the sites in the northern Negev Desert in Israel: 1) afforestation, 2) traditional grazing, and 3) agro-pastoral grazing.
target, at a distance of 18.5 cm above the sample platform. The ground field of view was circular with a diameter of 8 cm. The instrument was recurrently calibrated to spectral reflectance using a standard white reference panel (Spectralon Labsphere Inc., North Sutton, NH, USA). Reflectance data were collected under stable illumination from two directions while the spectrometer’s fiber aperture was fixed at a constant height of 20 cm above the sample platform. The bidirectional illumination reduced the effects of micro-topography shadowing. To further eliminate bidirectional reflectance distribution function (BRDF) effects, each sample was measured four times, while rotating 90◦ between each reading [55], [56]. The four readings were later averaged to a final value representing the sample at a spectral resolution of 1 nm. C. Statistical Analysis Analyses of variances for all soil properties were tested using: 1) a general linear model (GLM) analysis of random effect (Nested-ANOVA), and 2) an one-way ANOVA for the average sample of each quadrate in a treatment (n = 5). The separation of means was subjected to a Tukey honest significance difference (HSD) test for a significant difference. Differences in soil properties were tested for significance at p ≤ 0.05 between changed land-uses and treatments and by the results of the F-statistic test. The statistical analysis was performed with STATISTICA Version 10, 2011 software. D. Preprocessing Transformations (PPTs) Several PPTs were tested in this study, including averaging, centering, smoothing, standardization, normalization, and other methods. Several of the most frequently used methods in spectroscopy that are embedded in the PLS-Toolbox (Eigenvector Research Incorporated) were included in the study.
This article has been accepted for inclusion in a future issue of this journal. Content is final as presented, with the exception of pagination. 4
IEEE JOURNAL OF SELECTED TOPICS IN APPLIED EARTH OBSERVATIONS AND REMOTE SENSING
TABLE I D IFFERENT L AND - USES I NVOLVED IN THIS S TUDY: A FFORESTATION , T RADITIONAL G RAZING , AND AGRO -PASTORAL G RAZING , A LONG W ITH D IFFERENT T REATMENTS FOR E ACH L AND - USE
1) Auto scaling (AS) is an exceptionally common PPT that subtracts the spectral signature of each sample from the mean spectral signature (mean-centering, MC), followed by dividing each variable by the standard deviation of the variable. Under these conditions, each variable is scaled such that its useful signal has an equal footing with the other variables’ signals [57]. 2) The standard normal variate (SNV) normalization transformation scales each sample by the mean and standard deviation of its multiple variables. The PPT is applied to each spectrum individually by subtracting the spectrum mean and dividing by the spectrum standard deviation [58]. 3) Smoothing, using the Savitzky–Golay algorithm [59], is a simplified least squares fit convolution in which successive subsets of adjacent data points are fitted to a low-degree polynomial. Smoothing is a low-pass filter used for removing high-frequency noise from samples; it reduces noise without significant loss of the signal of interest [59]. The convolution can be understood as a weighted moving average filter, with weights given as a polynomial of a certain degree. This transformation was found to be an optimal spectral PPT in similar studies [50], [60], [61]. 4) For first and second derivatives of the reflectance spectra, we used the Savitzky–Golay smoothing algorithm on first derivatives (SG1D), second derivatives (SG2D), and for simple smoothing (SGS). All of these were performed using a 15-band window and a third-order polynomial fit. 5) Multiplicative signal correction (MSC) is one of the most commonly used normalization transformations; the light scattering is estimated for each sample, relative to an ideal sample obtained by averaging the complete spectral range of the dataset. It is a relatively simple processing step that attempts to account for scaling effects and offset effects. Each spectrum is corrected, such that all samples appear to have the same scatter level as the reference spectrum [62]. 6) Generalized least squares weighting (GLSW) produces a filter matrix based on the differences between pairs or groups of samples that should otherwise be similar [57]. The single adjustable parameter α that defines how strongly GLSW lowers weight interferences was set to 0.02. Adjusting α toward larger values (typically above
0.02) decreases the effect of the filter, while smaller α values (typically 0.001 and below) apply more filtering. The effects of the PPTs on spectral data to which no processing was applied prior to classification for both classification methods (PLS-DA and RF) were compared. In addition, we applied combinations of different PPTs that were found to be successful in previous studies: SG1D + SNV [63], MSC + SG2D + MC [64], and SGS + AS + GLSW [51]. Since the preprocessing was performed with a PLS-Toolbox, other PPTs that are not included in this toolbox were not part of the comparison. E. Classification and Accuracy Comparison Classification was performed for each of the land-uses on its own: afforestation (four classes), traditional grazing (four classes), agro-pastoral grazing (three classes), and for all the samples, by aggregating treatments in each land-use, to perform a land-use classification (three classes) (Table I). Following the different PPTs, each transformed dataset was classified using both PLS-DA and RF. The PLS-DA classification was performed with the PLS-Toolbox. The number of LV was selected based on the recommendation of the PLS-Toolbox optimizing algorithm [57]. RF classification was performed by the TreeBagger command in the MATLAB Statistics Toolbox (Mathworks). For each model, 500 trees were grown. The cross validation of the classification models was performed using 10 repeated random subsampling validation sets [65], [66], with a 2:1 split ratio between the calibration and the validation sets. Subsequently, the accuracy was assessed using these same 10 validation subsets every time. The results of each set of 10 classifications were averaged. For each averaged classification, the Kappa statistic was calculated as a measure of classification accuracy. We used the approximate large sample variance of the Kappa statistic to estimate its variance [67]. The variance estimations were used to determine if one classification is significantly more accurate than another by performing a two-tailed Z-test with α = 0.05 [68]. III. R ESULTS A. Soil Laboratory Measurement The soil properties across the three land-use types are presented in Table II with their mean values along with their standard deviations and significance values. In the afforestation
This article has been accepted for inclusion in a future issue of this journal. Content is final as presented, with the exception of pagination. ROZENSTEIN et al.: COMPARING THE EFFECT OF PPTs ON METHODS OF LAND-USE CLASSIFICATION
5
TABLE II A NALYTICAL R ESULTS OF S OIL P ROPERTIES IN D IFFERENT L AND - USES AND T REATMENTS
Statistics include: average value, standard deviation, and significant differences between treatments. SOM, soil organic matter; EC, electric conductivity; NH4 , ammonium; NH3 , nitrate; NS, not significant. a, b, and c indicate significant differences between treatments.
land-use, SOM was significantly higher in the forest than in the shrubland treatments. In addition, significant differences in soil texture were observed between the silty-loam soil in the natural shrubland and the loam soil in the forest. In the traditional grazing land-use, the treatments with no grazing showed significant reductions in SOM and pH compared to the grazing treatments, in both north- and south-facing slopes. However, the soil NH4 + and NO3 − did not respond to the long-term grazing, but showed
significant differences according to the topographic aspect. In the agricultural land-use, the agro-pastoral grazing treatment showed significant increases in NH4 + and NO3 − compared to the abandoned field with no grazing. The abandoned field with grazing showed significant increases in SOM, EC, and NO3 − and a reduction in NH4 + compared to the abandoned field with no grazing. These differences in the soil properties indicate that changes in the soil quality are the result of different
This article has been accepted for inclusion in a future issue of this journal. Content is final as presented, with the exception of pagination. 6
IEEE JOURNAL OF SELECTED TOPICS IN APPLIED EARTH OBSERVATIONS AND REMOTE SENSING
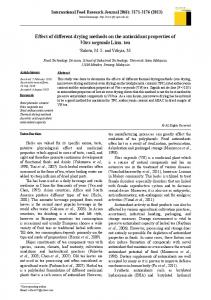
Fig. 2. Examples of the Preprocessing Transformations (PPTs) effects on the average spectral signatures of the three land-use classes: afforestation, traditional grazing, and agro-pastoral grazing. The purpose of preprocessing the spectral signatures is to remove extraneous sources of variation that are not of interest in the analysis, thus enabling better class discrimination. The examples in this figure demonstrate that some transformations are more suited for this task than others: AS, MSC, SGS, SG1D, and GLSW.
management practices, and can be identified by reflectance spectroscopy. A previous study showed that these changes in soil quality can be classified from reflectance spectra [51]. B. Preprocessing Transformations (PPTs) Fig. 2 demonstrates several of the above-mentioned PPTs that were applied to the average VIS-NIR-SWIR reflectance spectra of the soil samples that represent the three land-uses. Fig. 2 shows that the spectral signatures that were not preprocessed are similar and not easily distinct from each other. However, with some PPTs, the slight differences between these spectral signatures can be accentuated in a way that enables better discrimination between classes. These differences in the
spectral signatures occur because of differences in the soil physical, chemical, and biological properties of the different land-uses and treatments [51]. Fig. 3 shows the effect of spectral preprocessing on the class separability by two PLS LV. When no preprocessing is applied, the classes are mixed together. Smoothing alone does not allow better class separation in this case. However, other PPTs perform better, to various degrees. Visually, GLSW unmistakably discriminates between the classes in the best manner. SGS offers little improvement in class discrimination, while AS, MSC, and SG1D offer better discrimination than no preprocessing, but the categorical clustering is not as clear with these transformations relative to GLSW. Therefore, the results, presented in Figs. 2 and 3, suggest that several of the PPTs are suitable for increasing the
This article has been accepted for inclusion in a future issue of this journal. Content is final as presented, with the exception of pagination. ROZENSTEIN et al.: COMPARING THE EFFECT OF PPTs ON METHODS OF LAND-USE CLASSIFICATION
7
Fig. 3. Examples of PLS-DA model output following several PPTs. The samples are projected onto a plane defined by two LV. This view is useful to demonstrate class separability. The transformations used are: AS, MSC, SGS, SG1D, and GLSW.
variance between groups prior to classification. Only the PPTs or combinations of PPTs that produce such discrimination were used in the classification process. C. Preprocessing Effect on the Classification Accuracy Fig. 4(A) shows the PLS-DA classification accuracy for different PPTs applied to all classifications. In most cases, the
most accurate classification models were for the land-use and agro-pastoral classifications. There was no significant increase in accuracy when applying different PPTs prior to the agropastoral and afforestation classification. However, there were significant improvements in the classification accuracy for the traditional grazing treatment through the application of some PPTs. Considering spectra without preprocessing as a basis, the SGS + AS + GLSW PPT improved the classification
This article has been accepted for inclusion in a future issue of this journal. Content is final as presented, with the exception of pagination. 8
IEEE JOURNAL OF SELECTED TOPICS IN APPLIED EARTH OBSERVATIONS AND REMOTE SENSING
Fig. 4. (A) PLS-DA and (B) RF classification accuracies in terms of the Kappa coefficient for the land-use classification and for the classification of the different treatments within each land-use. Z-tests were performed to determine if the classification accuracy, following each PPT, is significantly different than the classification accuracy of the data without preprocessing. A significant change in accuracy is marked by * (p ≤ 0.05) or ** (p ≤ 0.01). The error bars represent the standard deviation. Abbreviations used for the different pre-processing transformations: auto scaling (AS); standard normal variate (SNV); multiplicative signal correction (MSC); smoothing (SGS); first derivative (SG1D); second derivative (SG2D); and generalized least squares weighting (GLSW).
accuracy by 24% for the traditional grazing. Moreover, GLSW and SGS + AS + GLSW improved the classification accuracy by 17% and 21% for the afforestation classification, while SGS + AS + GLSW improved the classification accuracy of the agro-pastoral classification only by 11%, which was not significant. The best accuracy, up to 100%, was reached for the land-use classification where GLSW, and SGS + AS + GLSW, improved the accuracy by 17%. Similarly, Fig. 4(B) exhibits the RF classification accuracy for different PPTs applied to all classifications. All of
the PPTs but AS showed some improvement in the RF classification accuracy in comparison to the spectra that were not preprocessed. The best PPT for all classifications was SGS + AS + GLSW. Its application increased the accuracy of the traditional grazing classification by 42%, the agropastoral classification by 32%, and the afforestation classification by 37%. The land-use classification improved by 34% following the application of several combinations of PPTs: GLSW, SG1D, SG2D, MSC + SG2D + MC, and SGS + AS + GLSW.
This article has been accepted for inclusion in a future issue of this journal. Content is final as presented, with the exception of pagination. ROZENSTEIN et al.: COMPARING THE EFFECT OF PPTs ON METHODS OF LAND-USE CLASSIFICATION
9
TABLE III Z-T ESTS THAT D ETERMINE W HETHER THE C LASSIFICATION ACCURACIES OF PLS-DA AND RF ARE D IFFERENT F ROM E ACH OTHER FOR D IFFERENT L AND - USES AND FOR D IFFERENT T REATMENTS W ITHIN E ACH L AND - USE
Fig. 5. Comparison of RF and PLS-DA in terms of the Kappa coefficient for the land-use classification and for the classification of different treatments within each land-use, without applying a PPT. Z-tests were performed to determine if one classifier is significantly different than the other. A significant difference in accuracy is marked by * (p ≤ 0.05) or ** (p ≤ 0.01). The error bars represent the standard deviation.
D. Comparing RF versus PLS-DA The classification accuracy of RF and PLS-DA for each PPT is presented in Table III and the results for which no PPT was applied prior to classification are presented in Fig. 5. They show that PLS-DA performed better than RF for data without preprocessing (this was significant for the land-use, traditional grazing, and agro-pastoral classifications, and not significant for afforestation). On the other hand, although the RF accuracy for data that were not preprocessed was very low, it was improved considerably by performing preprocessing. In the afforestation classification, applying SGS + AS + GLSW improved the RF accuracy by 37%. Out of all the PPTs that were applied to preprocess our data, GLSW, and the combination of SGS + AS + GLSW were the most effective when using PLS-DA. These two PPTs were also consistently among the most effective when using RF. However, in some cases, other PPTs performed as accurately, as presented in Table IV. Hence, preprocessing was found to improve the classification accuracy for both RF and PLS-DA, but the improvements to the RF accuracy were greater. The spectral discriminations of land-use classes are due to significant differences in the soil physical, chemical, and biological properties. The comparison between RF and PLS-DA performance for land-use classification using different PTTs is presented in Fig. 6. When no PPT is applied or when AS is applied, PLSDA outperforms RF. By applying other PPTs, it is shown that RF outperforms PLD-DA. However, it was found that both RF and PLS-DA perform perfectly for classifying land-use when GLSW or SGS + AS + GLSW are applied. Thus, it is shown that both classifiers can be significantly improved by choosing PPTs that are appropriate for both the classifier and the data. IV. D ISCUSSION The analysis of the current study showed that when spectral information without preprocessing was classified, PLS-DA performed better than RF. Yet, with proper preprocessing of the data, PLS-DA lost its superiority. The results demonstrate how
The transformations for which the accuracy was significantly different are marked in bold. The tested preprocessing transformations are: AS, auto scaling; SNV, standard normal variate; MSC, multiplicative signal correction; SGS smoothing; SG1D, first derivative ; SG2D, second derivative; and GLSW, generalized least squares weighting.
the PPTs that accentuated the variance between classes led to better classification accuracy. With the application of certain preprocessing steps, namely GLSW and SGS + AS + GLSW, the classification accuracy of both methods was improved. The improvement was even better for RF than for PLS-DA. This finding is of special interest, since the literature review revealed that, while spectral preprocessing is a common practice among PLS practitioners, it is not commonly practiced by RF users. The analysis revealed that both PLS-DA and RF are suitable for soil reflectance data classification. For our specific datasets, with the application of the optimal PPT, RF performed as well
This article has been accepted for inclusion in a future issue of this journal. Content is final as presented, with the exception of pagination. 10
IEEE JOURNAL OF SELECTED TOPICS IN APPLIED EARTH OBSERVATIONS AND REMOTE SENSING
TABLE IV B EST PPT S ELECTED FOR THE L AND - USE C LASSIFICATION AND FOR THE C LASSIFICATION OF D IFFERENT T REATMENTS W ITHIN E ACH L AND - USE
SGS, Savitzky–Golay smoothing; AS, auto scaling; GLSW, generalized least squares weighting.
Fig. 6. Comparison of RF and PLS-DA in terms of the Kappa coefficient for all land-use classifications following the different PPT. Z-tests were performed to determine if the classification accuracy of one classifier is significantly different from the other. A significant difference in accuracy is marked by * (p ≤ 0.05) or ** (p ≤ 0.01). The error bars represent the standard deviation.
as PLS-DA or slightly better, but more spectral datasets need to be examined before determining that it is superior to PLSDA. The classifiers may not perform in the same manner for other datasets. While our analysis did not take into account the computational resources demanded by each method, for large datasets, the processing time might be an important consideration, especially if results are needed in near real-time. In these cases, the RF classification approach may be too slow, and, therefore, fast-performing linear classifiers, such as PLS-DA, would be preferable [69]. In our case study, with the application of optimal PPTs, the accuracy of all classifications was near perfect. Therefore, even the high similarities between treatments in the same landuse do not pose a challenge for the tested classifiers when optimal PTTs are applied. For the less than optimal PPTs, the number of classes seems to be a determining factor for accuracy. The agro-pastoral PLS-DA classifications, divided into three classes with relatively high spectral separability, were very accurate, even without preprocessing, and were only slightly improved following the preprocessing. On the contrary, when RF was used to classify the agro-pastoral dataset without preprocessing, it produced low classification accuracy. However, most of the PPTs improved the RF Kappa statistic to over 0.9. Moreover, the classifications of traditional grazing and afforestation, divided into four categories, were, for the most part, unfavorably accurate, but they too
improved following most of the PPTs. These results suggest that when classifying soil using spectral data, and especially when the class separability is not high, the selection of the right PPT can significantly improve the classification model’s accuracy. PPTs change the input to the classifier in a manner that can significantly affect the outcome of the classification. Therefore, their application must be done with caution since class segregation may not always be due to meaningful differences, but due to noise. In this case study, it was shown that the significant differences in soil attributes that result from differences in management strategies are the cause for spectral differences between classes [51]. GLSW and the combination of SGS + AS + GLSW were found to be very suitable for increasing the variance between classes, while minimizing the within-class variance. Accordingly, these PPTs produced high classification accuracy in all the models, for both PLS-DA and RF. Our experience (unpublished) is that these PPTs also work well for regression analyses and for other datasets, such as vegetation spectral reflectance data. Therefore, we expect that these PPTs would be suitable for applications using similar spectral data in the VIS-NIR-SWIR. However, it is known that it is difficult to predict a priori the most suitable preprocessing method, and that different methods may be optimal for different datasets. This study offers a framework for selecting suitable PPTs for a specific dataset. The main challenge in developing a specific spectral model is to find the suitable preprocessing approach for achieving the most accurate classification. The classification accuracy depends on several additional factors, such as the spectral variance between classes, the number of classes, noise effects, and the spectral resolution. Spectral soil signatures are also affected by soil aggregation, particle size distribution, water content, and the presence of additional elements in the soil, such as vegetation litter, rock particles, and mineral deposits. Therefore, standardization of the sample preparation and measurement protocols are required. When the dataset offers good class separability, more than one PPT could produce a highly accurate model. However, when the differences between the classes are less apparent, either because the spectral differences are smaller or because fewer samples are available for calibration, some PPTs may work better than others to produce an accurate classification. In addition to this complexity, when moving from point measurements to imaging spectroscopy, the transition is not only from micro- to macroscales, but we encounter a whole new set of predicaments. Among these challenges are a low signal-to-noise ratio, atmospheric interference, large datasets, the BRDF effect, and more. Preprocessing may be relevant for dealing with some of the problems associated with imaging spectroscopy. V. C ONCLUSION Our results show that the PLS-DA and RF are both capable classifiers for modeling spectral reflectance soil data with high accuracy. However, under the same conditions, each classifier produces different accuracy, and one does not always trump the other. Our results further show that by applying a suitable data PPT, the accuracy of soil spectroscopy is significantly
This article has been accepted for inclusion in a future issue of this journal. Content is final as presented, with the exception of pagination. ROZENSTEIN et al.: COMPARING THE EFFECT OF PPTs ON METHODS OF LAND-USE CLASSIFICATION
improved, while each of the classifiers’ performance is changed in a different manner. When the spectra are not subjected to any preprocessing, PLS-DA is definitely more accurate than RF, but with a proper preprocessing algorithm, both classifiers do considerably well, and RF can sometimes perform better than PLS-DA. The accuracy improvement following the best PPT, in comparison with data without preprocessing, was 32%–42% for RF and 11%–24% for PLS-DA, depending on the dataset. In most cases, GLSW and a combination of SGS + AS + GLSW were found to be very effective in data transformation, leading to an accurate classification. This study offers a framework for selecting a suitable PPT for a specific dataset with different classification methods. Future studies can examine the effect of preprocessing on additional classifiers, such as support-vector machines and artificial neural networks, using additional preprocessing methods, and their application to other reflectance datasets.
R EFERENCES [1] Z. Adeel, U. Safriel, D. Niemeijer, and R. White, Millennium Ecosystem Assessment, Ecosystems and Human Well-Being: Desertification Synthesis. Washington, DC, USA: World Resources Inst., 2005. [2] S. S. Andrews, D. L. Karlen, and J. P. Mitchell, “A comparison of soil quality indexing methods for vegetable production systems in Northern California,” Agric. Ecosyst. Environ., vol. 90, pp. 25–45, Jun. 2002. [3] E. Ben-Dor et al., “Using imaging spectroscopy to study soil properties,” Remote Sens. Environ., vol. 113, Suppl. 1, pp. S38–S55, Sep. 2009. [4] S. W. Buol, F. D. Hole, and R. J. McCracken, Soil Genesis and Classification. Ames, IA, USA: Iowa State Univ., 1973, p. 360. [5] G. R. Hunt, “Spectral signatures of particulate minerals in the visible and near infrared,” Geophysics, vol. 42, p. 501, 1977. [6] E. Ben-Dor and A. Banin, “Near infrared analysis (NIRA) as a method to simultaneously evaluate spectral featureless constituents in soils,” Soil Sci., vol. 159, pp. 259–270, 1995. [7] S. N. Haubrock, S. Chabrillat, C. Lemmnitz, and H. Kaufmann, “Surface soil moisture quantification models from reflectance data under field conditions,” Int. J. Remote Sens., vol. 29, pp. 3–29, 2008. [8] E. Ben-Dor, Y. Inbar, and Y. Chen, “The reflectance spectra of organic matter in the visible near-infrared and short wave infrared region (400– 2500 nm) during a controlled decomposition process,” Remote Sens. Environ., vol. 61, pp. 1–15, Jul. 1997. [9] E. Ben-Dor and A. Chudnovsky, “A novel method of classifying soil profiles in the field using optical means,” Soil Sci. Soc. Amer. J., vol. 72, p. 1113, 2008. [10] R. A. Viscarra Rossel, D. J. J. Walvoort, A. B. McBratney, L. J. Janik, and J. O. Skjemstad, “Visible, near infrared, mid infrared or combined diffuse reflectance spectroscopy for simultaneous assessment of various soil properties,” Geoderma, vol. 131, pp. 59–75, Mar. 2006. [11] E. W. Ciurczak, “Principles of near-infrared spectroscopy,” in Handbook of Near-Infrared Analysis, D. A. Burns and E. W. Ciurczak, Eds. New York, NY, USA: Marcel Dekker, 2001, pp. 7–18. [12] A. O. Awiti, M. G. Walsh, K. D. Shepherd, and J. Kinyamario, “Soil condition classification using infrared spectroscopy: A proposition for assessment of soil condition along a tropical forest-cropland chronosequence,” Geoderma, vol. 143, pp. 73–84, 2008. [13] L. Cécillon et al., “Assessment and monitoring of soil quality using near-infrared reflectance spectroscopy (NIRS),” Eur. J. Soil Sci., vol. 60, pp. 770–784, 2009. [14] M. Odlare, K. Svensson, and M. Pell, “Near infrared reflectance spectroscopy for assessment of spatial soil variation in an agricultural field,” Geoderma, vol. 126, pp. 193–202, 2005. [15] E. Velasquez, P. Lavelle, E. Barrios, R. Joffre, and F. Reversat, “Evaluating soil quality in tropical agroecosystems of Colombia using NIRS,” Soil Biol. Biochem., vol. 37, pp. 889–898, 2005. [16] I. Herrmann, U. Shapira, S. Kinast, A. Karnieli, and D. J. Bonfil, “Ground-level hyperspectral imagery for detecting weeds in wheat fields,” Precis. Agric., vol. 14, pp. 637–659, Dec. 2013. [17] T. Caras and A. Karnieli, “Ground-level spectroscopy analyses and classification of coral reefs using a hyperspectral camera,” Coral Reefs, vol. 32, pp. 825–834, Sep. 2013.
11
[18] E. Ben-Dor, K. Patkin, A. Banin, and A. Karnieli, “Mapping of several soil properties using DAIS-7915 hyperspectral scanner data—A case study over clayey soils in Israel,” Int. J. Remote Sens., vol. 23, pp. 1043–1062, 2002. [19] S. Wold, A. Ruhe, H. Wold, and W. J. Dunn, “The collinearity problem in linear regression. The partial least squares (PLS) approach to generalized inverses,” SIAM J. Sci. Stat. Comput., vol. 5, pp. 735–743, 1984. [20] F. Ai et al., “Application of random forests to select premium quality vegetable oils by their fatty acid composition,” Food Chem., vol. 143, pp. 472–478, Jan. 2014. [21] X. Lin et al., “A method for handling metabonomics data from liquid chromatography/mass spectrometry: Combinational use of support vector machine recursive feature elimination, genetic algorithm and random forest for feature selection,” Metabolomics, vol. 7, pp. 549–558, 2011. [22] K. Bryan, L. Brennan, and P. Cunningham, “MetaFIND: A feature analysis tool for metabolomics data,” BMC Bioinformat., vol. 9, p. 470, 2008. [23] B. F. de Souza, A. de Carvalho, and C. Soares, “A comprehensive comparison of ml algorithms for gene expression data classification,” in Proc. Int. Joint Conf. Neural Networks (IJCNN), 2010, pp. 1–8. [24] B. Menze et al., “A comparison of random forest and its Gini importance with standard chemometric methods for the feature selection and classification of spectral data,” BMC Bioinformat., vol. 10, p. 213, 2009. [25] S. Wold, M. Sjöström, and L. Eriksson, “PLS-regression: A basic tool of chemometrics,” Chemom. Intell. Lab. Syst., vol. 58, pp. 109–130, Oct. 2001. [26] D. J. Brown, K. D. Shepherd, M. G. Walsh, M. D. Mays, and T. G. Reinsch, “Global soil characterization with VNIR diffuse reflectance spectroscopy,” Geoderma, vol. 132, pp. 273–290, 2006. [27] S. Wold, K. Esbensen, and P. Geladi, “Principal component analysis,” Chemom. Intell. Lab. Syst., vol. 2, pp. 37–52, 1987. [28] A. J. Hobro, J. Kuligowski, M. Döll, and B. Lendl, “Differentiation of walnut wood species and steam treatment using ATR-FTIR and partial least squares discriminant analysis (PLS-DA),” Anal. Bioanal. Chem., vol. 398, pp. 2713–2722, 2010. [29] I. Chong and C. Jun, “Performance of some variable selection methods when multicollinearity is present,” Chemom. Intell. Lab. Syst., vol. 78, pp. 103–112, 2005. [30] L. Breiman, “Random forests,” Mach. Learn., vol. 45, pp. 5–32, 2001. [31] L. Breiman, “Bagging predictors,” Mach. Learn., vol. 24, pp. 123–140, 1996. [32] G. Marchisio, F. Pacifici, and C. Padwick, “On the relative predictive value of the new spectral bands in the WorldWiew-2 sensor,” in Proc. IEEE Int. Geosci. Remote Sens. Symp. (IGARSS), Jul. 2010, pp. 2723– 2726. [33] P. Ghamisi, J. A. Benediktsson, G. Cavallaro, and A. Plaza, “Automatic framework for spectral–spatial classification based on supervised feature extraction and morphological attribute profiles,” IEEE J. Sel. Topics Appl. Earth Observ. Remote Sens., vol. 7, no. 6, pp. 2147–2160, Aug. 2014. [34] X. Shang and L. A. Chisholm, “Classification of Australian native forest species using hyperspectral remote sensing and machine-learning classification algorithms,” IEEE J. Sel. Topics Appl. Earth Observ. Remote Sens., vol. 7, no. 6, pp. 2481–2489, Aug. 2014. [35] J. Ramírez et al., “Computer aided diagnosis system for the Alzheimer’s disease based on partial least squares and random forest SPECT image classification,” Neurosci. Lett., vol. 472, pp. 99–103, 2010. [36] E. Domenici et al., “Plasma protein biomarkers for depression and schizophrenia by multi analyte profiling of case-control collections,” PLoS One, vol. 5, p. e9166, 2010. [37] T. Hancock, R. Put, D. Coomans, Y. V. Heyden, and Y. Everingham, “A performance comparison of modern statistical techniques for molecular descriptor selection and retention prediction in chromatographic QSRR studies,” Chemom. Intell. Lab. Syst., vol. 76, pp. 185–196, 2005. [38] A. Gholizadeh, L. Bor˚uvka, M. Saberioon, and R. Vašát, “Visible, near-infrared, and mid-infrared spectroscopy applications for soil assessment with emphasis on soil organic matter content and quality: Stateof-the-art and key issues,” Appl. Spectrosc., vol. 67, pp. 1349–1362, 2013. [39] P. O. Gislason, J. A. Benediktsson, and J. R. Sveinsson, “Random forests for land cover classification,” Pattern Recognit. Lett., vol. 27, pp. 294– 300, 2006. [40] V. F. Rodriguez-Galiano, M. Chica-Olmo, F. Abarca-Hernandez, P. M. Atkinson, and C. Jeganathan, “Random Forest classification of Mediterranean land cover using multi-seasonal imagery and multiseasonal texture,” Remote Sens. Environ., vol. 121, pp. 93–107, 2012. [41] J. Ham, Y. Chen, M. M. Crawford, and J. Ghosh, “Investigation of the random forest framework for classification of hyperspectral data,” IEEE Trans. Geosci. Remote Sens., vol. 43, no. 3, pp. 492–501, Feb. 2005.
This article has been accepted for inclusion in a future issue of this journal. Content is final as presented, with the exception of pagination. 12
IEEE JOURNAL OF SELECTED TOPICS IN APPLIED EARTH OBSERVATIONS AND REMOTE SENSING
[42] V. F. Rodriguez-Galiano, B. Ghimire, J. Rogan, M. Chica-Olmo, and J. P. Rigol-Sanchez, “An assessment of the effectiveness of a random forest classifier for land-cover classification,” ISPRS J. Photogramm. Remote Sens., vol. 67, pp. 93–104, 2012. [43] L. Naidoo, M. A. Cho, R. Mathieu, and G. Asner, “Classification of savanna tree species, in the Greater Kruger National Park region, by integrating hyperspectral and LiDAR data in a Random Forest data mining environment,” ISPRS J. Photogramm. Remote Sens., vol. 69, pp. 167–179, 2012. [44] K. Y. Peerbhay, O. Mutanga, and R. Ismail, “Commercial tree species discrimination using airborne AISA eagle hyperspectral imagery and partial least squares discriminant analysis (PLS-DA) in KwaZulu–Natal, South Africa,” ISPRS J. Photogramm. Remote Sens., vol. 79, pp. 19–28, 2013. [45] M. Schwieder, P. J. Leitão, S. Suess, C. Senf, and P. Hostert, “Estimating fractional shrub cover using simulated EnMAP data: A comparison of three machine learning regression techniques,” Remote Sens., vol. 6, pp. 3427–3445, 2014. [46] G. Schwartz, E. Ben-Dor, and G. Eshel, “Quantitative assessment of hydrocarbon contamination in soil using reflectance spectroscopy: A “multipath” approach,” Appl. Spectrosc., vol. 67, pp. 1323–1331, 2013. [47] N. Rotbart et al., “Estimating olive leaf nitrogen concentration using visible and near-infrared spectral reflectance,” Biosyst. Eng., vol. 114, pp. 426–434, 2013. [48] R. Kinoshita, B. N. Moebius-Clune, H. M. van Es, W. D. Hively, and A. V. Bilgilis, “Strategies for soil quality assessment using visible and near-infrared reflectance spectroscopy in a Western Kenya chronosequence,” Soil Sci. Soc. Amer. J., vol. 76, pp. 1776–1788, 2012. [49] O. Rozenstein and A. Karnieli, “Comparison of methods for land-use classification incorporating remote sensing and GIS inputs,” Appl. Geogr., vol. 31, pp. 533–544, 2011. [50] T. Vågen, K. D. Shepherd, and M. G. Walsh, “Sensing landscape level change in soil fertility following deforestation and conversion in the highlands of Madagascar using Vis-NIR spectroscopy,” Geoderma, vol. 133, pp. 281–294, 2006. [51] T. Paz-Kagan, M. Shachak, E. Zaady, and A. Karnielli, “A spectral soil quality index (SSQI) for characterizing soil function in changed landuse,” Geoderma, vol. 230, pp. 171–184, 2014. [52] B. K. Gugino et al., Cornell Soil Health Assessment Training Manual. Ithaca, NY, USA: Cornell Univ. College of Agriculture and Life Sciences, 2009, p. 58. [53] O. J. Idowu et al., “Farmer-oriented assessment of soil quality using field, laboratory, and VNIR spectroscopy methods,” Plant Soil, vol. 307, pp. 243–253, 2008. [54] R. R. Schindelbeck et al., “Comprehensive assessment of soil quality for landscape and urban management,” Landscape Urban Plann., vol. 88, pp. 73–80, 2008. [55] J. Roskin, D. G. Blumberg, N. Porat, H. Tsoar, and O. Rozenstein, “Do dune sands redden with age? The case of the northwestern Negev dunefield, Israel,” Aeolian Res., vol. 5, pp. 63–75, 2012. [56] A. Karnieli et al., “The effect of microphytes on the spectral reflectance of vegetation in semiarid regions,” Remote Sens. Environ., vol. 57, pp. 88– 96, 1996. [57] B. Wise et al., Chemometrics Tutorial for PLS_Toolbox and Solo. Wenatchee, WA, USA: Eigenvector Research, 2006. [58] A. Candolfi, R. De Maesschalck, D. Jouan-Rimbaud, P. Hailey, and D. Massart, “The influence of data pre-processing in the pattern recognition of excipients near-infrared spectra,” J. Pharm. Biomed. Anal., vol. 21, pp. 115–132, 1999. [59] A. Savitzky and M. J. Golay, “Smoothing and differentiation of data by simplified least squares procedures,” Anal. Chem., vol. 36, pp. 1627– 1639, 1964. [60] C. Chang, D. A. Laird, M. J. Mausbach, and C. R. Hurburgh, “Nearinfrared reflectance spectroscopy–principal components regression analyses of soil properties,” Soil Sci. Soc. Amer. J., vol. 65, pp. 480–490, 2001. [61] K. D. Shepherd and M. G. Walsh, “Development of reflectance spectral libraries for characterization of soil properties,” Soil Sci. Soc. Amer. J., vol. 66, pp. 988–998, 2002. [62] P. Geladi, D. MacDougall, and H. Martens, “Linearization and scattercorrection for near-infrared reflectance spectra of meat,” Appl. Spectrosc., vol. 39, pp. 491–500, 1985. [63] G. Downey, A. Gowen, C. Esquerre, and C. O’Donnell, “Use of spectral pre-processing methods to compensate for the presence of packaging film in visible–near infrared hyperspectral images of food products,” J. Spectral Imag., vol. 1, pp. 1–10, 2010. [64] O. Preisner, R. Guiomar, J. Machado, J. C. Menezes, and J. A. Lopes, “Application of Fourier transform infrared spectroscopy and chemometrics for differentiation of Salmonella enterica serovar Enteritidis phage types,” Appl. Environ. Microbiol., vol. 76, pp. 3538–3544, 2010.
[65] I. F. Aymerich, J. Piera, A. Soria-Frisch, and L. Cros, “A rapid technique for classifying phytoplankton fluorescence spectra based on selforganizing maps,” Appl. Spectrosc., vol. 63, pp. 716–726, 2009. [66] Y. He, “The effect of precipitation on vegetation cover over three landscape units in a protected semi-arid grassland: Temporal dynamics and suitable climatic index,” J. Arid Environ., vol. 109, pp. 74–82, 2014. [67] R. G. Congalton and K. Green, Assessing the Accuracy of Remotely Sensed Data: Principles and Practices. Boca Raton, FL, USA: Lewis, 2008, p. 137. [68] G. M. Foody, “Thematic map comparison: Evaluating the statistical significance of differences in classification accuracy,” Photogramm. Eng. Remote Sens., vol. 70, pp. 627–634, 2004. [69] P. Torrione, K. D. Morton, R. Sakaguchi, and L. M. Collins, “Histogram of gradient features for buried threat detection in ground penetrating radar data,” in Proc. IEEE Int. Geosci. Remote Sens. Symp. (IGARSS), Jul. 2012, pp. 3182–3185.
Offer Rozenstein was born in Israel, in 1983. He received the B.A. degree (summa cum laude) in geography and environmental development, and in psychology, and the M.A. degree (cum laude) in desert studies from Ben-Gurion University of the Negev, Beer-sheba, Israel, in 2008 and 2010, respectively. He has been a Ph.D. student at the Remote Sensing Laboratory, Jacob Blaustein Institutes for Desert Research, Ben-Gurion University of the Negev, Sede Boker Campus, Israel, since 2010. He is also a Graduate Research Trainee at the Department of Bioresource Engineering, McGill University, Montreal, QC, Canada, since 2014. He is an author of eight peer-reviewed journal articles and over 30 conference presentations. His research interests include remote sensing and geospatial analysis for environmental applications such as desertification, environmental monitoring, and precision agriculture. Tarin Paz-Kagan was born in Israel, in 1980. She received the B.Sc. degree in biotechnology and environmental study from Tel-Hai Academic College, Kiryat Shmona, Israel, and the M.A. degree (cum laude) from Geography and Environmental Development, Ben-Gurion University of the Negev, Sede Boker Campus, Israel, in 2008 and 2010, respectively. She was a Ph.D. student at the Remote Sensing Laboratory, Jacob Blaustein Institutes for Desert Research, Ben-Gurion University of the Negev between 2010 and 2014, and currently she has a Postdoctorate position at the same laboratory. Her research interests include using hyperspectral and multispectral remote sensing and spatial analysis to evaluate ecosystem function and structure in transformed land-uses. Christoph Salbach received the Diploma degree in geography from the Martin Luther University HalleWittenberg, Halle, Germany, in 2011. He is a Ph.D. student at the Department of Computational Landscape Ecology, Helmholtz Centre for Environmental Research, Leipzig, Germany, since 2012. His research interests include applied remote sensing for agriculture and environmental modeling, hyperspectral image recording, correction, and processing, and machine learning methods for remote sensing applications. Arnon Karnieli received the Ph.D. degree from the University of Arizona, Tucson, in 1988. Since then, he has been the Head of the Remote Sensing Laboratory, Jacob Blaustein Institutes for Desert Research, Ben-Gurion University of the Negev, Sede Boker Campus, Israel. He has published more than 140 peer-reviewed papers in scientific journals. His research interests include processing of spaceborne, airborne, and ground spectroscopic data of drylands with respect to desertification and climate change processes.